APPL ready for a bounceHi traders
Let's have a look at APPL stock chart.
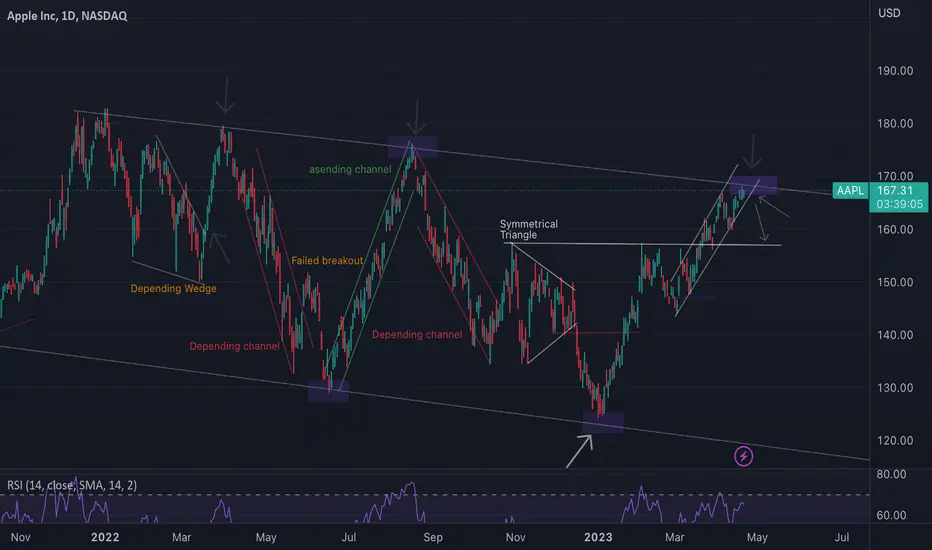
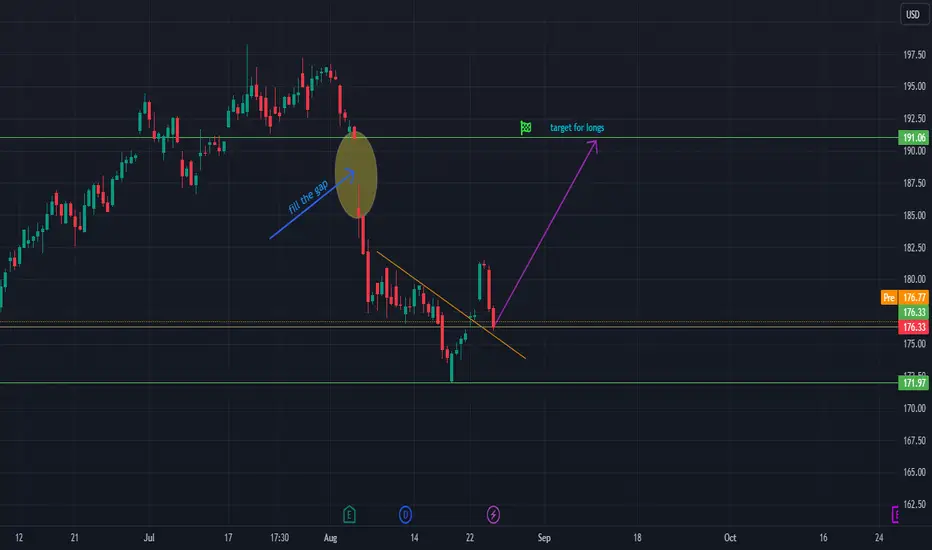
In my opinion APPL is ready for a bounce from the downsloping support which is being tested now.
There's a gap which may get filled .
Moreover, the target for longs would be at 190 $.
If the downslping support fails, probably we will see 171 $ and potential double bottom may be formed.
Good luck
APPL
APPL show a large triangular APPL show a large triangular
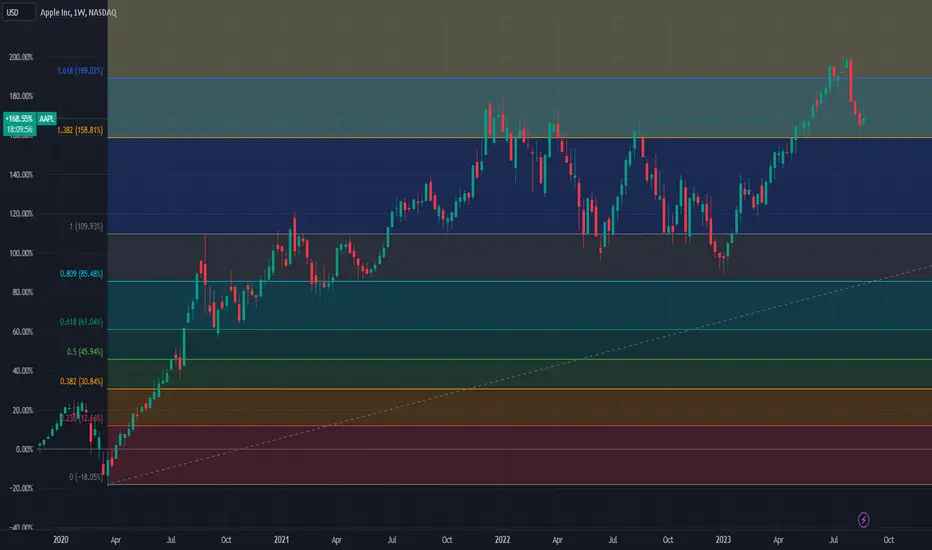
This chart shows the weekly candle chart of Apple's stock in the past 4 years. The graph overlays the bottom to top golden section at the beginning of 2020. As shown in the figure, the recent high click through of Apple's stock has broken through the 1.618 position of the bottom up golden section in the figure, and then fell down, showing a large triangular oscillation and consolidation pattern overall! So for a period of time in the future, the bottom of the graph should be used to determine the bullish and bearish divide of Apple's stock, with the 1.382 position of the golden section above it and the short range below it!
APPL - Swing Targets
$APPL Swing Targets
Based on the analysis conducted my internal algorithm, there is a primarily bearish trend detected; However, there is a possibility of limited upside.
Swing targets have been identified and are indicated on the chart.
Good luck and trade safe!

SIGNS OF WEAKNESSHi Guys, MrBanker is here.
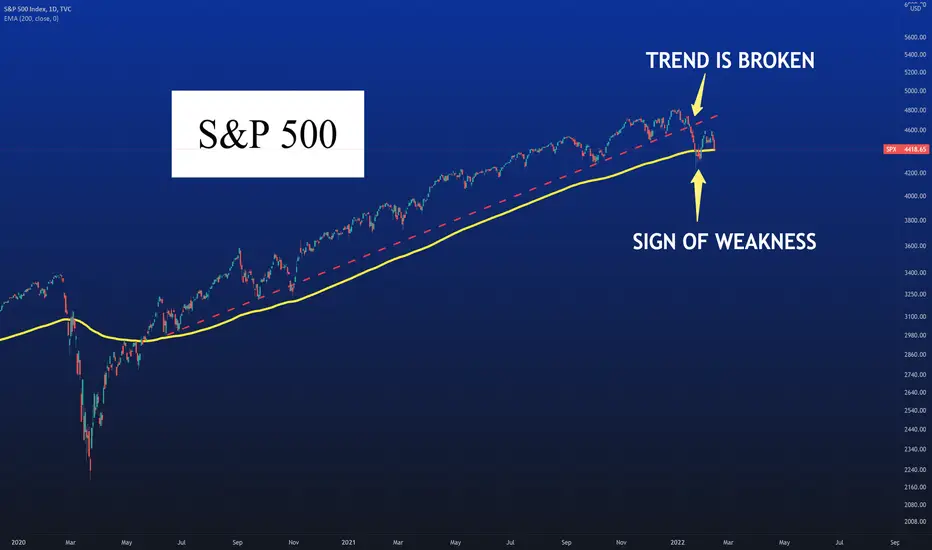
SP500 had been in a long uptrend starting from June 2020. During this period, the trend was succesfully tested 7 times. However, that trend has changed after exactly 19 Months.
- This was the first sign of weakness in the trend.
Additionally, the price-action broke below 200D EMA since FEB 2020.
- This is the second sign of weakness .
Currently, there is a trading war between bears and bulls, therefore, 200D EMA is tested again to validate a bullish or bearish trend.
I cannot judge the direction of the trend based on this analysis but there is an obvious bearish sentiment in the markets.
Trade Safe,
MrBanker
Some Technical Areas For Tesla, Apple & AlphabetHi,
A little guide for you about Tesla, Apple, and Alphabet. Pointed out some key areas from where to take out some profits or if you are interested in some sort of stocks then a couple of scarious from where you can jump in. Not an idea post, more like an analysis but still, it should give you a little picture about them.
Tesla (TSLA)
Recently the Tesla stock has been respected by technical analysis quite nicely. Several calls have worked almost perfectly and short-term targets are reached fairly easily.
Currently, for me, the Tesla stock is in the middle of nowhere. My previous short-term target was around $300 and it has been reached, so I will wait for further price action. If the price goes above $300 then I will consider it as a breakout and I need to see a price action above that to make a decision.
The sweet spot for me is the $190-$220. If the price reaches there then I'm ready to take it but we need to see a quite good selloff - let's see.
So, if you are not in Tesla then wait for a breakout above $300 which can confirm further growth, or wait for a pullback/selloff to the mentioned lower price zone.
Apple (AAPL)
This year has been quite good for Apple, the gain from the bottom is 58%. In the first week of 2023, it bottomed and after that, very solid and consistent grind to higher levels - a new all-time high has reached.
If you are on it then short-, and mid-term investors can think about taking some profits because it has reached to the round number of $200. The round number can act as a resistance level and the price can be stuck there for a while or it can get a rejection to downwards. So, if you don't have a long-term plan with AAPL then there is a place to take out some profits.
If you don't have any Apple shares then you should wait. Firstly, how the $200 act and wait for the price action. If it gets a pullback then you can grab it from the previous highs which now start to act as support levels. These are not the strongest areas but at least you have something to stick with because to buy it from the current price can be quite a huge mistake considering short-term investment.
So, if you see a pullback then be ready to act around 170 to 180 dollars, and the strongest price zone is around ~$150.
Alphabet (GOOG)
Technically the last weekly candle close was a small breakout. $126.5 has been a minor horizontal price level. This level has been a short-term support level and a couple of months ago it acted, and stopped the price, as a resistance. Now, we have this level "smashed" with quite a solid weekly candle and if you are interested then technically you have a light-green light to take it during the retest of ~$126.
Stay cautious after you have seen a monthly or weekly close below this level.
Regards,
Vaido

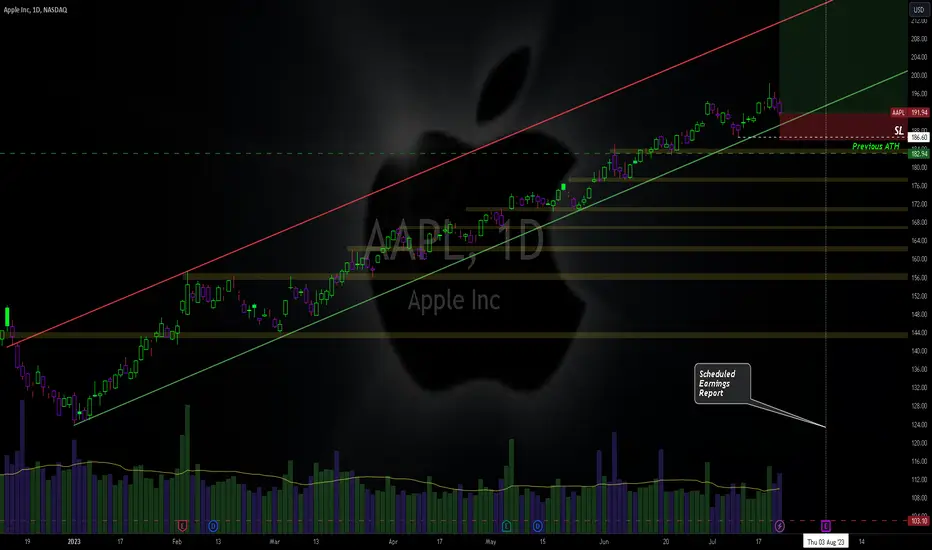
$APPL -Buy Opportunities - Apple Inc. ($APPL) nearing Support Trendline of its Rising Channel.
Looking for long opportunities in the short-term,
remaining positive TA speaking until the upcoming Earnings Report.
Until 3rd of August positive momentum has captured $APPL ;
(may be interreupted from Feds upcoming week Rate Hikes Decision)
SL is adjustable from here, with the nearest point being the last
Higher Low market structure,
or the previous ATH depending on your risk apetite.
Until the next one;
trade smart
TRADE SAFE
*** Note that this is not Financial Advice !
Please do your own research and consult your own Financial Advisor
before considering partaking any trading activity based solely on this Idea
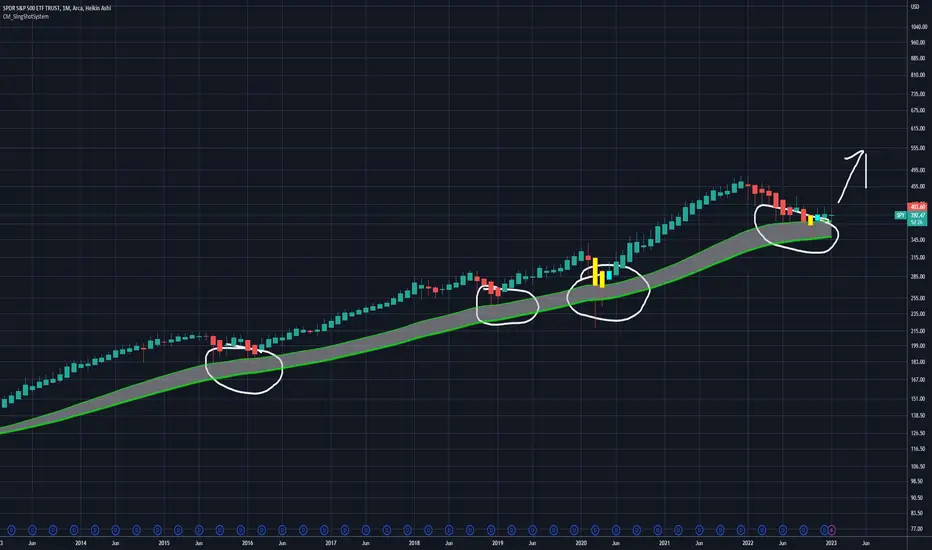
Market has bottomed..Market about to enter a new Bull Cycle. See my chart. We are bouncing off the wave that I have displayed.
I circled all market bottoms in the past years since 2010.
A trader’s week ahead playbook – just roll with it Risky assets continue to climb the wall of worry, but the reality is we’ve seen conditions ripe for equity appreciation. Granted, the global central bank balance sheet is falling but the rate of change is contained, and US bank reserves are not falling as fast as feared.
Liquidity is currently not the bearish catalyst for equity drawdown that many thought it might be.
Economic data continues to frustrate those positioned portfolios for a recession - US consumer confidence, new home sales, and durable goods all come in hotter-than-expected. At the same time, US core PCE inflation was a touch softer at 4.6%, with softer core inflation prints also seen in Japan (Tokyo), Europe and Canada.
It seems good economic news is truly good news for stocks and high beta FX – case in point, on the week, we saw the market’s expectations for the peak fed funds rate (currently seen in November) increasing by 7bp to 5.4%. Amid tighter expected Fed policy, US 2yr Treasuries gained 15bp on the week (to 4.89%) and yet despite the rise in bond yields the NAS100 gained 2.2% - closing out the best first half ever, with a remarkable gain of 39%.
We’re also seeing bullish breakouts in the US500, and EU equities, with the SPA35 breaking out, while the skew is risk is that the FRA40 retests the 17 April highs.
As we see in the calendar below, there is a heavy focus in the week ahead on the labour market. Unlike recent months, as long as the growth and jobs data stay firm and highlights that a US recession is a 2024 story, and with inflation grinding to target, then the equity (and risk) bulls will continue to buy dips. The risk bulls will want a solid nonfarm payrolls report, but any goodwill will be conditional on average hourly earnings (AHE) holding below 4.3%
In FX markets, the USD has been frustrating and just when the bulls we’re hoping for a break of 103.38 resistance (in the USD index), the sellers reversed the goodwill. We remain on intervention watch in Japan, notably with the trade-weighted JPY falling 0.5% on the week, and well below levels since in Sept 2022, when the MoF bought Y2.8t. We’ve seen clear signs the PBoC has reached its tolerance level on USDCNY and is pushing back. USDCNH remains central to all USD moves.
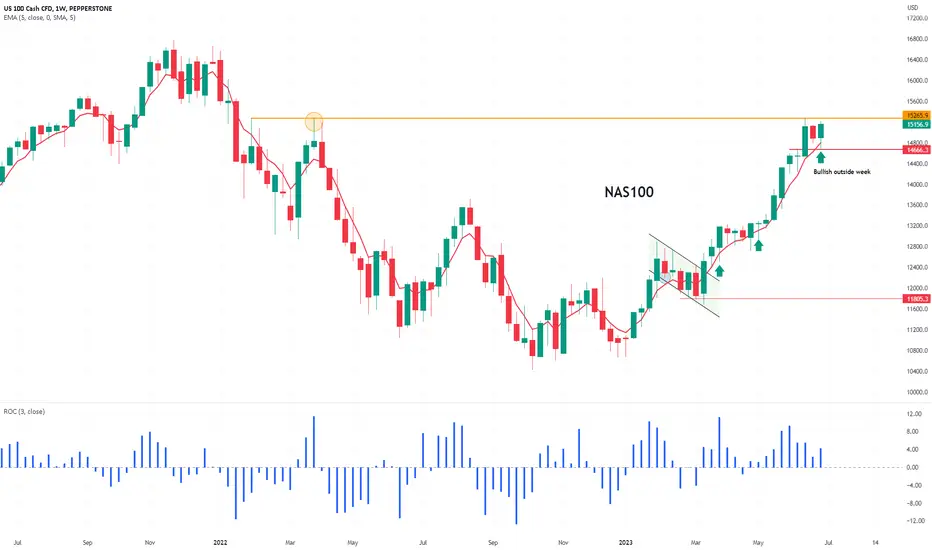
Let’s see if the new month brings a new trend – but knowing that the NAS100 has rallied in the last 15 consecutive months of July, it feels like the pain trade is still to the upside and the odds are skewed for higher levels – an open mind will always serve us well in trading, but for now, I am happy to just roll with it.
Tactical play of the week : Long NAS100 (stop orders) above 15,220. A new month, but nothing changes – Ride the momentum, and the strong get stronger.
Rearview alpha plays:
• G10 and EM FX play of last week: Long NOKSEK (+1.8% last week), long USDRUB (+5.4%)
• Equity indices play of last week: Long SPA35 (+3.5%) – to the highest levels since Feb 2020
• Commodity plays of last week – short corn (-16%), long Cocoa +4.6% (strong uptrend)
• Equity plays for the radar – Bega Cheese (BGA.AU) – shares have fallen for 8 days in a row. Apple (eyeing $200 with a market cap over $3t).
The key event risks for the week ahead
RBA meeting (Tuesday 14:30 AEST) – It's hard to recall a time when making a call on an RBA policy decision was so finely balanced. One could make just as good a case to hike, as they could to hold. The economist community are evenly split (14 of 27 economists are calling for a pause), and Aussie rate futures are pricing a 40% chance of a hike. Given this dynamic, the RBA may lean on the path of least regret and hike. On the week I see AUDUSD trading a 0.6750 to 0.6580 range. AUDNZD is the cleanest play on the RBA meeting and relative policy divergence, and on the week, I would look to sell rallies into 1.0950/60.
US ISM manufacturing (Tuesday 00:00 AEST) – the market expects a slight improvement in the pace of decline with the consensus set at 47.2 (vs 46.9 last month). We may need a reading above 50 to get the USD fired up, although a read above 50 would certainly surprise. Good data seems to be a positive for risky assets despite the move higher in bond yields, so expect equity to rally on a stronger-than-expected print.
US weekly jobless claims (Thursday 22:30 AEST) – The economist consensus is for 245k weekly claims. Last week, we saw a strong reaction to the lower-than-expected claims print, so we know the market is looking at this data point closely. That said, we’d need a big increase/decrease from last week’s print (of 239,000) to move the dial this time around.
JOLTS job openings (Friday 00:00 AEST) – the consensus here is for job openings to fall to 9.98m (from 10.1m). A pullback below 10m openings would be further relief for risky assets. A big upside surprise may see US treasuries rally (yields lower) and USDJPY should find sellers.
US ISM services (Friday 00:00 AEST) – the market consensus is for slightly stronger growth in the US service sector at 51.3 (50.3). Again, we look for extreme reads vs consensus, but above 52.0 would really push back on the idea of a near-term economic slowdown.
US non-farm payrolls (Friday 22:30 AEST) – the marquee economic data point of the week, where the market consensus is for 225k net jobs (the economist’s range is seen between 263k and 124k). The unemployment rate is eyed to fall back to 3.6% (3.7%), with average hourly earnings seen at 4.2% YoY. The form guide suggests the risk is for a number above 200k, having beaten expectations for 14 straight NFP prints. A big upside surprise should see USDJPY rally hard and push the BoJ/MoF a step closer to JPY intervention.
Canada employment report (Friday 22:30 AEST) – the consensus is for 20k jobs to have been created, and the unemployment rate to lift a touch to 5.3%. With 13bp of hikes priced for the 12 July Bank of Canada (BoC) meeting, the outcome of the jobs report could influence that pricing and by extension the CAD. There has clear indecision on the USDCAD daily of late, subsequently, I would look to buy/sell a break of 1.3285 or 1.3116.
Mexico CPI (Fri 22:00 AEST) – those that sit in the camp that Banxico cut rates in Nov/Dec will be closely watching the CPI print. The market expects a further dip in headline inflation to 5.07% and core inflation to 6.87% (from 7.39%). Carry traders are still drawn to the MXN and happy to jump on any weakness, subsequently, USDMXN seems likely to test the recent lows of 17.0227.
Central bank speakers
ECB – Villeroy, Guindos, Lagarde (Sat 02:45 AEST)
BoE – Catherine Mann (Sat 00:30 AEST), Bailey (Sunday 17:30 AEST)
US – FOMC minutes (Thurs 04:00 AEST), Williams and Logan
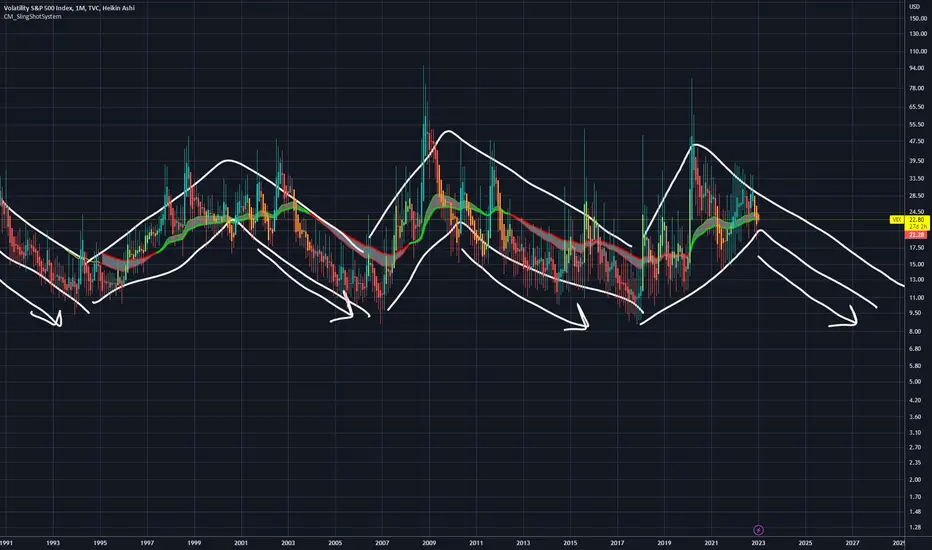
VIX to teens coming soonVIX has been trading high, it's doing the same pattern since the 90s. I expect market will fuel and finally bounce on VIX following this trend.
Nasdaq & tech has bottomedNasdaq & tech has bottomed in Oct 2022. As seen on the previous dips of covid march 2020 and the 2018 crash, all are buys. I expect us to rise rest of the year for 2023.
Market is still fueling against the Fear psychology that is still happening.

AAPL VR-Headset cause EXPOLSION Rally😎Hi Traders, Investors and Speculators of Charts📈📉
Apple AAPL recently made a new ATH after its introduction of VR Headsets. From technical indicators, we can see that there is still a lot of buying strength in this rally which could likely result in the price going even higher. We use the trend-based Fibonacci Extension to get a possible target at roughly $220.
_________________________________
A bit more on the Tech: The Apple Vision Pro AR headset is expected to offer advanced features, high-quality display, and immersive experiences. It is rumored to have a sleek design, lightweight build, and premium materials. The headset may incorporate both augmented reality (AR) and virtual reality (VR) capabilities, providing users with a wide range of interactive and immersive experiences.
One of the key concerns with this technology is the pricing. The Apple VR headset is expected to be relatively expensive, potentially limiting its accessibility to a broader consumer market. Another concern is the potential for motion sickness or discomfort during extended use, which has been a common challenge with VR headsets.
The introduction of Apple VR headsets can potentially change the way we do things in the future. Firstly, it can revolutionize entertainment and gaming experiences, offering users a more immersive and realistic environment. Additionally, it can have significant implications for industries such as education, training, and communication, providing new ways to learn, collaborate, and connect with others remotely.
Overall, the Apple VR headsets hold the promise of delivering cutting-edge technology and innovative experiences, although there are considerations regarding affordability and user comfort that need to be addressed.
Would you get one?
_______________________
📢Follow us here on TradingView for daily updates and trade ideas on crypto , stocks and commodities 💎Hit like & Follow 👍
We appreciate your support !
CryptoCheck

Apple ready to resume higher after pullback. In this article, I want to bring attention to the failure break on Apple yesterday.
It's true, good news occurs in an uptrend, but should be careful when good news pushes sentiment to extremes. Must be an over-crowded reaction after the new product announcements. As you know the big announcement was the debut of the Apple Vision Pro. However, maybe there was a bit of too much optimism from the buyers, so the market normally does the opposite... when least expected.
From an Elliott wave principle looks like we can see some retracement before uptrend may resume which is in full progress now. We talked about this bull run already back in January.
Well, before bull run can be done, we need five waves up. But notice that's not the case yet. In fact, there can be wave four pullback ahead, so its worth
wait for a retracement first and then maybe look for longs from 165-170 area, where we also see a gap from May 04 earnings.
I also talked about this chart in our webinar today here on TV, check the link to the recording below.
Grega

AAPL Share Price Hits All-time HighIt happened yesterday, a few hours before the start of the WWDC 2023 conference, which presented Apple's Vision Pro VR headset, as well as a number of other products from the company.
This is a new category in the company's lineup. Apple Vision Pro overlays virtual objects on top of real space, which is filmed by multiple cameras. Management is carried out by voice, gaze and hand movements. But the device has a wheel, like on the Apple Watch, with which you can adjust the level of immersion in the virtual space.
Marketwatch writes that the Apple Vision Pro could be a big hit like the iPhone. The mixed reality headset is expected to be available for purchase in early 2024 for USD 3,499. Reuters reports the opinions of experts who compare the headset to the advent of computers: still expensive, but with the potential to become a product for everyone.
However, AAPL shares are down from their all-time highs today in premarket trading. Perhaps after some product launch hype, AAPL's share price needs to correct in the current uptrend (shown in blue). Note the high rate of decline (estimate the height of the bearish candle). It is possible that the activity of the bears will lead to the fact that the price of the AAPL share will decrease to the lower border of the channel (shown in blue).
According to 41 analysts polled by the WSJ, only 1 recommends selling AAPL stock. AAPL's median target price for 2023 is USD 185.
This article represents the opinion of the Companies operating under the FXOpen brand only. It is not to be construed as an offer, solicitation, or recommendation with respect to products and services provided by the Companies operating under the FXOpen brand, nor is it to be considered financial advice.

Apple Stock Continuously Breaks Strong Pressure?Apple Stock Continuously Breaks Strong Pressure?
This chart shows the weekly candle chart of Apple's stock from the end of 2019 to the present. The graph overlays the line between the low and low points of the past three years, the line between the high and high points, and the horizontal line of the top short start position! As shown in the figure, Apple's stock quote has already broken through the strong pressure of the previous top short start position this week, but it is clear that bulls are unable to close above it! In the future, it is likely to retreat to the upper edge of the triangle and wait for the direction near the end of the triangle to break through again!

APPLE BUYHello, great opportunity to invest in Apple shares. There is a high probability of going up. With breaking the strong resistance at 156. With a model forming. bullish flag.Note: If you like this analysis, please give your opinion on it. in the comments. I will be happy to share ideas. Like and click to get free content. Thank yo

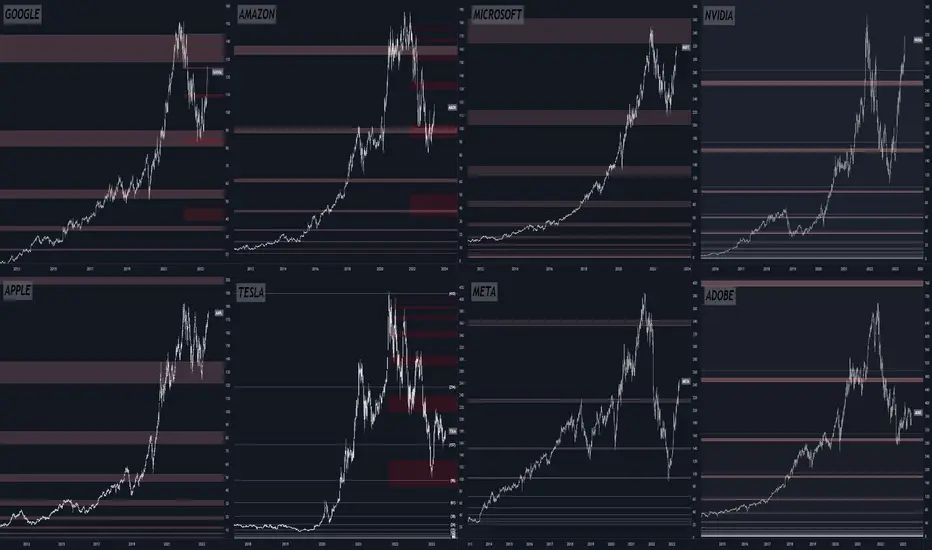
Overvalued Tech: Time for Tangible Assets & Fair ValuationsThe tech sector, specifically the 'Big Tech' companies have seen massive gains since the massive accumulation in 2010-2014. However, these increases seem disconnected from the companies' actual value or tangible contributions to the real-world economy. Their high price-to-earnings ratios suggest overvaluation and potential for a market correction.
Invest in sectors with real-world utility and reasonable valuations - Allocate capital to sectors like industrials, materials, consumer staples, or healthcare. These sectors provide tangible products and services and often have more reasonable valuations.
1. High Valuations: Tech stocks, in particular, often trade at high multiples of their earnings or revenues. These high valuations can make them more vulnerable to market downturns, as they can fall more dramatically if investors reassess their growth prospects or risk tolerance.
2. (GOOGL, APPL, AMZN, MSFT, META, NVDA, ADBE, and TSLA) all represent a significant portion of the SNP-500 index due to their large market capitalizations.
3. So, in a S&P-500 meltdown , these tech companies could potentially see significant declines in their stock prices due to these factors. However, it's important to remember that the specifics would depend on a wide range of factors, including the reasons for the market downturn, the companies' financial health and growth prospects, and overall investor sentiment.
4. I would choose Tesla as the only pick out of all 8 as this company has shown lots of potential compared to our tech giants of the now. Even with the upbringing of AI it is not enough to save google or meta, but Apple and Microsoft might hold up strong as they are largest caps.
5.
Google (Alphabet) : ~$1.5 trillion
Apple Inc. (AAPL): ~$2.5 trillion
Amazon (AMZN): ~$1.7 trillion
Microsoft (MSFT): ~$2.2 trillion
Meta Platforms : ~$1 trillion
NVIDIA (NVDA): ~$500 billion
Adobe (ADBE): ~$300 billion
Tesla (TSLA): ~$800 billion
TOTAL = 10 Trillion roughly
APPL - Bearish Harmonic - Double Top?APPL - Bearish Harmonic, Potential Double Top.
Downsize targets shown on Chart.
Enjoy!

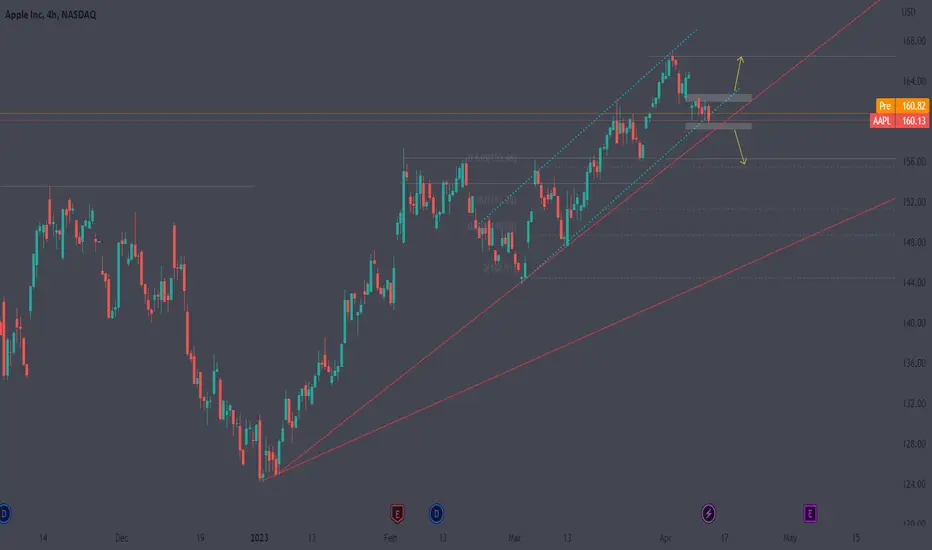
APPL - Where to next?NASDAQ:AAPL APPL - Where to next?
We got a beautiful rising channel as well key trendline areas.
Highs: 162
Lows: 158
Now be aware we do have the gap above but if we break below the lows a clean close below the red trendline up, price could easily reach 156. However, if we are to break the highs, I expect 164/168 closing that gap above.
Ignoring the noise and focusing on price is key!
Trade Journal
APPL Wave AnalysisI included the text analysis in the chart.
Short term LONG potential for APPL.
We are still in a correction. Depending on how it evolves, we can take future actions.
LONG beyond the marked price level or SHORT if the price doesn't go past the marked level.
If you agree with this idea, please consider sharing it with others. Thank you.
Disclaimer: Technical analysis is for informational purposes only and should not be construed as financial advice. Trading decisions based on technical analysis are the sole responsibility of the individual trader.

APPL - Bearish Harmonic, Rising WedgeAPPL - Bearish Harmonic, Rising Wedge
Apple displays Bearish Harmonic and Rising Wedge patterns, suggesting a potential downside.
Earnings release on Thursday; monitor the wedge.
Downside targets shown on Chart.
Enjoy!

$APPL #Apple Can FallTraders and Investors,
As the earnings seasons is here, looking at APPLE shows that there could be a fall coming. Reasons:
1. W pattern completed
2. Trend Line
3. Bearish Structure
The last short set up gave us great profits.
Manage the risk and make sure that you are watching stock movement closely along with US30 (Dow Jones)
Rules:
1. Never trade too much
2. Never trade without a confirmation
3. Never rely on signals, do your own analysis and research too
✅ If you found this idea useful, hit the like button, subscribe and share it in other trading forums.
✅ Follow me for future ideas, trade set ups and the updates of this analysis
✅ Don't hesitate to share your ideas, comments, opinions and questions.
Take care and trade well
-Vik
____________________________________________________
📌 DISCLAIMER
The content on this analysis is subject to change at any time without notice, and is provided for the sole purpose of education only.
Not a financial advice or signal. Please make your own independent investment decisions.
____________________________________________________

Amazon & Appleboth Amazon and Apple are making very bearish reversal formations which might drop drastically the price to a new low on a big TF, Daily. Remember it's a mid to long-term view; therefore, it could be invalid. However, these are well-known wave structures, and they are accurate most of the time, but certainty does not exist in charts of course.

Apple Short?Apple is approaching historical resistance here. Earnings is coming up on the 4th of May and from what ive read about Mac sales being potentially down 40% will apple miss their earnings? thoughts?