AAPL Potential For Bearish Dip | 7th March 2022Prices are on a bearish momentum. We see the potential for further bearish dip from our Sell Entry at 162.26 in line with 38.2% Fibonacci retracement moving towards our Take Profit at 152.64 in line with 61.8% Fibonacci projection. Our bearish bias is supported by prices trading below Ichimoku cloud indicator. Alternatively, prices might move towards the stop loss level at 168.75 in line with 50% Fibonacci retracement and 78.6% Fibonacci projection.
Any opinions, news, research, analyses, prices, other information, or links to third-party sites contained on this website are provided on an "as-is" basis, as general market commentary, and do not constitute investment advice. The market commentary has not been prepared in accordance with legal requirements designed to promote the independence of investment research, and it is therefore not subject to any prohibition on dealing ahead of dissemination. Although this commentary is not produced by an independent source, FXCM takes all sufficient steps to eliminate or prevent any conflicts of interest arising out of the production and dissemination of this communication. The employees of FXCM commit to acting in the clients' best interests and represent their views without misleading, deceiving, or otherwise impairing the clients' ability to make informed investment decisions. For more information about the FXCM's internal organizational and administrative arrangements for the prevention of conflicts, please refer to the Firms' Managing Conflicts Policy. Please ensure that you read and understand our Full Disclaimer and Liability provision concerning the foregoing Information, which can be accessed on the website.
Appleinc

AAPL Potential For Bearish Dip | 7th March 2022Prices are on a bearish momentum. We see the potential for further bearish dip from our Sell Entry at 160.22 in line with 50% Fibonacci retracement moving towards our Take Profit at 152.64 in line with 61.8% Fibonacci projection. Our bearish bias is supported by prices trading below Ichimoku cloud indicator. Alternatively, prices might move towards the stop loss level at 168.75 in line with 50% Fibonacci retracement and 78.6% Fibonacci projection.
Any opinions, news, research, analyses, prices, other information, or links to third-party sites contained on this website are provided on an "as-is" basis, as general market commentary, and do not constitute investment advice. The market commentary has not been prepared in accordance with legal requirements designed to promote the independence of investment research, and it is therefore not subject to any prohibition on dealing ahead of dissemination. Although this commentary is not produced by an independent source, FXCM takes all sufficient steps to eliminate or prevent any conflicts of interest arising out of the production and dissemination of this communication. The employees of FXCM commit to acting in the clients' best interests and represent their views without misleading, deceiving, or otherwise impairing the clients' ability to make informed investment decisions. For more information about the FXCM's internal organizational and administrative arrangements for the prevention of conflicts, please refer to the Firms' Managing Conflicts Policy. Please ensure that you read and understand our Full Disclaimer and Liability provision concerning the foregoing Information, which can be accessed on the website.

apple stocks are probaly going upbased on my experience and my analysis like to share with you my thoughts on apple stocks these days

APPLEDue to market condition APPLE would consolidate more in the form of decending triangle.
In case ~152 support is broken then will go to ~135 range.
I think writing covered calls on exiting stocks should be safe for now next results.
This could very well go for a toss if APPLE comes with new product or acquire any other company.
Acquisitions would be more common in down market.
Note : This is not investment/trading advise. Please do you own DD.

Simple technical analysis for AppleApple gave us a clear signal telling us it's bearish for the coming days

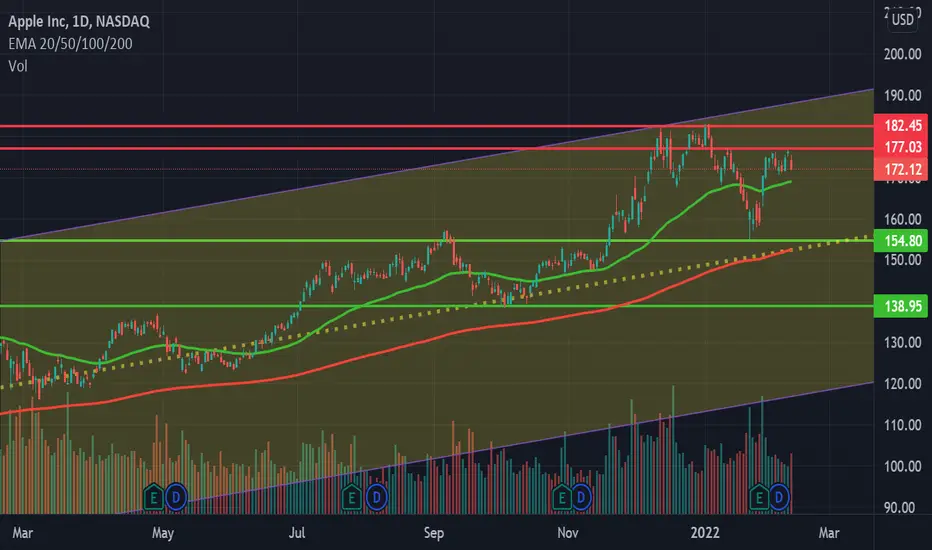
Apple in a dicey zoneApple also looking a bit hot for entry right now. Should enter only when it cool downs to the levels of 152 and 168 forms a bottom and bounces from there. Stop loss for Apple should be around 138.95. If Apple Goes of Grows above 177 Weekly closing you can take a fresh entry for the targets of 182 or 190. So either above 177 or near 152.
DOW Theory Consolidation & Long AAPL Apple Inc has recently recovered from a head & shoulder formation. The recovery of the price since the bottom of the head and shoulder formation seems to have recovered to more than the 61.8 Fibonacci, meaning that we can expect the price of Apple to continue being bullish. However, we can also expect a consolidation back to the 38.2 level of the last power move, which has not been touched yet, and which coincides with the strong head and shoulder support. After that, we can expect Apple to make a new high. However, keep an eye on US indices for more reference. Also watch out for a possible negative movement from the ma 21 and 55 death crossing.
NOT FINANCIAL ADVICE!

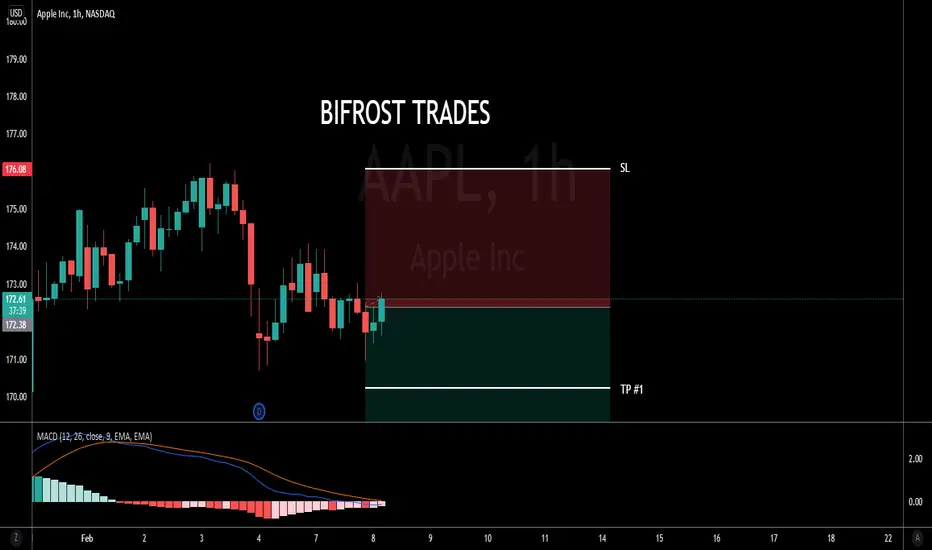
APPL Hrly short | Algorithm tradingAPPL hrly short
shortstop @ 172.04
TP #1 @ 170.19 77.61% wr
TP #2 @ 166.68 56.72% wr
SL @ swing high 176.12 11.94% hr
WR and HR determined from past trades take on this pair.
Find more trades like this on my profile or on Bifrost Trades.
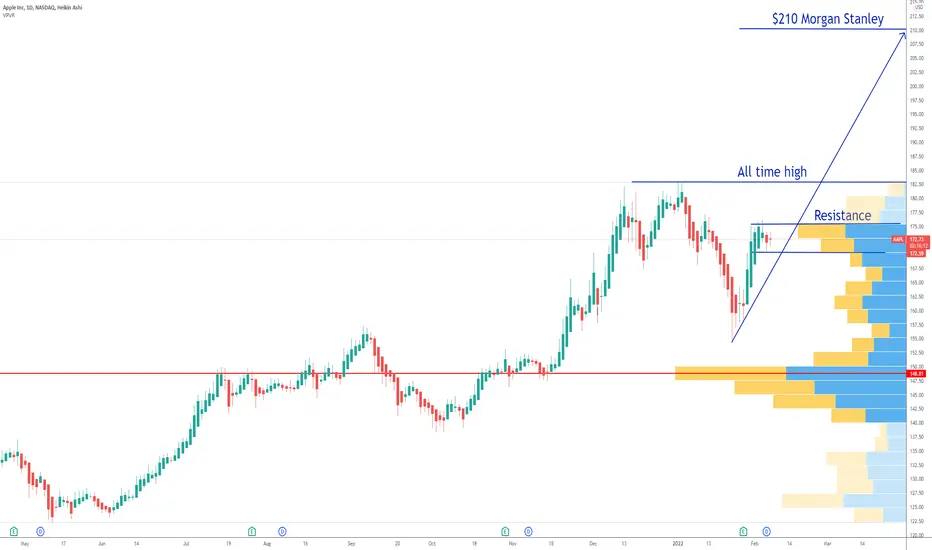
AAPL upgraded by Morgan StanleyIf you haven`t bought the dip here:
then you should know that on 1/28/2022 Katy Huberty from Morgan Stanley Boosted the Price Target to Overweight from $200.00 to $210.00
Looking forward to read your opinion about it. how soon it will reach that price target?
Apple Inc Analysis StrategyHaving been using apple products for about 7 years, tonight im going to take a few percent of my stake in Apple. However, all of that only happens if there is a break in the Resistance on the Parallel Channel. Let's Go!

Apple Analysis 29.01.2022Hello Traders,
welcome to this free and educational analysis.
I am going to explain where I think this asset is going to go over the next few days and weeks and where I would look for trading opportunities.
If you have any questions or suggestions which asset I should analyse tomorrow, please leave a comment below.
I will personally reply to every single comment!
If you enjoyed this analysis, I would definitely appreciate it, if you smash that like button and maybe consider following my channel.
Thank you for watching and I will see you tomorrow!

Apple trend followingapple have made a fibo 0.618 level wich is the same point of trend line test point and went up to follow the main trend.
now we can buy as long as 38% fibonacci is a support at aprox price of 166

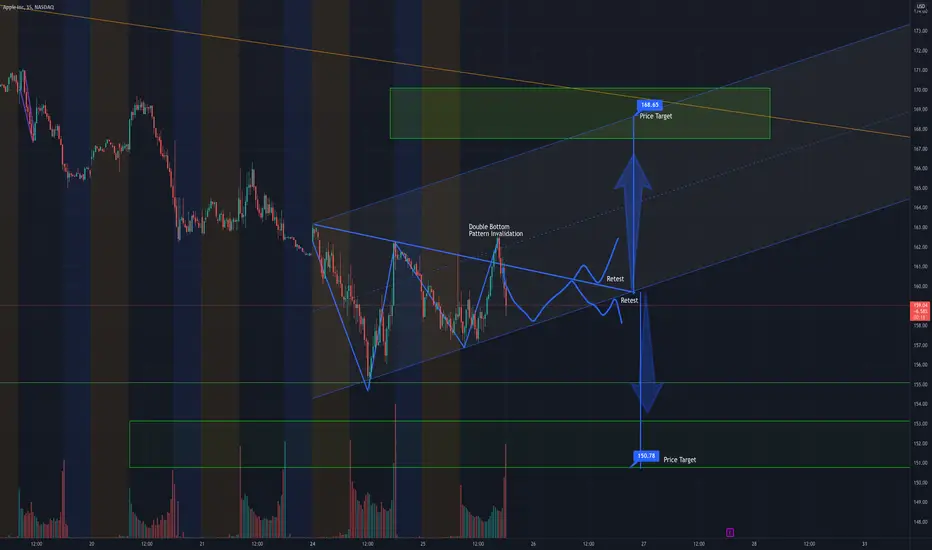
Apple 15M ChartPrevious Double Bottom Pattern (Invalidated)
New Pattern:
Symmetrical Triangle
Price target if breakout to the upside: $168- $169
Price Target if break to the downside: $150- $151
If Price Breaks Above Top of Triangle: Wait for a Retest (to confirm support), Then Enter Long
If Price Breaks Below Bottom of the triangle, Wait for a Retest (to confirm resistance), Then Enter Short
Note:
Tomorrows Fed meeting could have either positive or negative implications for the Market in General.
#AAPL #Apple keeps a doctor nearWell Apple looks to buywith SL 154 and targets to swing till 168, though it is weak and will (IR) will break SL but its just skidding, SL is hammers low, but yes keep SL's intact. Im sorry i cant put more images here

AAPL Record Revenue | Short term Price Target1Q Apple Earnings:
Revenue: $123.95Bil vs $119.05Bil est
EPS: $2.10 vs $1.90 est
My short term price target is the $170 resistance.
Looking forward to read your opinion about it.

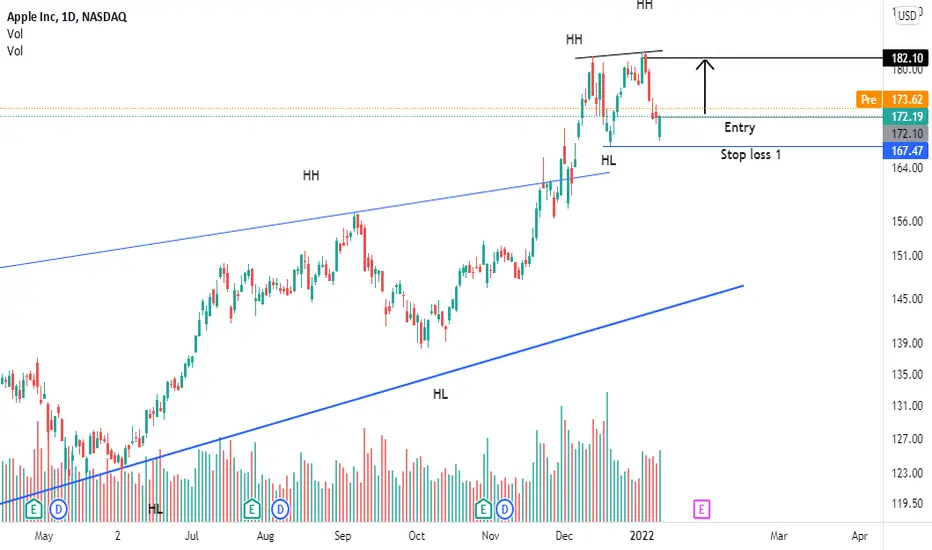
Apple APPL Trade PlanEntry 172-173
Take Profit 182 trail if closes above 183
if the price drop below166-167
$AAPL Correction Prediction PT $157 to $165 rangeAs Apple continues to absorb the entire global share of wallet, bad things can happen.
When it does dump, it will take indexes and grow with it.
Bear PT = $157-165
Bull PT = $185-200
Odds are this starts next week unless the Fed backtracks on starting tapering.
Time will tell, this is clown world folks. No matter what happens, this is good for no one except those in $AAPL.
Disclosure I have puts.
Apple Analysis 18.01.2022Hello Traders,
welcome to this free and educational analysis.
I am going to explain where I think this asset is going to go over the next few days and weeks and where I would look for trading opportunities.
If you have any questions or suggestions which asset I should analyse tomorrow, please leave a comment below.
I will personally reply to every single comment!
If you enjoyed this analysis, I would definitely appreciate it, if you smash that like button and maybe consider following my channel.
Thank you for watching and I will see you tomorrow!

UPDATE: APPLE UP 99% after bullish signal. What's next?Please Like or Follow if you enjoyed this content.
UPDATE: My "Supertrend Ninja" indicator predicted the big pump of 99% in April 2020. Gains are in yellow. It also predicted some big drops (in purple) of -33% and -30%. Note: In 2021 the "Supertrend Ninja" only gave 3 bullish signals. Price is currently still in an uptrend since the bullish signal of Oct 2021. Aiming for 193.59 (1.618 fib). RSI is moving towards 70, this is usually where the magic happens.
Supports and Resistances are highlighted as grey blocks. Profits can be taken at each grey block. Supports and resistances are automatically drawn using my indicator "Yo Show Me Some Support - and Resistances". Pun intended.
Thank you for reading.
Namasté 🙏
What Indicators Do I Use:
In the chart I am using my "Supertrend Ninja indicator", which is a trend-following indicator (Green and red vertical line with arrows).
When the background of the candlestick closes green (vertical line) with an upwards pointing pink arrow. It indicates a possible bullish (up)trend.
With each trade proper risk management is essential. Either by using my script "Trailing Stoploss Bottom Activation indicator", visible as grey dots below the candles. Which sends an alert, when current price goes below the previous candle low. Or using my "Heikin Ashi Trailing Stoploss Activation", the indicator below with green and red blocks. Or third option, exit when the Supertrend Ninja indicator displays a vertical red line with a downwards pointing black arrow. Remember, the first stop(loss) is always the cheapest stop.
Disclaimer: Ideas are for entertainment purposes only. Not financial advice. Your own due diligence is highly advised before entering trades. Past performance is no guarantee of future returns.

I recommend AAPL for purchaseas we see on chart of apple we see violent break of resictense with big volume that what give high probability of rise the market

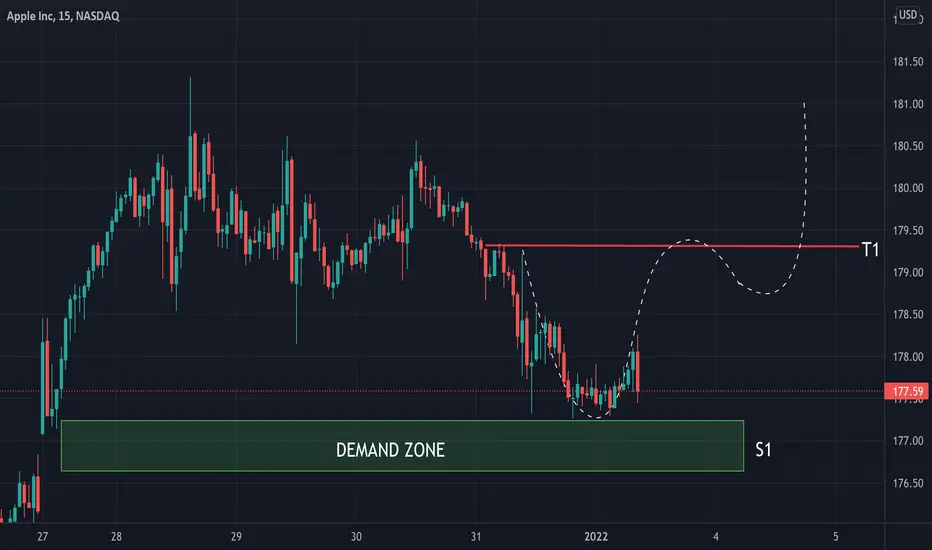
AAPL | Price is near huge Demand Area.When it comes to AAPL , right now price is near the demand zone, where price got gaped up because of huge demand and the price is likely to get rejected from this area. If you are going in, make sure to place the stop below the demand zone. If the price gaps down and open below the S1, then don’t take the long position.
If you find this technical analysis useful, please like & share our ideas with the community.
What do you think is more likely to happen? Please share your thoughts in comment section. And also give a thumbs up if you find this idea helpful. Any feedback & suggestions would help in further improving the analysis.
Good Luck!
Disclaimer!
This post does not provide financial advice. It is for educational purposes only! You can use the information from the post to make your own trading plan for the market. But you must do your own research and use it as the priority. Trading is risky, and it is not suitable for everyone. Only you can be responsible for your trading.
AAPL (APPLE INC.) WILL DOWN BEFORE UPAAPL (APPLE INC.) looks like just finished 1st wave and it will come downside to making the 2nd wave around $172 and after it, we can see a good rally to the upside on apple.
DISCLOSURE - Please be informed that the information I provide is not a trading recommendation or investment advice. All of my work is for educational purposes only. All labeling and wave count have been done by me manually and I will keep changing according to the LIVE MARKET PRICE ACTION. So don't bias, hope on my trade plans. Try to learn Elliott Wave or other strategies and make your own strategy. Following is not that much easy. I am not responsible for any losses if u took the trade according to my trade plans.
#AAPL #APPLE

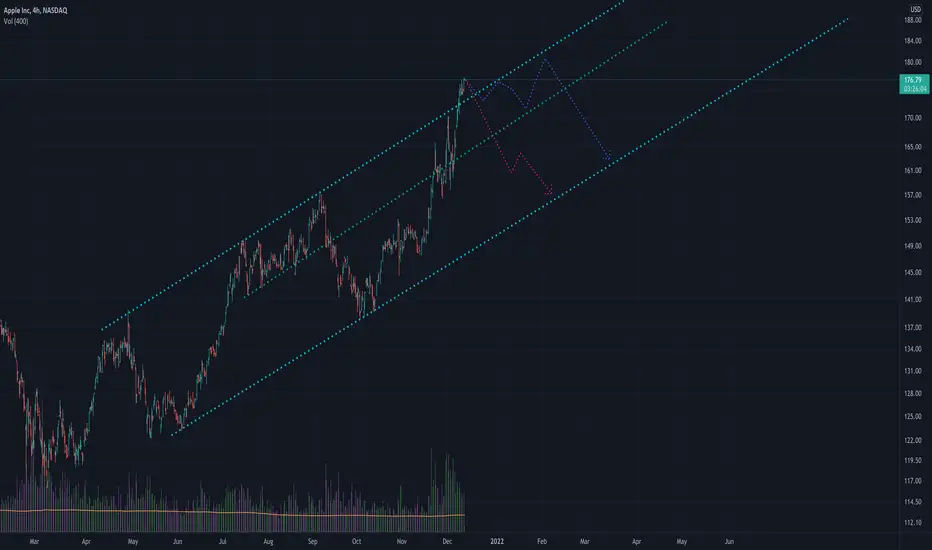
Apple inc index trendThere is a bearish trend in this index that in case of failure and stabilization above 179 in the 4-hour time frame, targets above 180 will be activated, otherwise it will fall to the support range of 167.80
