APPLE entry levels LONGAPPL stock correction before EARNINGS is a good opportunity to enter.
ENTRY LEVELS LONG:
$126
$120
$113 STRONG BUY
Applestock
APPLE at the support line in an up-trendHello everyone,
Today, Apple hit the lower support-line. Wich we can speculate from, it's going to rise now. We can never be 100 percent sure but I do think it'll go up now until it hits the leverage-line.
I do want to tell all of you to trade with care, and don't just blindly follow me.
As always: Have a nice day!

Apple (AAPL) Crash in 2021?Dear Traders,
I have identified Negative Divergence on many indicators signaling bearish trend for Apple in 2021.
We are in overbought territory, every time we reach theses levels, correction takes place.
Lets see if history repeats itself and we see Apple correction in 2021 yet again.


AppleHi guys,
I redid my Apple chart to make it more clear for new traders. as you can see Apple is on an up-trend right now, and it hit the support line. so we can assume it is going up now.
As you can see, there are two trend lines, one is from a smaller time period than the other, so this one is more accurate. but when we compare the two, we can have a better estimate of when the trend is going to change.
My recommendations: I would buy Apple now and put the stop loss as I did on the chart. this way you won't lose much money if it goes down, and when you sell at the top you will make much profit. the stop loss of course being at the resistance line. the price is also under the moving average which is also an indicator that the price will go up.
I will keep you updated on Apple so you know when the time comes to sell.
As always: trade with care, don't just blindly follow me.
have a great day!
Lothar Veys

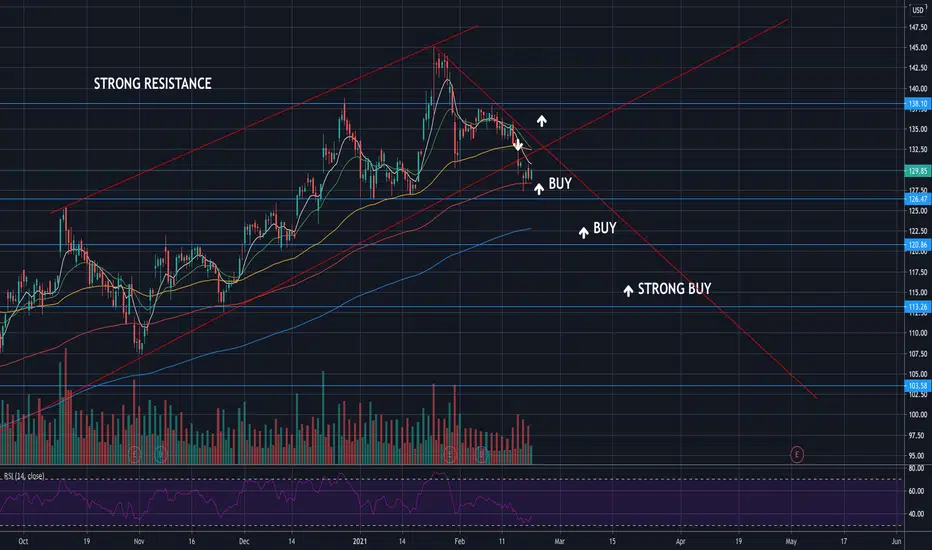
APPL analysis entry levels LONGAPPL is waiting for a breakout. We could go higher if we break the $138 resistance. You can enter at $138 with a pullback from above. If we go lower, start BUYing around $132.
ENTRY LEVELS LONG:
$138 AFTER THE BREAKOUT
$132
$127

Apple in an up-trend Hi,
this is the third chart I made of APPLE and as you can see there are more indicators. I used the Ichimoku cloud indicator and a moving average. price just hit a small support level so I think it will go up from now on. you can also see where I placed the stop/loss so you get maximum profit.
if you don't understand something from this chart, because it's so messy. just ask in the comments or send me a message.
Also, you should not just buy and sell because I say so, I can make mistakes and if you don't like my strategy, don't use it. I don't want anyone to lose money because of me.
have a great day!

APPLE major resistance ALL TIME HIGH and DIVIAPPL is heading to test the previous high. Be aware, and if you do not have this stock, let's wait for the breakthrough. It would be best if you also watch the UPTREND trendline. If we break it, we are going lower.
The date for the dividend payout is close.
Declared Record Payable Amount Type
January 27, 2021, February 8, 2021, $0.205 Regular Cash

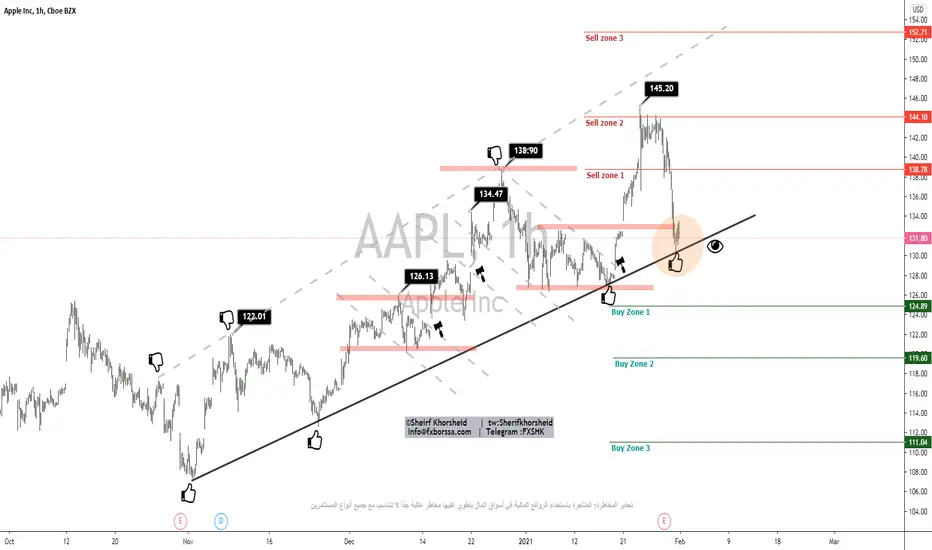
apple I share with you the most important price levels and areas of sale and purchase of Apple stock in my own way
As shown on the chart, the areas of sale and purchase are divided into first, second and third, where the third level is always the strongest, then the second night and then the first
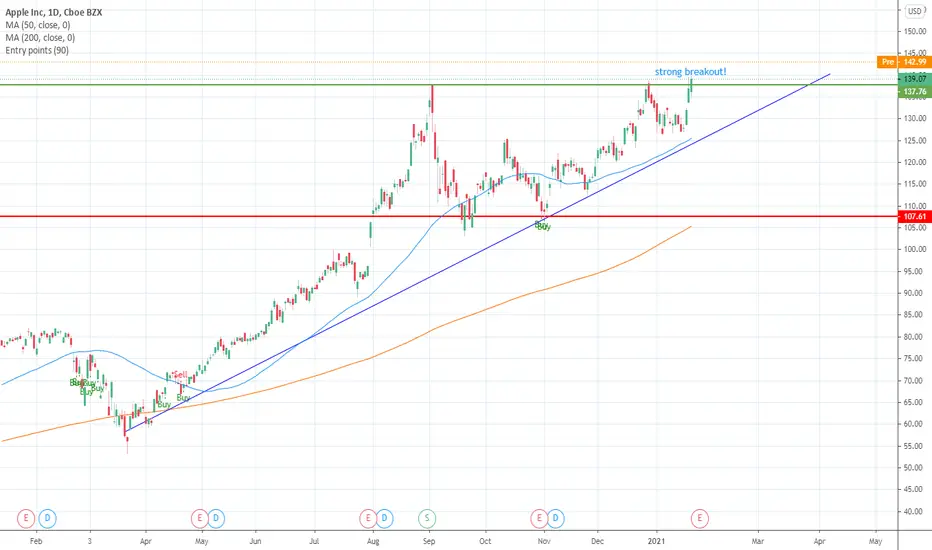
AAPL Strong Breakout!If you bought during the end of the day on Friday you would see the pre-market strong breakout to the upside for AAPL at the moment. Watching the end of the day today for a return to $137.7x or just a touch of that line but expect a continuation to the upside.
APPLE LongApple showing signs of a bullflag
this is the weekly chart so going long would be necessary
very bullish


Bearish on AAPLWeekly AAPL. Purple line is EMA(220W) i actually use it as EMA(55) on every time period but i dont wanted to publish this on a monthly graph so i multiplied it by 4. In the long run EMA(55M) is a pretty damn strong support and the december 2018 bottom was a simple bottom but right now we're seeing a double top formation and 2 bearish candlestick patterns in that red circle (shooting star and hanging man). So it would be a smart move to sell or short AAPL with a stop-loss buy order little above the All time high.


apple near resistance high is the sl the fall quick apple near resistance high is the sl the fall quick

Apple UpdateLooks like we are going to break ATH, possibly tomorrow, however will we get a retest back down on the breakout before a farther move upwards?
I personally would rather hold through the dip and add more if we do go for the retest, if we dont retest, enjoy watching everyone else run for price discovery on apple.

$AAPL Update! The EV rumor TRUE! Taking a look at $AAPL in the video breakdown after the EV announcement.

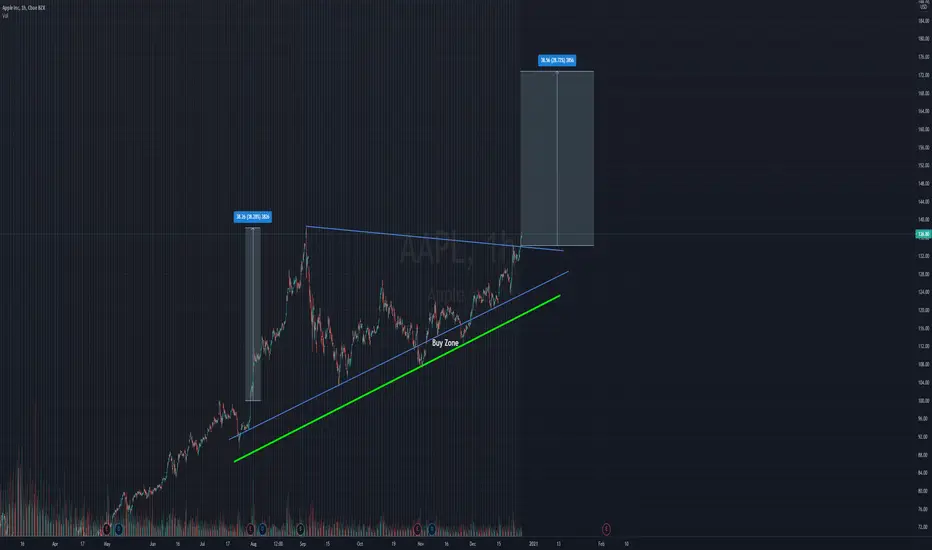
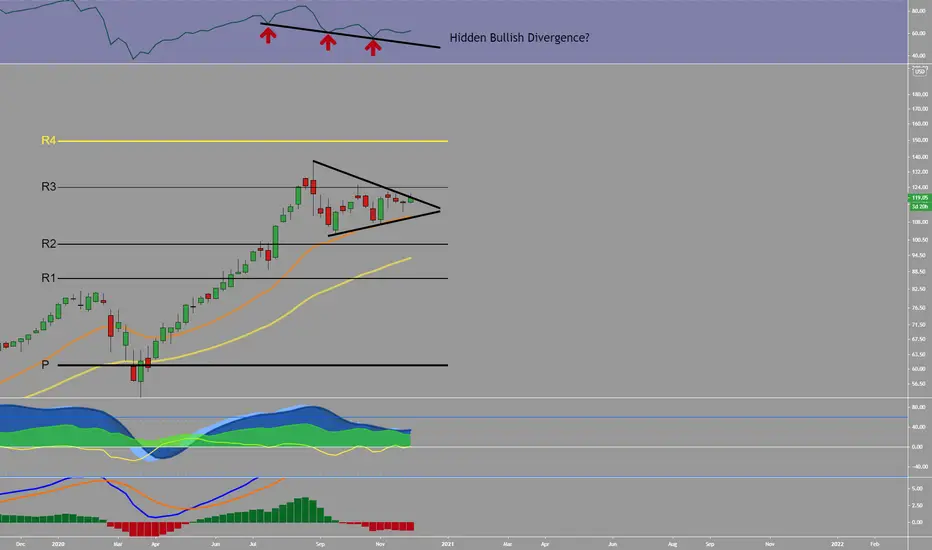
Apple Trend Continuation?Lately, tech stocks have seen lots of sideways price action over the last few weeks. The Apple chart looks to have formed a symmetrical triangle on top of the weekly 21EMA with hidden bullish divergence on the RSI. A daily close above the $121 resistance level could trigger a move towards the $125 weekly resistance. A weekly close above $125 may push prices back to the $137 high or the R4 yearly pivot.
$AAPL Post Breakout Breakdown and Analysis! 12/15-12/18$AAPL Video breakdown going into tomorrow! $SPY

$AAPL Recap and Analysis going into 12/15$AAPL had dampening news but still "held" up. Heres a video breakdown. Both sides of the coin. Tough to put a pin on it after today

$AAPL Upside Signs are Clear Going into 12/15With $PFE $BNTX Sending out the Vaccine news, That could clear some overhead on $AAPL going into 12/15
