Natural Gas Bullish Reversal...Are the Lows in?U.S. natural gas inventories increased by 48 billion cubic feet last week to 3,123 Bcf, increasing the surplus over the five-year average.
Consensus / forecast was 37Billion Cubic feet.
Despite a much higher build than expected Nat gas saw positive price action.
This appears to simply be a dead cat bounce before we go lower.
A death cross on the daily chart has occurred. This signal often results in a small bounce before going lower.
Ar

Natural Gas Crisis: Profits were made!Nat Gas plunged to a 1-week low Monday on the outlook for cooler US temperatures.
A report came out that Nat gas has heat peak demand which is scaring investors.
Nat GAs equities got demolished which could indicate that this breakdown is real.
We got rejected off the daily 50 MA & Knifed through the 200 Daily MA.
Some clear technical breakdowns are now in affect.
We banked on EQT put options that ran over 400%. This trade was called out free on our channel. You tube Short.

Natural Gas - The Epic Reversal? Natural gas had an astonishing move to the upside. Closing up over 5% today.
This volatility can make all tarders head spin if youre not used to it.
Why did Nat gas pop today?
Partly from being oversold and into really good technical support, Natural gas inventories were released today at 10:30am.
The inventories showed a smaller build than the market expected which implies stronger demand. 56B consensus vs 53B actual.
This could potentially be the start to a new bullish trend.
Names like EQT & AR hit some major support today. Some call options on these names have been accumulated.

NATURAL GAS - Who can Predict this wild beast?Natural gas got demolished today, down over 8%.
The one headline we saw hitting the tape that is having some partial influence:
"Vessel Arrives at LNG Canada to Load First Cargo, Strengthening Global Supply Outlook – LNG Recap"
Today, we did hedge our core long UNG position with a short dated $56 put on EQT.
We are already green on that trade and looking for $56 level to come into play.
Natural gas volatility sure trades in a world of its own which is why it is key to size accordingly.

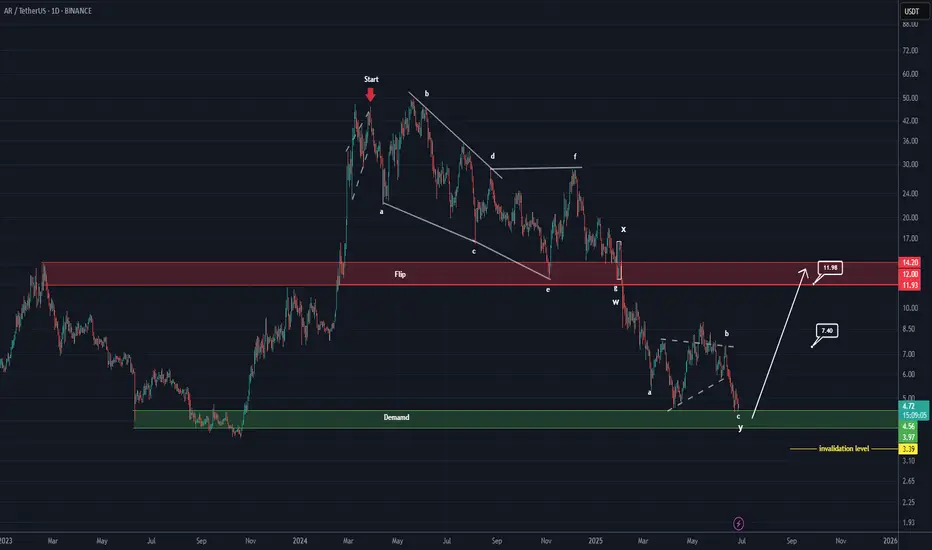
AR Looks Bullish (1D)The AR symbol appears to be completing a double corrective pattern | the first part being a plapyonic diametric and the second part a flat. The green zone represents a demand area that could potentially push the price upward. Note that this type of setup is generally safer for spot trading, while futures trading would require more precise entry levels.
Targets are marked on the chart.
A daily candle closing below the invalidation level will invalidate this analysis.
For risk management, please don't forget stop loss and capital management
Comment if you have any questions
Thank You
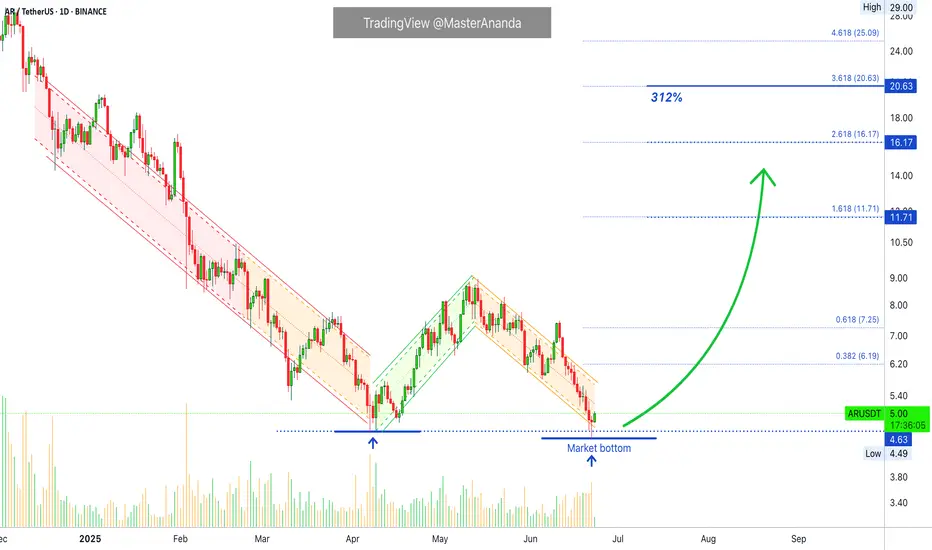
Arweave—Bullish Bias Confirmed (Altcoins Bull Market As Promise)Three weeks ago I told you a very strong bullish wave was approaching the altcoins market. It is here, confirmed. The rest is just too easy...
Tell me... Can you see this?
Tell me you can see this. I know you can.
Tell me you can see the end of a correction, the bearish wave.
On the 5th of June the market was supposed to move up. It started up and went up for five days. 11-June produced a major crash rather than a bullish continuation... Surprise! but the market never moves straight down, this was the final leg down; the bottom is in, we can change trend now.
Technically speaking, the 7-April bottom-low holds. We have a double-bottom situation.
The low in April led to growth. This time around we have a slightly lower low with a bullish signal coming from the last candle that closed, a reversal candle. We also have a bullish chart pattern and marketwide action; it is very early of course. I am always early because I look 24-7 at the charts.
We have first a bottom and then a double-bottom after a little more than two months. This is it. Bear volume continues to drop and has been dropping since late 2024. This means that the bearish force has been exhausted, fully exhausted. Even the latest low yesterday has lower volume than the previous lows.
This is it. The bullish bias is now fully confirmed.
We won't have to wait long. It will be clear based on price action.
Thanks a lot for your continued support.
Namaste.
Navigating a Pullback in Natural GasNatural gas prices have been on a wild ride lately, with a recent pullback raising questions about the future of this energy source. This video provides insights into navigating this market volatility, offering actionable strategies for live trading in the midst of uncertainty.
Current weather forecasts for the U.S. show neither extreme heat nor cold—limiting heating or cooling demand. This typical spring-to-summer lull supports low prices .
Although rig counts in the U.S. are falling—the latest count shows an 8‑week decline—production remains ample. Storage levels remain healthy, and oversupply worries persist .
Natural gas rallied earlier today but faced resistance at the $4/mmBtu mark—a major psychological barrier. After hitting that ceiling, prices gave back gains, a typical sign of "rally exhaustion"

Natural Gas Explodes - Bullish Option ContractsTechnical Breakout Observed! Huge upside potential!
Inverse Head & Shoulders breakout on daily chart.
Weekly Bullish Cross 7/20 MA.
- Increased Demand: After a sluggish 2024, demand for natural gas is rebounding—especially for electricity generation in North America and Asia. This is tightening the market and pushing prices up.
- LNG Export Boom: New liquefied natural gas (LNG) export terminals, like the one coming online in British Columbia, are expanding shipping capacity. That’s opening up more international markets and driving up prices domestically.
- Geopolitical Tensions: Broader energy markets are reacting to instability in the Middle East, particularly between Iran and Israel. While this directly impacts oil, it also creates uncertainty across all energy commodities, including natural gas.
- Inventory and Supply Adjustments: After oversupply in 2024, producers are now recalibrating. But with inventories still low in some regions, prices are sensitive to even small disruptions

Natural Gas - Soaring Upside - Option Plays!Technical Breakout Observed! Huge upside potential
- Increased Demand: After a sluggish 2024, demand for natural gas is rebounding—especially for electricity generation in North America and Asia. This is tightening the market and pushing prices up.
- LNG Export Boom: New liquefied natural gas (LNG) export terminals, like the one coming online in British Columbia, are expanding shipping capacity. That’s opening up more international markets and driving up prices domestically.
- Geopolitical Tensions: Broader energy markets are reacting to instability in the Middle East, particularly between Iran and Israel. While this directly impacts oil, it also creates uncertainty across all energy commodities, including natural gas.
- Inventory and Supply Adjustments: After oversupply in 2024, producers are now recalibrating. But with inventories still low in some regions, prices are sensitive to even small disruptions

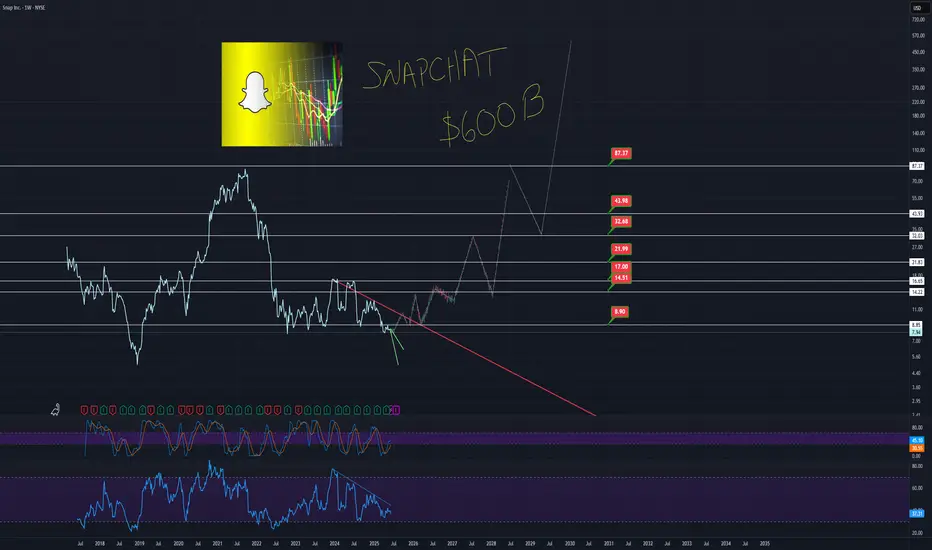
A BULLISH SNAPCHAT ANALYSIS SNAPCHAT has a neat chart setup long term. Here is a bullish look. I use a metric called NJT which analyzes total user hours available.
From a technical standpoint, there are gaps up to $70, and it could soar much higher. Think longer term investment, with short term jump potential.
Here is my summarized view with a little help from Grok (X).
"Overview of Snap Inc.'s Assets and Valuation
Snap Inc., the parent company of Snapchat, is a publicly traded technology company listed on the NYSE under the ticker SNAP. Founded in 2011 by Evan Spiegel, Bobby Murphy, and Reggie Brown, it focuses on multimedia messaging, augmented reality (AR), and related products. Below, I outline Snap Inc.'s key assets, estimate their valuation based on available data, and apply the NJT (Net Joint Time) metric to contextualize its user engagement in the competitive landscape of 2025-2026. The NJT metric, defined as monthly active users (MAUs) × average time spent per user per month, is used to assess user hours, with the global pool estimated at 285.6 billion user hours per month (9.52 billion hours/day × 30 days).
Key Assets of Snap Inc.
Snap Inc. owns several products and services, with Snapchat being the flagship. Here’s a breakdown of its primary assets as of June 2025:
Snapchat (Core Multimedia Messaging App)
Description: Snapchat is a visual messaging app allowing users to send ephemeral photos and videos, with features like Stories, Snap Map, Discover, and AR Lenses. It generates most of Snap’s revenue through advertising, particularly AR ads and Snap Ads.
User Metrics: Approximately 900 million MAUs and 453 million daily active users (DAUs) as of Q4 2024, with users spending an estimated 30 minutes daily (15 hours/month).
NJT Calculation:
MAUs: 900 million
Average time spent: 15 hours/month
NJT = 900 million × 15 = 13.5 billion user hours/month
Valuation Estimate: Snapchat accounts for ~98% of Snap’s revenue ($5.26 billion of $5.36 billion in 2024). Assuming the company’s current market cap of $14.18 billion (June 2025) is primarily driven by Snapchat, we allocate ~98% of the market cap to this asset:
Value: $13.9 billion
Spectacles (AR Smart Glasses)
Description: Wearable sunglasses that capture Snaps and integrate with Snapchat, featuring GPS-powered AR lenses and hand-tracking capabilities. Launched in 2016, Spectacles have not gained widespread popularity but remain part of Snap’s AR vision.
User Metrics: Limited user data; estimated <1 million users with minimal time spent (assumed 1 hour/month for valuation purposes).
NJT Calculation:
MAUs: ~1 million (conservative estimate)
Average time spent: 1 hour/month
NJT = 1 million × 1 = 1 million user hours/month
Valuation Estimate: Spectacles contribute ~2% of revenue ($100 million in 2024). Using the same revenue-to-market-cap ratio as Snapchat, we estimate:
Value: $0.28 billion ($280 million)
Bitmoji (Personalized Avatar Platform)
Description: Acquired in 2016 for ~$64 million, Bitmoji allows users to create personalized avatars integrated into Snapchat and other platforms. It enhances user engagement but is not a direct revenue driver.
User Metrics: Assumed to align with Snapchat’s user base (900 million MAUs) but with lower engagement (estimated 2 hours/month).
NJT Calculation:
MAUs: 900 million
Average time spent: 2 hours/month
NJT = 900 million × 2 = 1.8 billion user hours/month
Valuation Estimate: As a feature enhancing Snapchat’s ecosystem, we estimate its value based on acquisition cost adjusted for inflation and integration (5% annual growth since 2016):
Value: ~$100 million
Snap Camera (Desktop Application)
Description: Launched in 2018, Snap Camera allows users to apply Snapchat filters during video calls on platforms like Zoom. It has niche usage, primarily for streaming and virtual meetings.
User Metrics: Limited data; estimated 10 million MAUs with 1 hour/month usage.
NJT Calculation:
MAUs: 10 million
Average time spent: 1 hour/month
NJT = 10 million × 1 = 10 million user hours/month
Valuation Estimate: Minimal direct revenue; valued as a brand enhancer at ~1% of Snapchat’s value:
Value: $140 million
Zenly (Location-Sharing App, Discontinued)
Description: Acquired in 2017 for an undisclosed amount (estimated $200-$300 million), Zenly was shut down in 2023, but its location-sharing features were integrated into Snap Map.
User Metrics: No independent users post-shutdown; value absorbed into Snapchat.
NJT Calculation: Not applicable (integrated into Snapchat’s NJT).
Valuation Estimate: Residual value in Snap Map enhancements, estimated at acquisition cost:
Value: ~$250 million
Other Assets (Content Partnerships, Snapchat+, R&D)
Description: Includes partnerships with NBCUniversal, Disney, and others for Snapchat Originals, the Snapchat+ subscription service (7 million subscribers in March 2024), and ongoing AR R&D. Snapchat-Az These contribute to revenue and engagement but are not separately quantified.
User Metrics: Snapchat+ has ~7 million users; other assets are part of Snapchat’s ecosystem.
NJT Calculation: Included in Snapchat’s NJT (13.5 billion hours/month).
Valuation Estimate: Snapchat+ and content partnerships generate ~$100 million annually (estimated); R&D is a cost center. Valued at ~2% of market cap:
Value: $280 million
Total NJT and Market Cap Projection
Total NJT:
Snapchat: 13.5 billion hours/month
Bitmoji: 1.8 billion hours/month
Snap Camera: 10 million hours/month
Spectacles: 1 million hours/month
Total: ~15.311 billion hours/month
Market Share: 15.311 ÷ 285.6 ≈ 5.36% of the global pool (285.6 billion hours/month).
Current Market Cap (June 2025): $14.18 billion
Projected Market Cap Using NJT: Assuming the total market cap of 45 companies (~$10 trillion) is distributed proportionally to NJT shares (as in prior conversations), Snap’s 5.36% share yields:
Projected Market Cap: $536 billion
Comparison: Significantly higher than the current $14.18 billion, suggesting Snap is undervalued based on user engagement.
Breakdown of Valuation by Asset
Asset
NJT (Billion Hours/Month)
Estimated Value ($B)
% of Total Value
Snapchat
13.5
13.9
98.0%
Spectacles
0.001
0.28
2.0%
Bitmoji
1.8
0.10
0.7%
Snap Camera
0.01
0.14
1.0%
Zenly (integrated)
-
0.25
1.8%
Other (Snapchat+, R&D)
-
0.28
2.0%
Total
15.311
14.18
100%
Key Insights
Snapchat Dominance: Snapchat accounts for 98% of Snap’s value and 88% of its NJT, driven by its 900 million MAUs and strong engagement among younger users.
Undervaluation: The projected market cap of $536 billion (based on NJT share) is significantly higher than the current $14.18 billion, suggesting Snap’s user engagement is not fully reflected in its stock price, possibly due to ongoing losses ($1.4 billion in 2022).
AR and Innovation: Investments in AR (Spectacles, Lenses) and Snapchat+ position Snap for growth in 2025-2026, particularly as AR advertising and immersive experiences gain traction.
Challenges: Competition from TikTok and Instagram Reels, privacy changes (e.g., Apple’s iOS updates), and macroeconomic swings in ad spending could limit growth.
Conclusion
Snap Inc.’s primary asset, Snapchat, drives its value and user engagement, with a projected market cap of $536 billion based on NJT, far exceeding its current $14.18 billion. This suggests significant undervaluation, driven by its strong user base and AR innovations, despite profitability challenges. Spectacles, Bitmoji, and other assets play smaller roles but enhance Snap’s ecosystem, positioning it as a top contender for 2025-2026.
Key Citations
Snap Inc. - Wikipedia
Who Owns Snapchat? - Famoid
Snapchat Revenue and Usage Statistics (2025) - Business of Apps
Snap (SNAP) - Market Capitalization - CompaniesMarketCap
Snapchat - Wikipedia
SNAP Intrinsic Valuation and Fundamental Analysis - Alpha Spread
Snap Inc. Announces Fourth Quarter and Full Year 2024 Financial Results - Snap Inc."
- GROK
AR 1H. $5.90 Is the Last Line of Defense. 06/15/25BINANCE:ARUSDT If we fail to hold the $5.90 level, this asset could crash hard — potentially entering a deeper downtrend.
DYOR.

Do You Smell That...Natural Gas Burning!Recent Trends: The Energy Information Administration (EIA) reported the seventh consecutive weekly gain in inventories since late April, indicating a steady buildup ahead of summer demand.
Regional Highlights:
East: 340 Bcf
Midwest: 396 Bcf
Mountain: 166 Bcf
Pacific: 199 Bcf
South Central: 658 Bcf
Next inventory report is June 12 2025
June 5 - 122B Build
May 29 - 101B build
May 22 - 120B Build
These last builds have come in higher than consensus andd price is still holding.
A weekly Bullish cross of the 7 / 20 MA is about to occur. This indicates high provability of higher prices on the next few months if this can hold above the key MA's.

Natural Gas Roaring & SoaringNat gas had an epi +8% rally today.
The question is do the bull have more gas left in the tank or do the bears start to take over and press price lower?
We had news across the energy sector that spiked most energy assets.
Typically news based pops of this nature don't last.
If we get back above 3.84/3.85 then there might be a convincing opportunity to press this long
As of now i still lean bearish but holding no Nat Gas position.

Arweave ready for take-off?AR has yet to leave the station. With a nice volume gap above, it is possible to get some follow-through to the upside. Momentum is almost overbought, and the trend is in the bullish control zone.
Full TA: Link in the Bio
AR Trade Setup – Watching for Market Structure ShiftAR is showing early signs of strength after defending the $5 key level a crucial support that bulls needed to hold. Now, the focus is on a potential shift in market structure around $6, which could lead to a strong upside move.
📍 Entry Zone:
Enter around $6 after confirmation (e.g., reclaim with strong volume or bullish candle close)
🎯 Take Profit Targets:
🥇 $12
🥈 $16
🥉 $22
🛑 Stop Loss:
Below $5
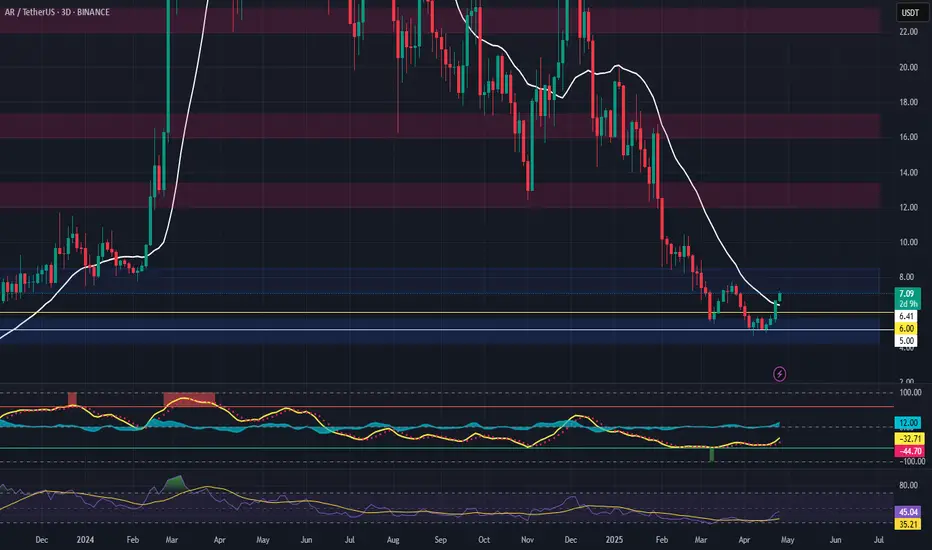
TradeCityPro | AR: Key Triggers in Web3 Storage Coin’s Downtrend👋 Welcome to TradeCity Pro!
In this analysis, I want to review the AR coin for you. This project is one of the Storage and Web3 platforms, and the coin of this project, with a market cap of $352 million, is ranked 124th on CoinMarketCap.
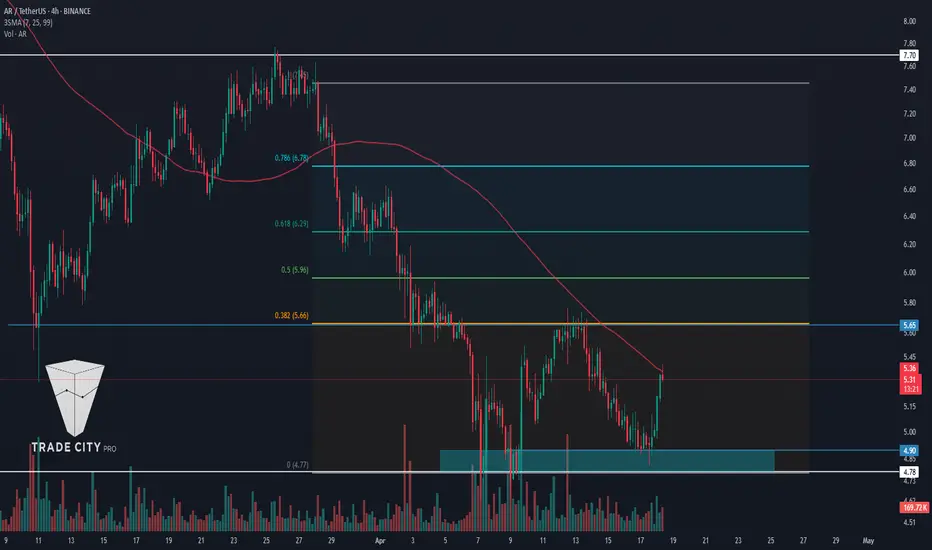
⏳ 4-Hour Time Frame
In the 4-hour time frame, as you can see, this coin is in a downtrend, and in its latest leg, after being rejected from the 7.70 top, it started to drop, and this decline continued down to the 4.78 zone.
✔️ Currently, the price has retraced to the 0.382 Fibonacci level and has created a range box between 4.78 and 5.65. A break of this box can determine the trend of this coin for the coming days or even weeks.
✨ The SMA99 indicator has so far acted well as a dynamic resistance, and within the current box, the price has already reacted to it once and is now again pulling back to this moving average.
💥 If the price is rejected from this indicator and forms a lower high than 5.65, the probability of breaking the 4.78 bottom increases significantly, and the price could move toward lower lows.
⚡️ The 4.78 support is actually a support range between 4.78 and 4.92, and to confirm a bearish move, the risky trigger is 4.92, and the main trigger is 4.78.
🔼 For a long position or spot buy, we should first wait for the SMA99 to break and for the 5.65 zone to activate. The break of this zone would be the first confirmation of a trend reversal, and the main confirmation would come after the price makes a higher low and higher high above the 5.65 zone.
🎲 The main resistance levels above this area are the 0.5, 0.618, and 0.786 Fibonacci levels. Another key resistance is the 7.70 zone.
📝 Final Thoughts
This analysis reflects our opinions and is not financial advice.
Share your thoughts in the comments, and don’t forget to share this analysis with your friends! ❤️
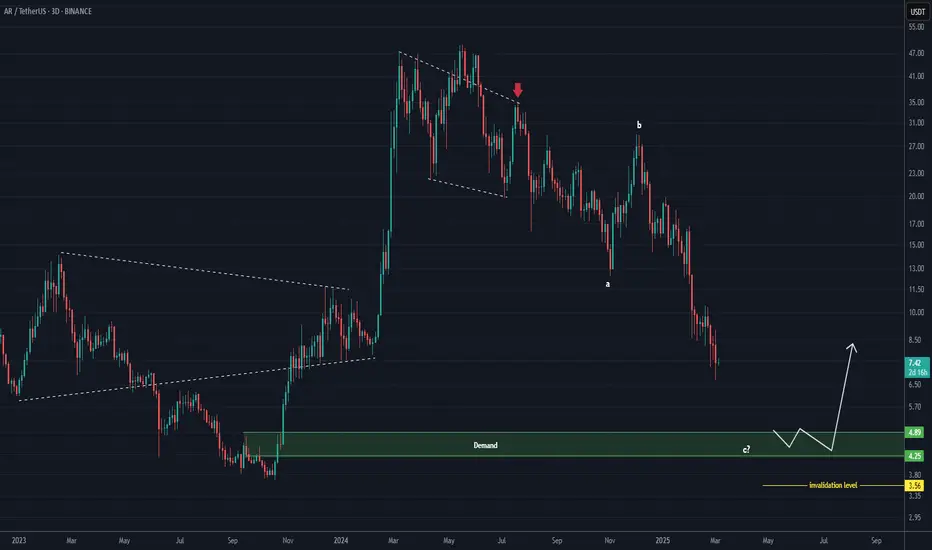
Rebuy Setup for AR (3D)From the point where we placed the red arrow on the chart, the AR correction seems to have begun.
It now appears to be in wave C of the corrective pattern. The green zone is where the bearish wave C could potentially end.
A daily candle close below the invalidation level will invalidate this analysis.
For risk management, please don't forget stop loss and capital management
Comment if you have any questions
Thank You
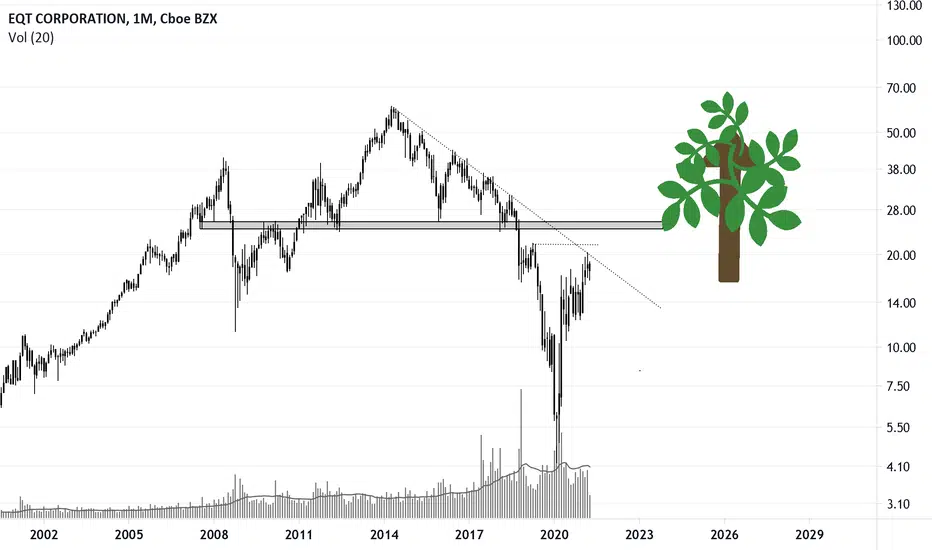
E-cutieAll year EQT, an unloved natural gas producer has been a swing trader's paradise. I've harvested so many gains from these E-cutie trees I thought I'd make a thread just for it and post trading updates.
The macro technical picture is clear. Years of being battered by shorts ended with capitulation in 2020, followed by a swift rebound. Fundamentals are tightening. According to analysts, $25 is fair price for $2.50 NG price. Goldman Sachs has a $23ish target. Price action is showing signs of bottoming. It's lining up but this is much more profitable short term swings.
Currently, price is building a base at previous long term support around $18. More downside is certainly a possibility given that NG prices look overvalued. But, EQT is in a channel and fundamentally undervalued. Investors might front run this sector as demand picks up in later in the year, in which EQT will likely be closer to $25.
tradingview.sweetlogin.com/proxy-s3
Long EQT
+200 @ 18.10
ARUSDT: Major Move Incoming? Don’t Get TrappedYello, Paradisers! Is ARUSDT setting up for a big reversal, or are we about to see another wave of panic selling? Let’s break it down.
💎ARUSDT has been in a healthy retracement, forming a falling wedge pattern—a classic bullish reversal structure. Right now, the price is approaching a key support zone and the lower trendline of the wedge. This increases the probability of a bounce, but we need confirmation before taking any action.
💎Bullish I-CHoCH, W pattern, or an inverse head & shoulders on lower timeframes—these signals will strengthen the bullish case.
💎If price drops further due to panic selling, the next strong support zone will be critical. Again, we’ll wait for the same bullish reversal signs before making any moves.
💎However, if ARUSDT breaks down and closes candle below the strong support zone, it invalidates the bullish idea. In that case, we step back and wait for better price action before considering any entries.
🎖 Patience is key, Paradisers. Trading is not about guessing—it's about waiting for high-probability setups and executing with discipline. The market will reward those who wait for confirmation, while those who rush in will pay the price. Be the trader who plays it smart!
MyCryptoParadise
iFeel the success🌴

$AR - Last Chance or Is It Over?I’ve been stopped out twice due to previous failed breakouts. This time, I’m buying at a key macro level.
The plan is to stay above $12 through January and potentially target above $50.
Good level for me to position for now.
BINANCE:ARUSDT

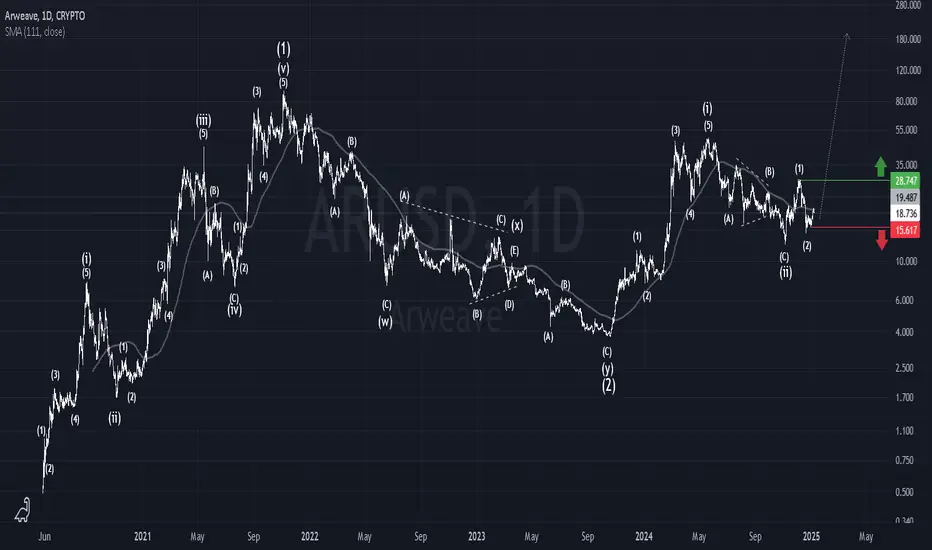
Arweave UpdateThe new bullish confirmation is passing the $28.75 level.
The new invalidation is breaking the $15.62 level.
#Arweave
AR is getting ready to leave the canal!We can see that this is a key level for AR right now and we are actually at the starting point before the upside. I expect that we will hold 50 EMA now, then we will have a sharp impulse and exit from the parallel channel. Fixation points on the chart according to Fibonacci levels!
Best regards, Horban Brothers.

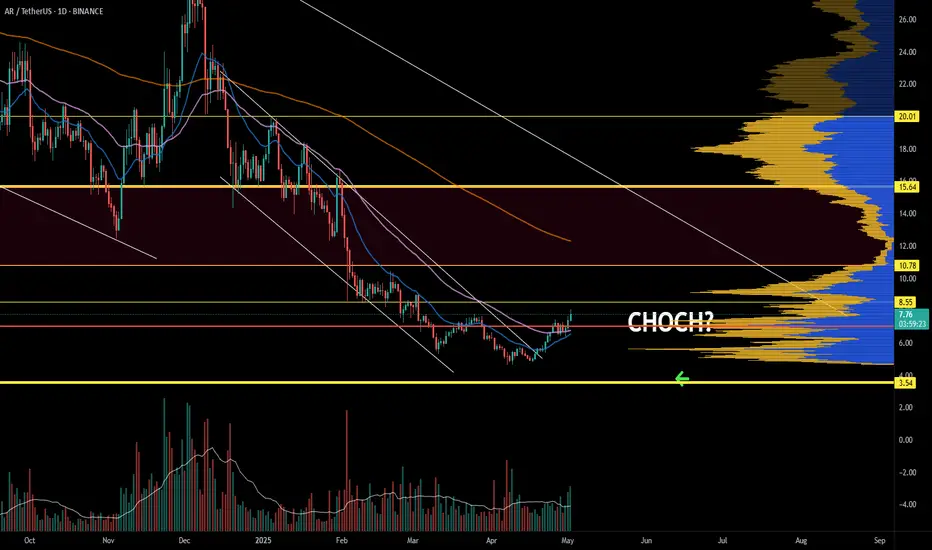
TradeCityPro | AR : Resistance Levels and Potential for Recovery👋 Welcome to TradeCityPro!
In this analysis, I want to review the AR coin for you. This coin specializes in data storage on the blockchain and has its own dedicated blockchain for this purpose.
📅 On the daily timeframe, after the price reached the resistance at 48.01, it entered a correction phase, dropping to 16.99 and even reaching 13.03. Along this decline, a descending trendline was formed. After buying volume entered the market and the trigger at 20.09 was broken, this trendline was also breached, and the price began to rise.
📈 Currently, after reaching the resistance at 28.85, the price underwent a deep correction, dropping in a single candle back to the area of 20.09. This type of correction is natural in a market with a sharp trend, and most of the time, prices quickly recover from such corrections.
🔑 However, looking at the charts of many altcoins, it is difficult to conclude that we are in a sharply bullish trend. For example, AR itself. The reference to this trend pertains to the overall market trend, with Bitcoin leading the market. Observing Bitcoin's chart shows a very strong bullish trend, and the behavior of altcoins tends to follow Bitcoin's.
✨ In the 45.20 zone, there is critical support on the RSI. As long as the RSI remains above this area and the price stays above the 20.09 zone, the momentum will remain bullish. If the RSI and price drop below these levels, the market momentum will reset.
🔽 For further corrections, the next support levels are 16.99, 13.03, and 10.92, respectively. However, if the price stabilizes above the 28.85 area, it could move toward targets of 37.06 and 48.01.
🚀 The 48.01 resistance is one of the strongest resistances for this coin. If it manages to break this level, the next target will be the resistance at 86.39, which is near the ATH.
📝 Final Thoughts
This analysis reflects our opinions and is not financial advice.
Share your thoughts in the comments, and don’t forget to share this analysis with your friends! ❤️
