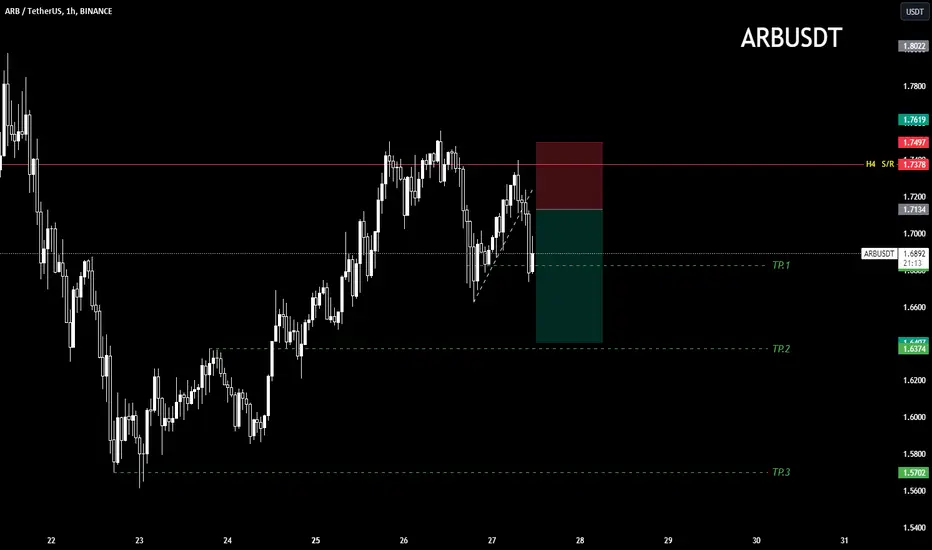
ARB: sell by trend📊Analysis by AhmadArz:
🔍Entry: 1.713
🛑Stop Loss: 1.749
🎯Take Profit: 1.682-1.640-1.570
🔗"Uncover new opportunities in the world of cryptocurrencies with AhmadArz.
💡Join us on TradingView and expand your investment knowledge with our five years of experience in financial markets."
🚀Please boost and💬 comment to share your thoughts with us!
ARBUSD
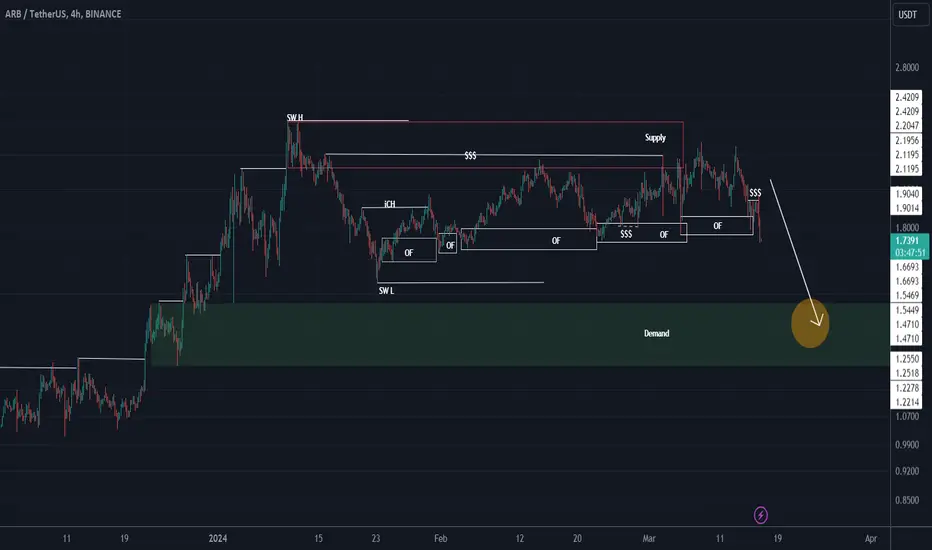
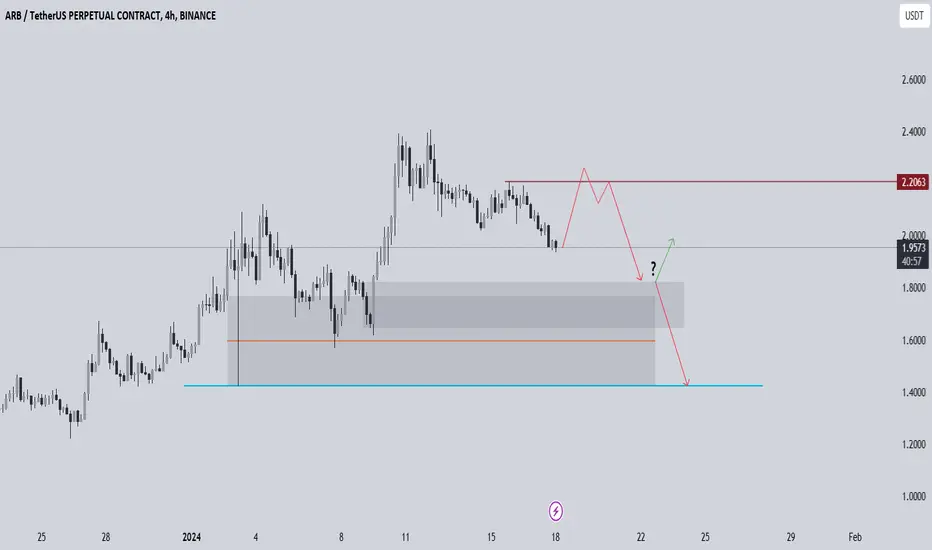
ARB UPDATE (4H)This is an update to the analysis you see in the "Related Ideas" section
ARB's reaction to the support zone was not good and before the recent dump a liquidity pool has accumulated. The symptoms are those that indicate more drops
For risk management, please don't forget stop loss and capital management
Comment if you have any questions
Thank You
Here' s the buying zones for #arbitrum #arbWith the major correction of CRYPTOCAP:BTC #bitcoin i posted in my previous ideas, those who took profits are happy now. Now , the orange box zone is " good buy " zone of #ARB token .
NOT FINANCIAL ADVICE.
Here' s a buying setup for #ARB #ArbitrumIf markets continue to dump ( I warned you when #BTC was at 72K) , i may buy precious LSE:ARB tokens from this zone. NOT FINANCIAL ADVICE.
ARB UPDATE (6H)ARB shows signs on the chart that buy orders are in the green range (Demand) and the buyers' stronghold is in this range.
The L SH (long shadow) range is a suitable range in which to look for a buy/long position.
If the price reaches this range, we will look for buy/long positions
The targets are clear on the chart.
Closing a daily candle below the invalidation level will violate the analysis
For risk management, please don't forget stop loss and capital management
When we reach the first target, save some profit and then change the stop to entry
Comment if you have any questions
Thank You

ARB / ARBUSDTGood Luck >>
• Warning •
Any deal I share does not mean that I am forcing you to enter into it, you enter in with your full risk, because I'll not gain any profits with you in the end.
The risk management of the position must comply with the stop loss.
(I am not sharing financial or investment advice, you should do your own research for your money.)
It's going to be a cool movie for L2 Arbitrum🏧 LSE:ARB #Arbitrum #Crypto #L2 (ARB/USDT)
🟢 Entry price: $2.02
🟢 Take Profit 1: $4.04 (50%)
🟢 Take Profit 2: $9.79 (20%)
🟢 Take Profit 3: $11.89 (10%)
🟢 Take Profit 4: $14.89 (10%)
🟢 Take Profit 5: $17.89 (10%)
Arbitrum, as a leading layer 2 scaling solution for Ethereum, has seen significant developments and attracted notable investors leading into 2024. Here's an overview of the highlights, funding, and potential collaborations expected for Arbitrum in 2024:
Highlights and Developments
• Arbitrum has shown impressive growth in terms of Total Value Locked (TVL) and project development on its platform. The platform has been recognized for its advancements in scaling technology, making Ethereum more inclusive and sustainable.
• Notably, in 2024, there's an anticipation of a potential collaboration among Arbitrum, Cardano, and Mina Protocol. This partnership is expected to bring forth projects that leverage the strengths of each platform, particularly in areas where Ethereum faces challenges. This collaborative effort is expected to focus on enhancing scalability through Zero Knowledge (ZK) cryptography, which is crucial for supporting mass multiplayer online games (MMOs) and other large-scale decentralized applications.
Funding and Investors
Arbitrum has successfully raised significant funding across several rounds, showcasing the confidence investors have in its technology and vision for the future of Ethereum scaling:
• Total Raised : Arbitrum has accumulated $143.7 million across various funding rounds.
• Series B Round : The most significant raise was during its Series B round in August 2021, where it raised $120 million.
• Notable Investors : Arbitrum is backed by several high-profile investors, including Pantera Capital, Polychain Capital, Redpoint, Ribbit Capital, and notable figures like Mark Cuban. These investors support Arbitrum's mission to enhance the Ethereum ecosystem's scalability and efficiency.
2024 Expectations
• The potential collaboration with Cardano and Mina Protocol indicates a strategic move towards interoperability and leveraging unique technological strengths, such as ZK proofs, to overcome current blockchain limitations.
• As Arbitrum continues to develop and onboard more projects, it's expected that its ecosystem will expand, further solidifying its position as a crucial component of Ethereum's layer 2 landscape.
In conclusion, 2024 looks promising for Arbitrum with expected technological collaborations, continued investor support, and ongoing developments aimed at enhancing the scalability and efficiency of Ethereum. These factors combined signal a strong year ahead for Arbitrum, as it continues to contribute to the broader adoption and utility of blockchain technology.

ARB buy setupNote that this is not a setup for sell/short, but a setup for buy/long
ARB structure is bullish. If it reaches the Demand range, we will look for buy/long positions in this range.
Fixing 1 daily candle below the invalidation level will cause the analysis to be violated.
For risk management, please don't forget stop loss and capital management
When we reach the first target, save some profit and then change the stop to entry
Comment if you have any questions
Thank You

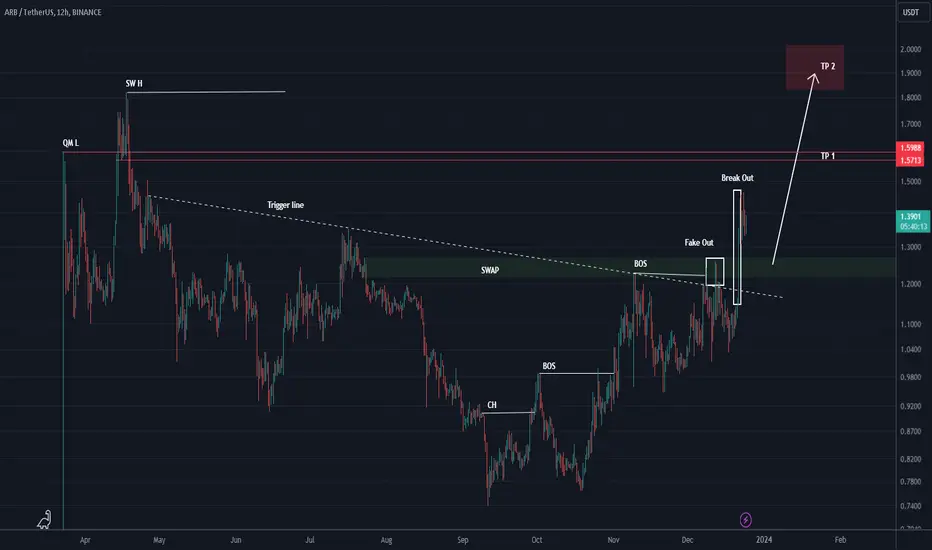
#ARB/USDT#ARB
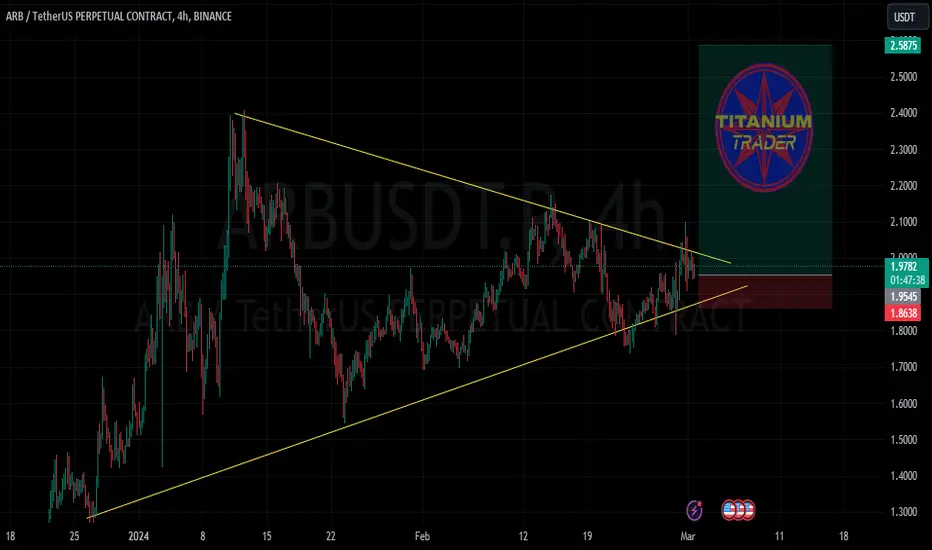
The price is moving in a descending triangle on a 4-hour frame, and the channel has been broken upward, and it is expected to continue rising after testing the trend.
We have a higher stability moving average of 100
We have an RSI trend that is about to break higher
Entry price is 1.81
The first goal is 1.91
The second goal is 2.027
Third goal 2.158

ARBUSDT Bullish SetupBYBIT:ARBUSDT.P appears to have a confirmed break out of the trend line and currently taking support with the successful retest of the fibs we can consider longing it to the black line which is the resistance and if the break out of the black lion occurs and consolidation above the black line happens or a Re-test I will look for further longs for swing trades.
ARB LOOKS BULLISH IN 4H TIME FRAMEARB/USDT can make bullish breakout in 4 hours timeframe and makes bullish pennant.
must use SL as given here and some targets as shown here in chart.
Arbitrum | ARB ( Whales buy the dip )The price of Arbitrum is $1.48 today with a 24hour trading volume of 818 million dollar. This represents a 12.50% price increase in the last 24 hours with a circulating supply of 1.3 Billion ARB.
Whales buy the dip! but why ? after Arbitrum started distributing governance tokens to eligible decentralized autonomous organizations, some whales have been adding to their stacks.
Earlier today, one address holding 1.95 million Arbitrum governance tokens, worth roughly $2.7 million, received nearly 200,000 dollar in ARB from Binance at the time, the price of one token was 1.38
Not long before, a second address holding 1.78 million governance tokens ,worth 2.5 million dollar, spent 80 ETH on buying roughly 146,000 worth of ARB at 1.34 dollar per token.
Arbitrum, the leading Layer 2 network on Ethereum, began distributing governance tokens to DAOs earlier this week. Its core team previously designated 1.13% of the overall 10 billion governance token supply, equivalent to 113 million ARB with a current value exceeding 145million, to be distributed among qualifying projects in the Arbitrum ecosystem. he distribution of governance tokens to DAOs is intended to help bootstrap activity on the Arbitrum network. The tokens may be allocated to projects' treasuries or used for other objectives, as determined by the respective DAOs.
Projects receiving governance tokens include Uniswap, Sushi, Aave, GMX, Hop Protocol, Radiant Capital, Balancer, Synapse, MakerDAO, Curve, Layer Zero and 1inch.
next targets are 1.5 and 1.5$

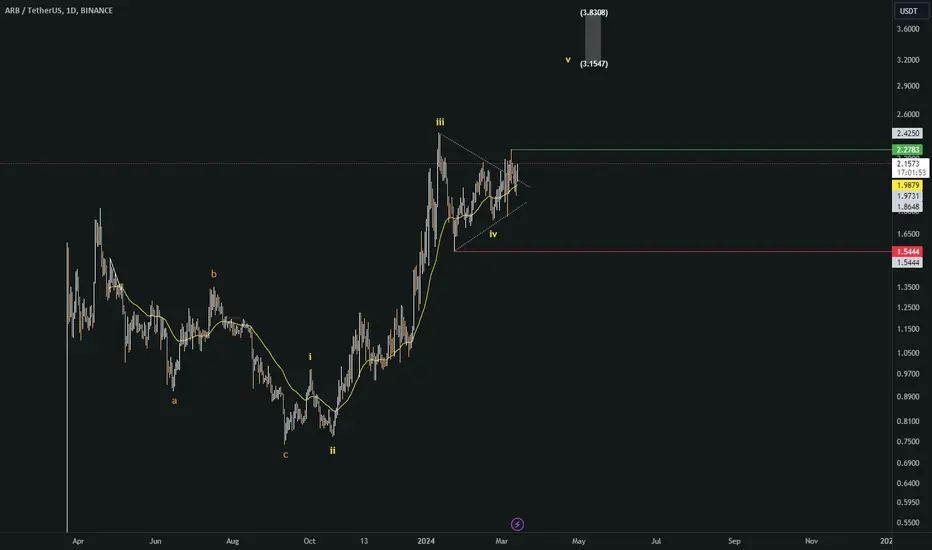
ARB ANALYSIS (4H)On the chart, from where we entered "START", we seem to see a correction.
This correction seems to be a diametric.
There was a suitable place for the termination of the F wave on the chart, which we marked with red color.
If the price reaches this range, you can enter a sell/short position.
For risk management, please don't forget stop loss and capital management
When we reach the first target, save some profit and then change the stop to entry
Comment if you have any questions
Thank You

#ARB #Update #ARBUSDT #Short #ShortSetup #Eddy#ARB #Update #ARBUSDT #Short #ShortSetup #Eddy
Its my "ARB/USDT" short setup <3
Enjoy Guys ;-)
Related Arbitrum Analysis : (( ARB/USDT )) : Check Link :

ARBUSDTBINANCE:ARBUSDT Short idea
for ARB I'm looking for this setup.
⛔"Daily crypto market analyses I provide are personal opinions & not financial advice. Trading carries risks, so do your own research & seek advisor's help. #DYOR
Don't forget to 🚀 and comment
scalping (ARB)📊Analysis by AhmadArz:
scalp trading.
🔗"Uncover new opportunities in the world of cryptocurrencies with AhmadArz.
💡Join us on TradingView and expand your investment knowledge with our five years of experience in financial markets."
🚀Please boost and💬 comment to share your thoughts with us!

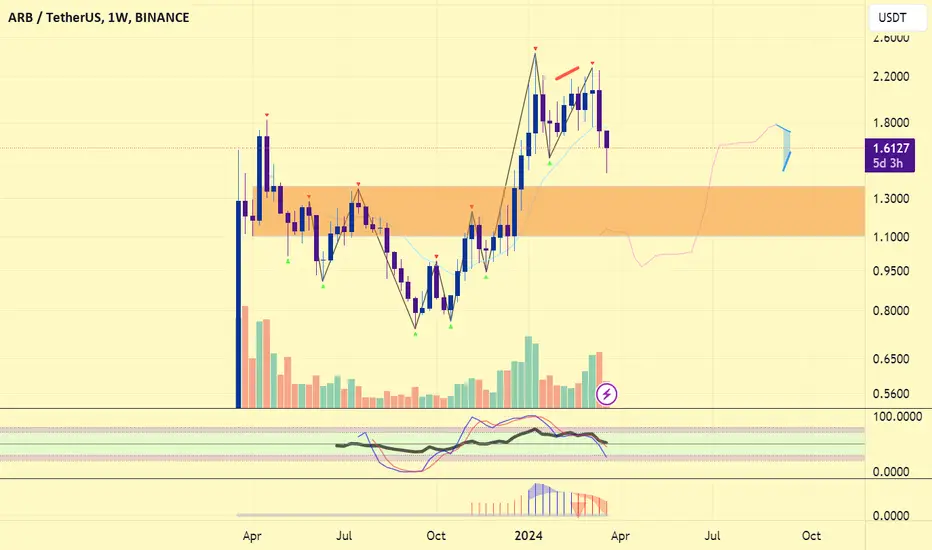
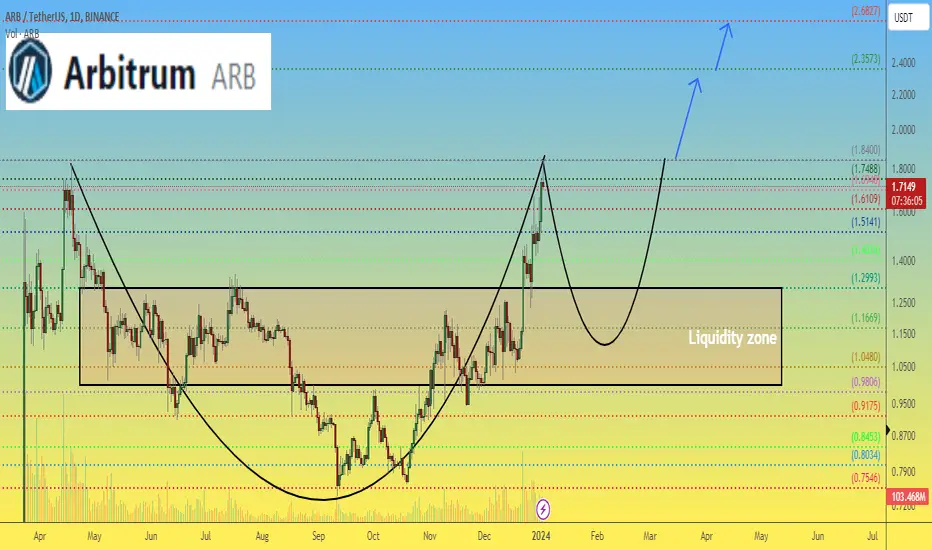
Arbitrum price maybe in the process of forming "Cup with handle"A lot of ARB tokens were given away for free, there are a lot of holders large and small.
Sooner or later, "the big wallets" will organize a coin pumping, but right now, we wouldn't risk buying ARB in our crypto portfolio.
The trading range of $1-1.30 is another matter: there was a certain "struggle" between buyers and sellers, a certain redistribution of capital took place there, and we would try to buy ARBUSDT for 1-3% of the investment deposit.
_____________________
Did you like our analysis? Leave a comment, like, and follow to get more
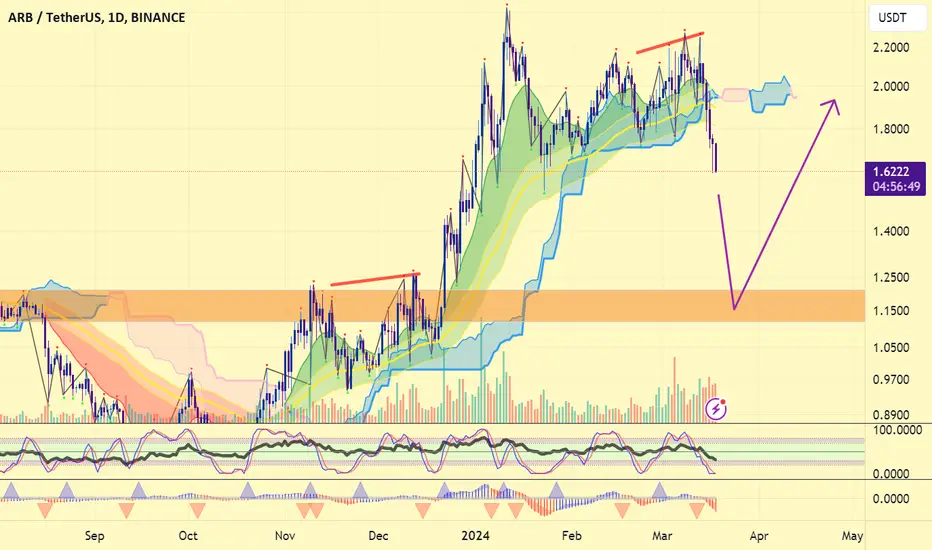
$ARB #Arbitrum preparing for the skies...As i said in my previous ideas, #ARB is heavily undervalued and I say this again. AMEX:ARB must reclaim new highs and ATH. This L2 season will be insane. Op has started the race, now it' s the time for ARB and MATIC / Polygon.
In short time frame, the cup has formed and now the price is forming the handle. If declination does not come from the last week' s top, $Arbitrum price will likely visit the previous All Time High.
NOT FINANCIAL ADVICE.

ARB Channel Trade +%20+%40I believe market will go to a small correction soon, so it is quite risky to open long positions.
However, I will take the risk and try this tactic.
This is just a trial not a financial advice.
ARB ShortARB Shifted to the downside by creating CHoCH and BOS with good inducement to trap shorters before mitigating the unmitigated bearish OB above the inducement.............
Wait patiently for the entry to mitigated and a take a short from there......
Follow for more market update and trade setup

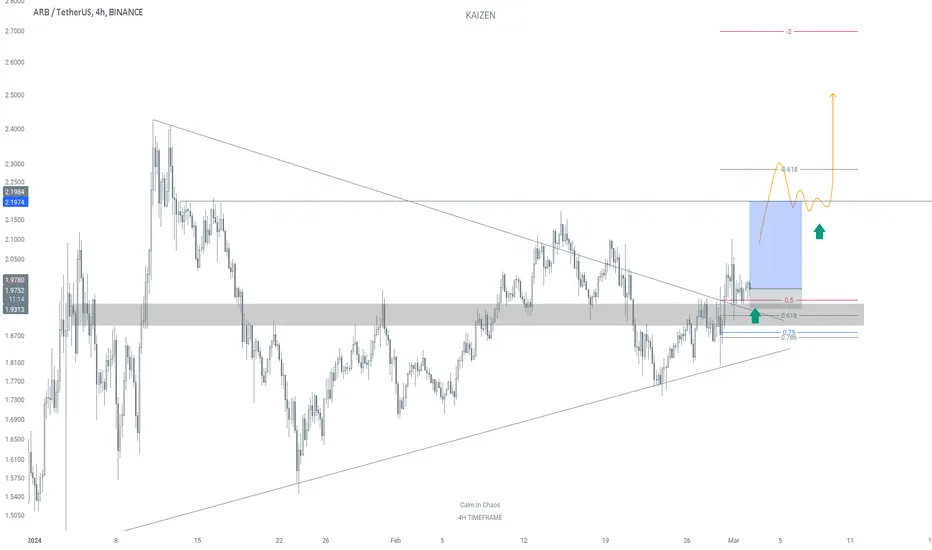
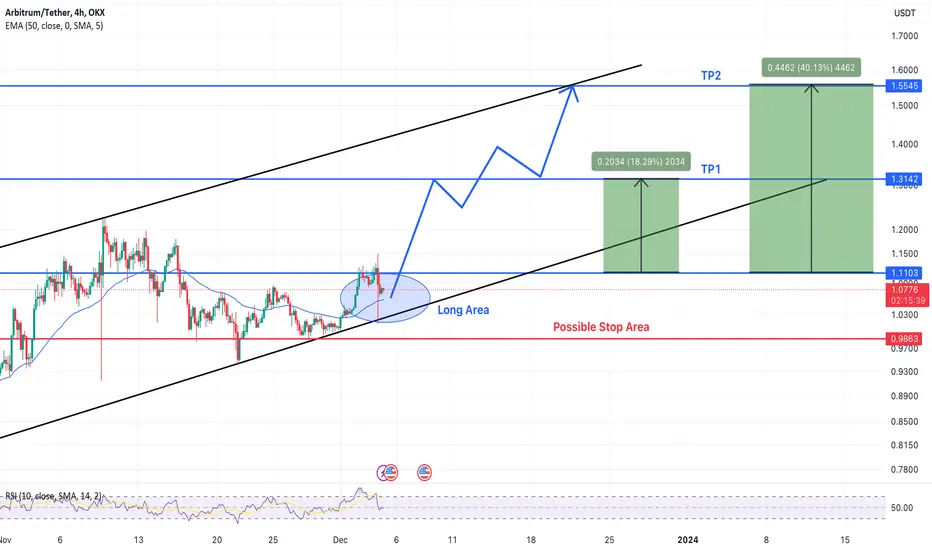
ARB looks bullishOn our chart we have ascending CH and BOS. Bullish momentum is good.
We have also had a good Break Out on the chart. A supportive swap zone is formed which is our Buy Zone.
If it pulls back to the green range, you can enter a buy/long position. TPs are clear on the picture.
Fixing a daily candle below the green range will violate the analysis
For risk management, please don't forget stop loss and capital management
When we reach the first target, save some profit and then change the stop to entry
Comment if you have any questions
Thank You
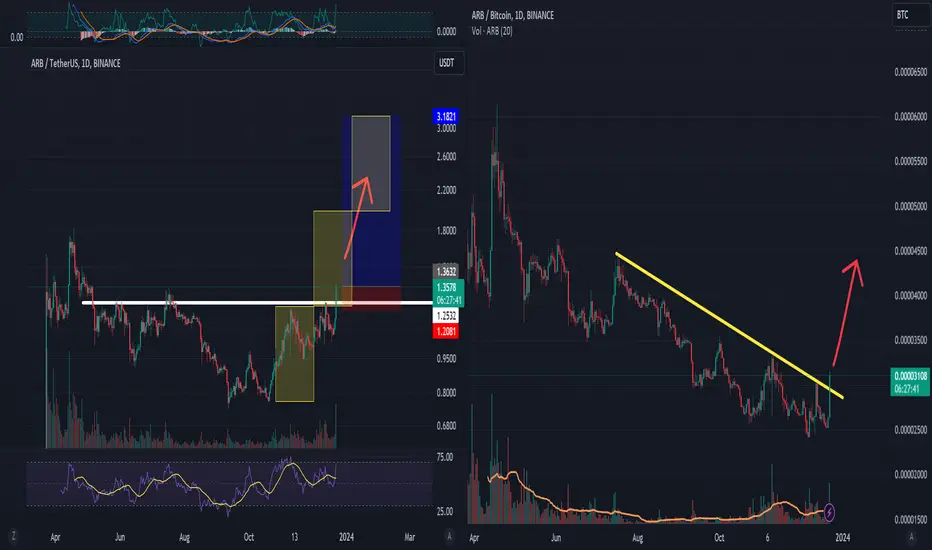
ARB 133% potential ARB has a great setup with 133% upside potential here.
+Inverse head and shoulders
+down trend break on ARBBTC pair
###This is NOT a financial advice.But for educational purposes only, trading crypto is highly risky, you're responsible for your own action.
Gaine in renge (ARB)❤️❤️Thanks for boosting 🚀 and supporting us!
📈Yes we are in big renge so sell in high & buy in low renge.
📊 (Buy) : 1.0438
🔴 Stop Loss : 1.0095
🎯 Take Profit : 1.069 - 1.111 - 1.146
🔗 For more communication with us, In the footnote and send a message in TradingView.
👨🎓 Experience and Education: Our trading team has five years of experience in financial markets, especially cryptocurrencies.
