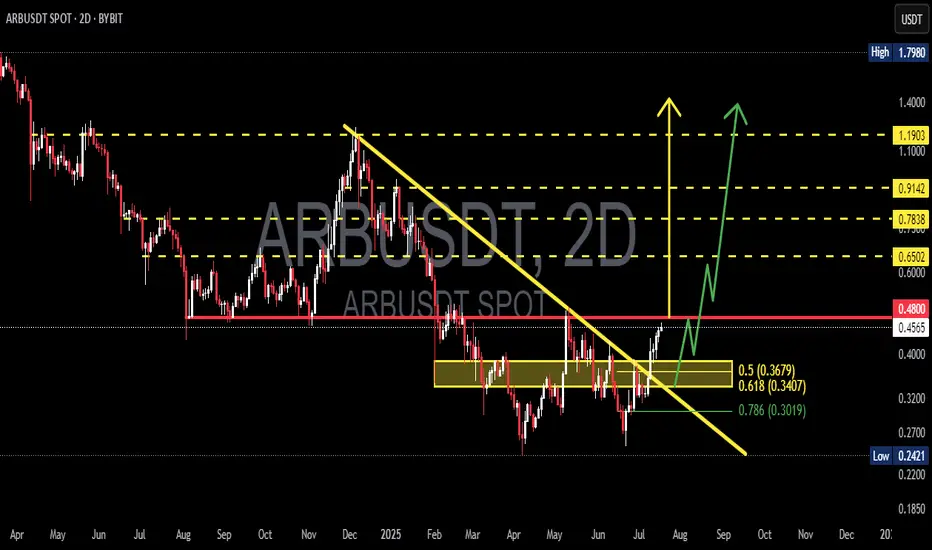
ARBUSDT Ready to Fly? Strong BreakoutARBUSDT has just completed one of its most critical technical phases in recent months — a clean breakout from a medium-term descending trendline that has been suppressing price since December 2024.
📌 Pattern and Price Structure Analysis:
🔹 Descending Trendline Breakout:
After months of downward pressure, ARBUSDT has finally broken above a long-standing trendline. This isn't just another breakout — it's a strong structural signal indicating a potential trend reversal.
🔹 Well-Defined Accumulation Zone:
A solid consolidation base formed between $0.30 - $0.37, highlighted in yellow, serving as a key demand zone. This area aligns perfectly with the Fibonacci retracement levels:
0.5 = $0.3679
0.618 = $0.3407
0.786 = $0.3019
This confluence of support suggests smart money accumulation before the breakout.
📈 Bullish Scenario (High Probability):
If price holds above the recent breakout zone ($0.45–$0.48), the bullish structure remains intact and a multi-level rally may unfold.
🎯 Bullish Targets:
1. First Target: $0.6502 — immediate horizontal resistance.
2. Key Target: $0.7838 — major resistance and previous rejection level.
3. Psychological Level: $0.9142 — pre-breakdown price zone.
4. Maximum Extension: $1.1903 — a potential target if a macro bullish wave develops.
📌 Look for higher lows (HL) and higher highs (HH) structure to confirm sustained bullish momentum.
📉 Bearish Scenario (If Breakout Fails):
A drop back below $0.45 would weaken the bullish outlook.
If the price slips below $0.3679 and loses the 0.618 Fib level at $0.3407, expect a deeper retracement toward:
$0.3019 (0.786 Fib level)
$0.2421 (previous macro low and key support)
🚨 Failure to hold the breakout level could trigger a bull trap, especially if accompanied by declining volume.
🧠 Additional Technical Notes:
Volume increased during the breakout, adding reliability to the move.
Potential formation of an inverse head and shoulders pattern within the base (still early but worth watching).
Momentum indicators like RSI and MACD (not shown) are likely to support the bullish breakout — watch for divergence confirmation.
🧭 Conclusion:
ARBUSDT stands at a critical juncture. The breakout from a long-standing downtrend coupled with a strong accumulation structure gives bulls a tactical edge. However, it must hold above key levels to sustain the momentum.
Smart traders may consider strategic entries on minor retracements while keeping risk in check below the golden pocket zone.
#ARBUSDT #CryptoBreakout #AltcoinReversal #TechnicalAnalysis
#BullishSetup #TrendlineBreakout #FibonacciLevels #CryptoTrading
#Altseason #CryptoSignals
Arbusdtidea
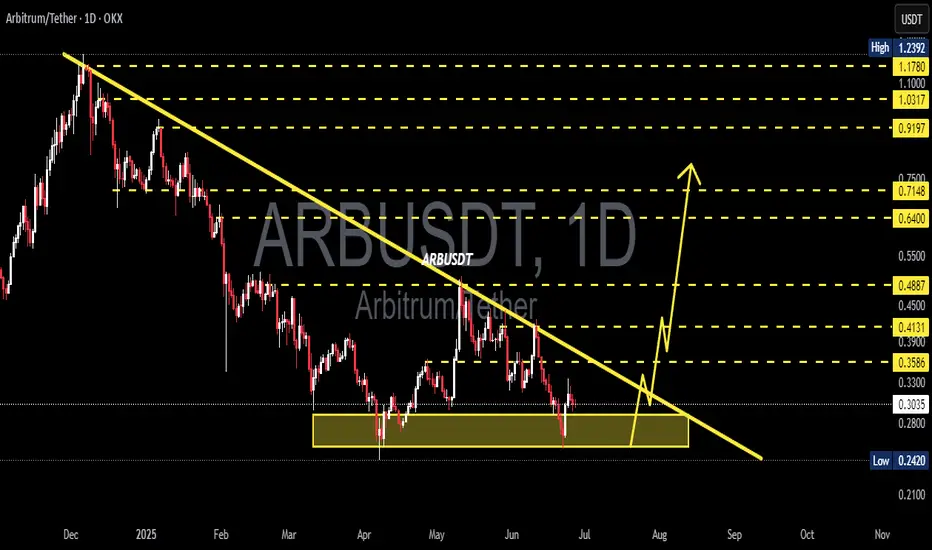
ARB/USDT Breaks Downtrend – Major Bullish Reversal in Play!📊 Technical Analysis (Daily Timeframe)
ARB has officially broken out of a long-standing descending trendline that has defined its downtrend since late 2024. This breakout, supported by strong demand at key Fibonacci levels, could be the start of a major bullish reversal.
🧠 Key Chart Patterns & Structure:
🔸 Descending Triangle Breakout
Originally viewed as bearish, this triangle has instead resolved to the upside — a rare but powerful bullish reversal signal when paired with growing volume and price compression near the breakout.
🔸 Fib Retracement Bounce
Price rebounded precisely from the 0.618 (0.3210) and 0.786 (0.2910) levels, confirming these zones as strong accumulation and liquidity areas.
🔸 Break & Retest Zone at 0.3422 – 0.3210
This golden zone will be key for confirming the breakout. A successful retest here sets the stage for the next leg up.
🔸 Bullish Price Structure Formation
A potential higher low and higher high formation is beginning, which would fully confirm the shift from bearish to bullish market structure.
🟢 Bullish Scenario (High Probability)
If the breakout is validated with a successful retest of the zone:
✅ Short-term Targets:
0.4873 — First major resistance
0.6701 — Mid-range zone with historical confluence
🚀 Mid to Long-Term Targets:
0.8224
0.9216
1.1730
1.2384 — Full recovery back to former highs
🔼 These zones align with Fibonacci extensions and historical resistance areas. Bull momentum can accelerate quickly due to short covering and new buyers entering.
🔴 Bearish Scenario (Invalidation Level)
If price fails to hold above 0.3210, the bullish setup is invalidated short-term:
Breakdown could revisit 0.2910 (Fib 0.786 support)
Below that: full retrace to the December–March demand base at 0.2420
🛑 Key Invalidation Level: Break below 0.3210 with strong selling pressure.
📌 Strategic Summary
ARB has broken its macro downtrend, signaling the start of a new phase.
Holding above the golden pocket zone (0.3210–0.3422) is critical for continuation.
Targets above 0.9–1.2 are realistic if the market sustains its momentum.
Monitor volume and RSI for further confirmation of bullish strength.
🔍 Traders Note:
This setup reflects an ideal blend of trend reversal, Fibonacci support, and breakout confirmation — a textbook setup for swing and positional traders aiming for medium-term upside.
#ARB #ARBUSDT #BreakoutAlert #CryptoTA #TrendReversal #BullishSetup #TechnicalAnalysis #CryptoTrading #FibonacciLevels #DescendingTriangle #AltcoinBreakoutl

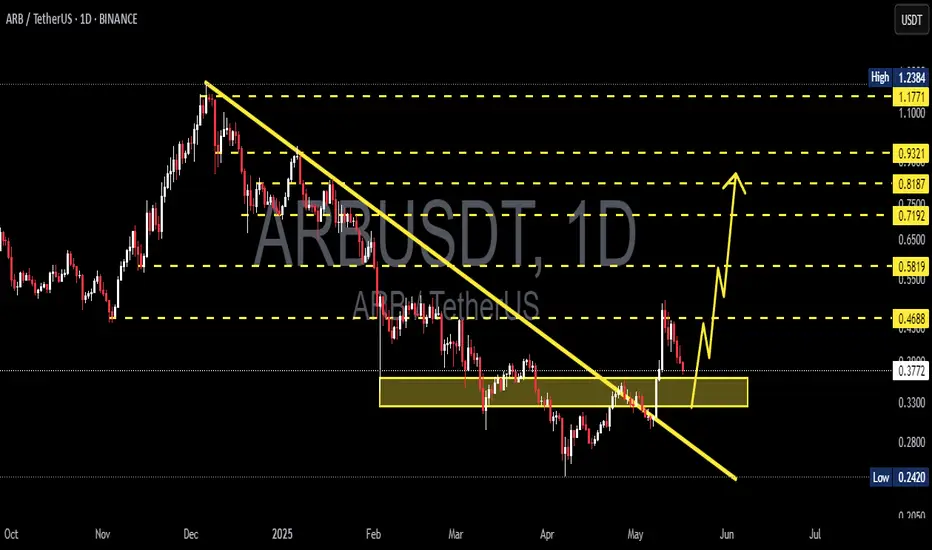
ARB/USDT Ready for a Major Breakout! Accumulation1. Downtrend Line:
ARB has been in a sustained downtrend since late 2024, marked by a descending trendline from previous highs. The current price is testing this resistance line, hinting at a possible breakout.
2. Strong Support Zone (Demand Area):
A clear accumulation zone is observed between $0.28–$0.30, where the price has consistently bounced back. This indicates solid buying pressure and strong investor interest at this level.
3. Potential Breakout Signal:
The price is now compressing near the end of the descending triangle and is forming higher lows, suggesting a breakout setup is forming.
4. Projected Price Targets (If Breakout Confirmed):
Upon successful breakout and retest confirmation, ARB may rally toward the following resistance levels:
$0.3586
$0.3930
$0.4131
$0.4887
$0.6400
Ultimate targets could reach as high as $0.7148–$0.9197, depending on market momentum.
5. Risk & Invalidations:
A failure to hold the $0.28–$0.30 support zone and a breakdown below may invalidate the bullish structure, potentially retesting the low near $0.2420.
Conclusion:
This chart presents a high-potential breakout opportunity for ARB/USDT. Strong accumulation at key support, along with building pressure against the descending trendline, suggests a significant reversal could be underway. A great setup for swing traders and medium-term investors to monitor closely.
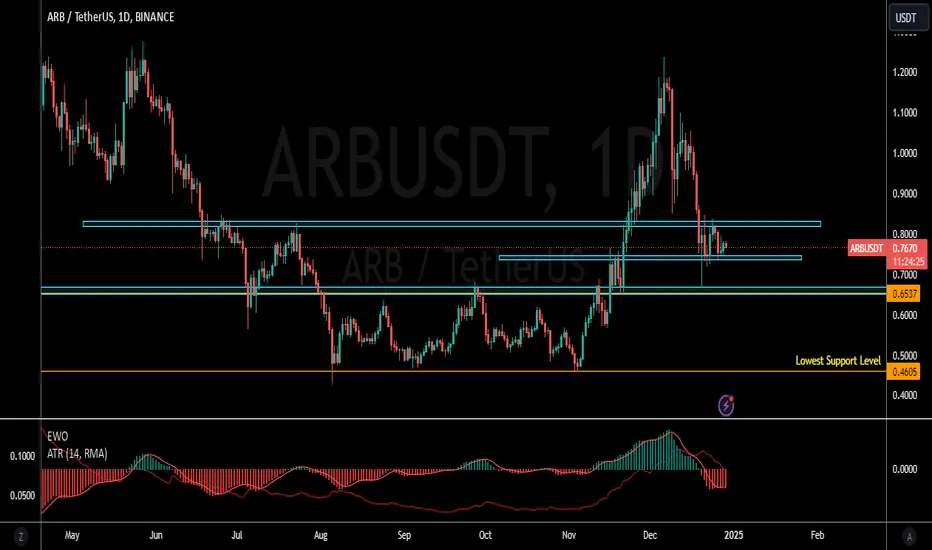
ARBUSDT 1D Analysis ARB ~ 1D Analysis
#ARB Buy back gradually from here if you still have confidence in this coin with a short term target of at least 15%++ from here.
ARB (the strongest weekly candle what next ?)ARB / USDT
The Price printed the strongest weekly candle at horizon trendline after Series of downtrends such price action support the idea of being the bottom !
What next ?
Possible playout in coming weeks we see the price hit the recent high of December and after that if bulls continue showing their strength may hit the next target in my chart
Best wishes
ARBUSDT 1DARB ~ 1D Analysis
#ARB Buy gradually after successfully penetrating this resistant line with a short -term target of at least 10%+.

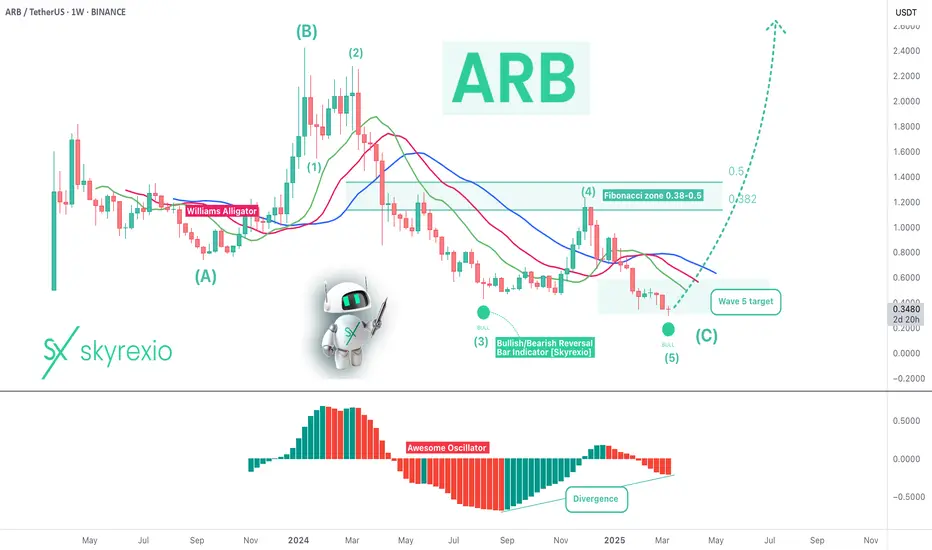
Arbitrum ARB Is About To Flash Insane Long Signal!Hello, Skyrexians!
We decided to find the crypto assets with the largest potential and the proper Elliott waves structure and found BINANCE:ARBUSDT which is still at the bottom but has a great chance to print the super strong long signal.
Let's take a look at the weekly chart. We can count all the price action on the Binance exchange as the large irregular correction ABC. Wave C lasts already exactly one year. This wave always consists of 5 waves and here we can have a clear counting. Look how perfect was the wave 4 touch of 0.38-0.5 Fibonacci zone. Now price has reached the maximum target of wave 5. In conjunction with the divergence with the Awesome Oscillator, angulation with Alligator and potential green dot on or Bullish/Bearish Reversal Bar Indicator we can conclude that probability of reversal now is more than 80%. The only one thing we need to wait for the next week to see the green dot confirmation.
Best regards,
Skyrexio Team
___________________________________________________________
Please, boost this article and subscribe our page if you like analysis!
ARBUSDT Potentially BullishBINANCE:ARBUSDT hits its lowest support area at the 0.4605 area creating a double bottom around the lowest support and a neckline at the 0.6537 level. We have seen the neckline broken and retested almost immediately however, price has come back to same area for a major structural retest. If this holds as a new found support, we just might see price going higher and a 10x is highly possible.
Potential buying areas:
0.6537
0.7393
0.8228
I will not just buy at these areas without seeing price action setup indicating the buy opportunity, hence do your due diligence before taking any trade idea
Past results does not guarantee future results
#ARBUSDT
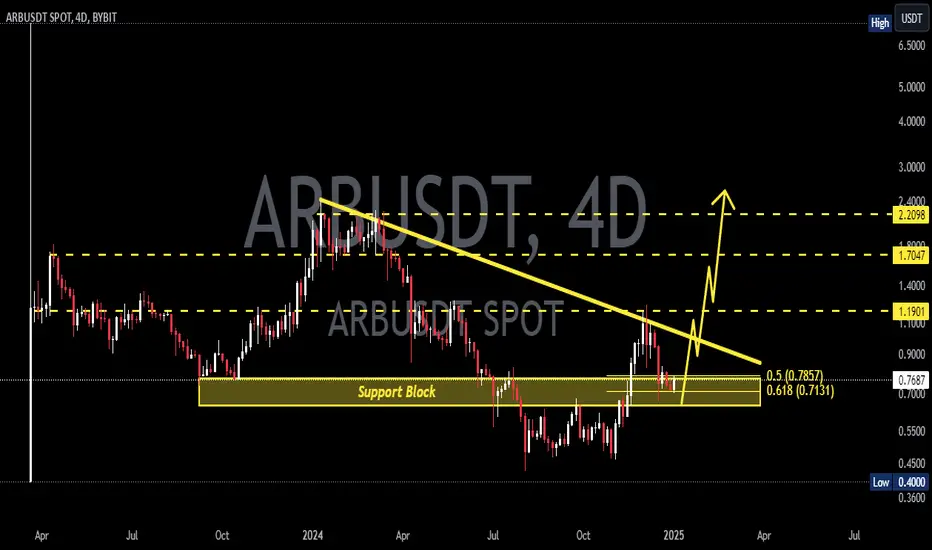
ARBUSDT 4DARB Update ~ 4D
#ARB So far it still maintains its bullish structure. This is a very good Support Block for your next purchase. Minimum target 20%++
ARBUSDTARB ~ 2D
#ARB Do you still have Conviction on this coin? If yes,. perhaps this support block will be an interesting purchase for now.
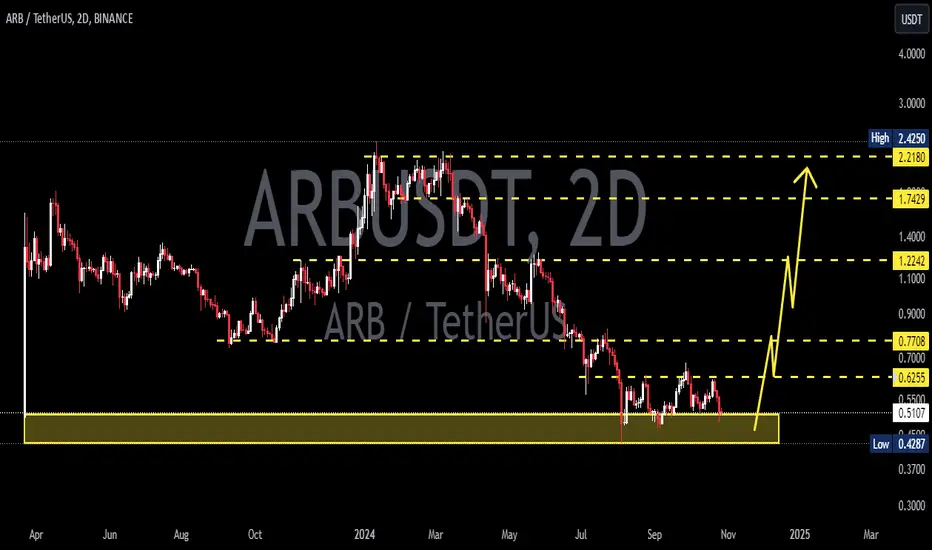
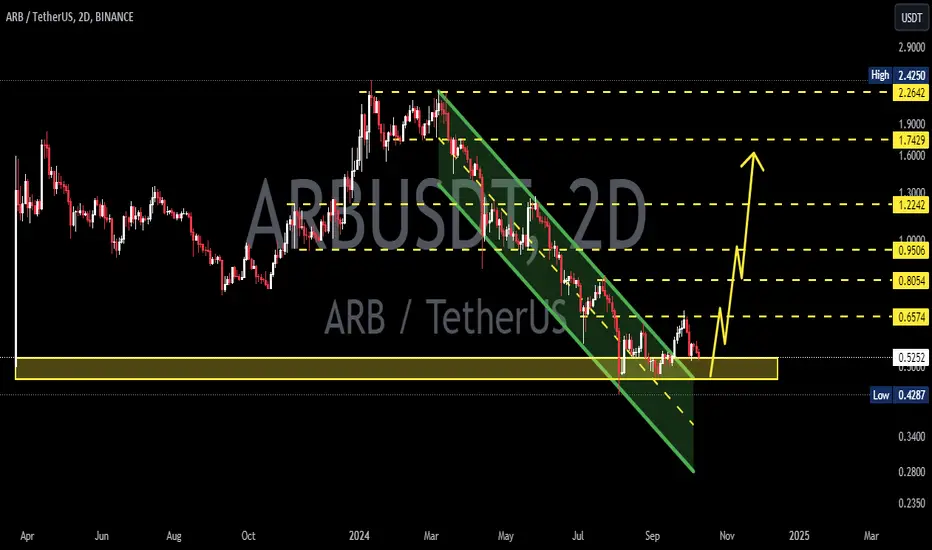
ARBUSDTARB ~ 2D
#ARB Do you still have Conviction on this coin? If yes,. perhaps this support block will be an interesting purchase for now.
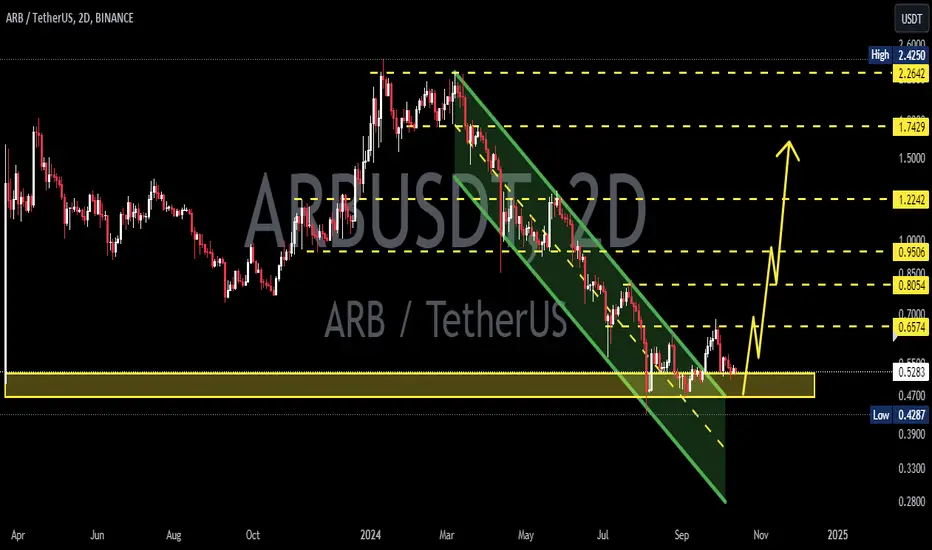
ARBUSDTARB ~ 2D ✅
#ARB Do you still have Conviction on this coin? If yes,. perhaps this support block will be an interesting purchase for now.
ARBUSDTARB ~ Update
#ARB It finally broke through the resistance line of this descending pattern. Bulls should start to take control from here.
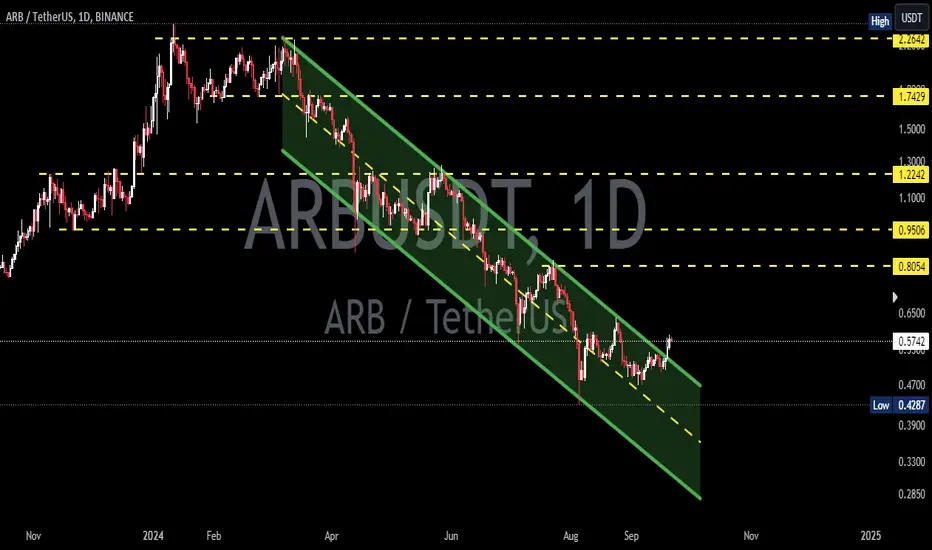
ARBUSDT 1WARB ~ 1D
#ARB Make purchases gradually in this descending pattern. it is only a matter of time that this descending pattern will be broken.

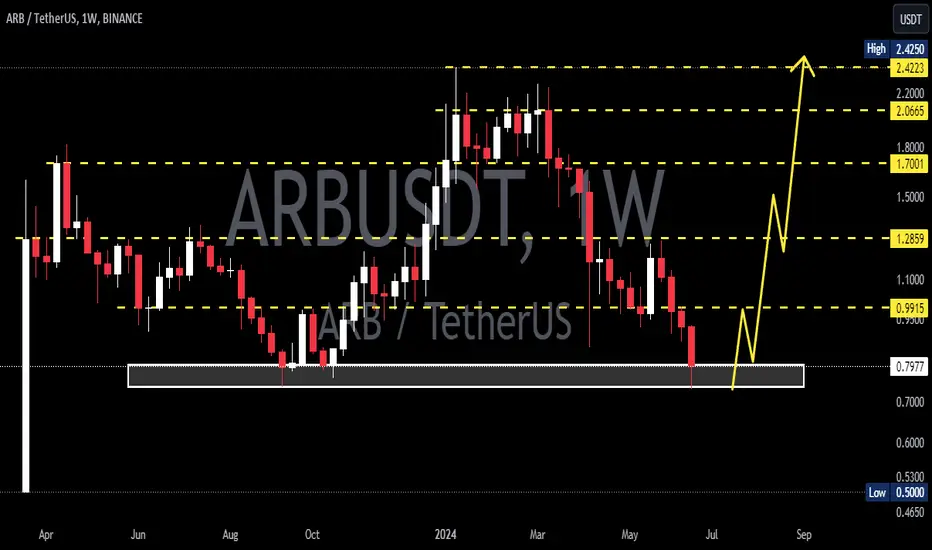
ARBUSD 1WARB ~ 1W
#ARB This Support Block will be our first purchase. with a short term target of at least 20%+. We are still bullish on this token.
We will continue to accumulate these tokens despite the terrible possibility of losing this support block.
ARBUSDT Elliott Waves Analysis (Local Setup)Hello friends.
Please support my work by clicking the LIKE button👍(If you liked). Also i will appreciate for ur activity.
Everything on the chart.
Entry: Market and lower
Targets: 1.3 - 1.45 - 1.6
after first target reached move ur stop to breakeven
Stop: 0.95 (depending of ur risk).
ALWAYS follow ur RM
risk is justified
Good luck everyone!
It's not financial advice.
DYOR!
"ARB" RBI came out!!!Hello! friends, How have you been?
I brought a VERY attractive chart for you today.
It's the ARBUSDT chart that can reverse the long bearish. If you take a position, It can better attractive position as the RR.
■It is being adjusted after breaking the big downtrend line.
■ Adjustment value is 0.786 (very stable)
■it is being Retested of bullish.
■The horizontal resistance line just above the overlaps with zone as a very having heavy buttocks zone.

ARBUSD 1WARB ~ 1W 📈
#ARB will Retest this Support Block. We will place small purchases here in stages with a minimum target of 20%+

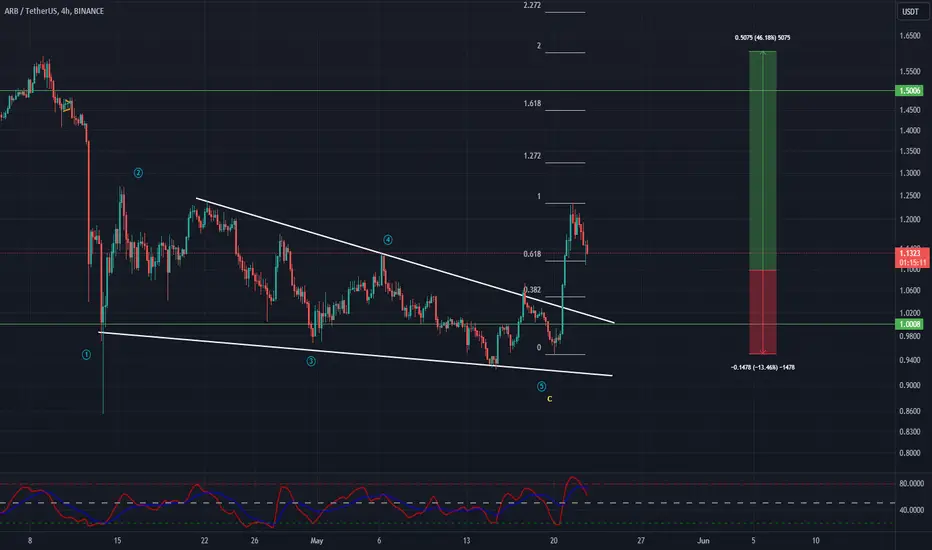
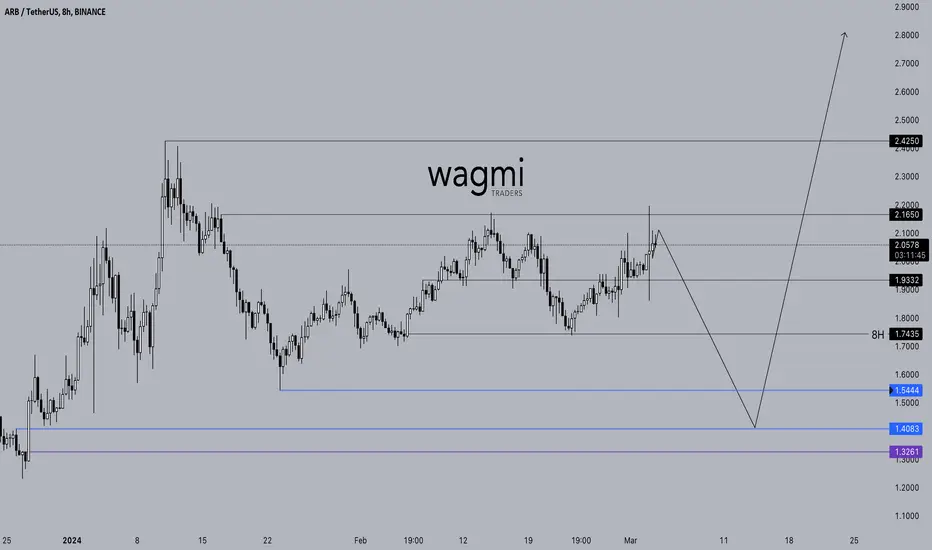
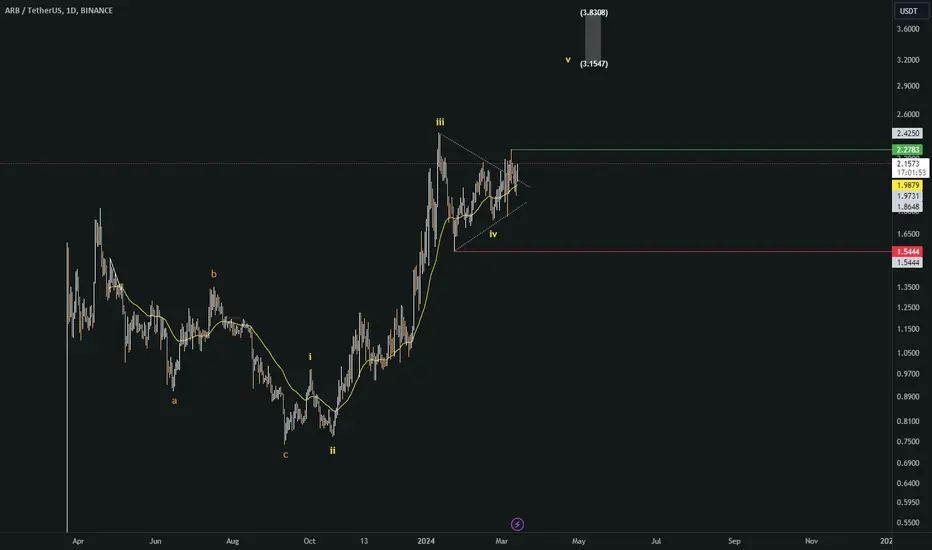
Long-Term ARB Coin Analysis! Where Will We Buy?#ARB
We believe that unless ARB coin closes daily candles above the resistance level of $2.165, it will initiate a downward movement. However, for it to experience a decline, it first needs to break below the support of $1.933, followed by daily candle closures below the $1.743 support.
For ARB coin, our areas for spot buying are as follows: $1.544 - $1.409 levels (Blue lines). If a downturn occurs to our buying zones, we will invest for the long term. If the price continues its upward trend without reaching our buying zones, we will cancel the analysis.
However, our buying orders will be placed at $1.544 - $1.409 levels unless it surpasses the resistances of $2.165 - $2.42.
WAGMI
NFA
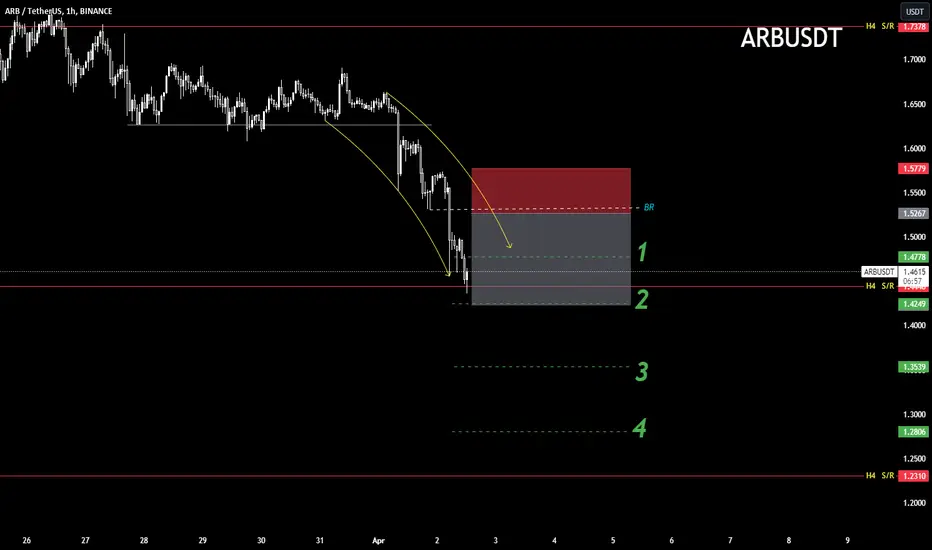
ARB: sell in channel📊Analysis by AhmadArz:
🔍Entry: 1.526
🛑Stop Loss: 1.577
🎯Take Profit: 1.477-1.424-1.353-1.280
🔗"Uncover new opportunities in the world of cryptocurrencies with AhmadArz.
💡Join us on TradingView and expand your investment knowledge with our five years of experience in financial markets."
🚀Please boost and💬 comment to share your thoughts with us!
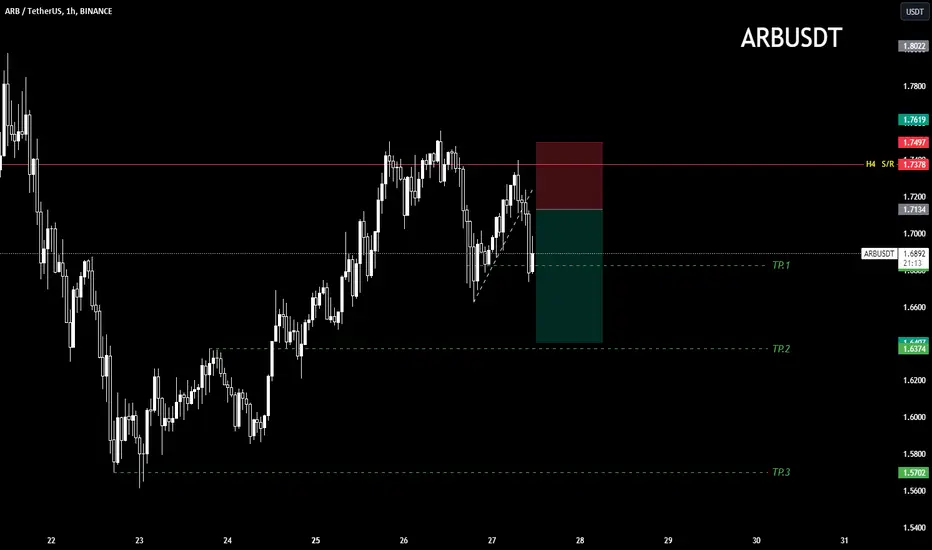
ARB: sell by trend📊Analysis by AhmadArz:
🔍Entry: 1.713
🛑Stop Loss: 1.749
🎯Take Profit: 1.682-1.640-1.570
🔗"Uncover new opportunities in the world of cryptocurrencies with AhmadArz.
💡Join us on TradingView and expand your investment knowledge with our five years of experience in financial markets."
🚀Please boost and💬 comment to share your thoughts with us!
ARB / ARBUSDTGood Luck >>
• Warning •
Any deal I share does not mean that I am forcing you to enter into it, you enter in with your full risk, because I'll not gain any profits with you in the end.
The risk management of the position must comply with the stop loss.
(I am not sharing financial or investment advice, you should do your own research for your money.)
ARBUSDT Elliott Waves (Local Setup)Hello friends.
Please support my work by clicking the LIKE button👍(If you liked). Also i will appreciate for ur activity. Thank you!
Everything on the chart.
Entry: Market and lower (im in pos from 1.88)
Targets: 2.3 - 2.6 - 2.8
after first target reached move ur stop in breakeven
Stop: under 1.6 (depending of ur risk).
RR: 1 to 3
ALWAYS follow ur RM.
risk is justified
Good luck everyone!
Follow me on TRADINGView, if you don't want to miss my next analysis or signals.
It's not financial advice.
Dont Forget, always make your own research before to trade my ideas!
Open to any questions and suggestions
