Can ARB get $1 back?!Hey there! It looks like the BINANCE:ARBUSDT token, which powers the Arbitrum blockchain, is getting ready for a big move. It's showing some strong bullish momentum, and we might see it climb past the $1 mark soon. This is happening at a great time, as the overall crypto market has been on a tear lately. Just look at how well Ethereum and other top coins have performed—it seems ARB is following a similar path.
⛔"Daily crypto market analyses I provide are personal opinions & not financial advice. Trading carries risks, so do your own research & seek advisor's help. #DYOR
Arbusdtlong
Key Zone Reclaimed: Can $ARB Push Higher?AMEX:ARB has reclaimed the support zone and is holding above it, showing early bullish strength.
However, price is still far from the major descending resistance, so for now, it’s in a mid-range. Bulls need to defend this level to build toward a potential breakout later.
DYOR, NFA
#ARB/USDT#ARB
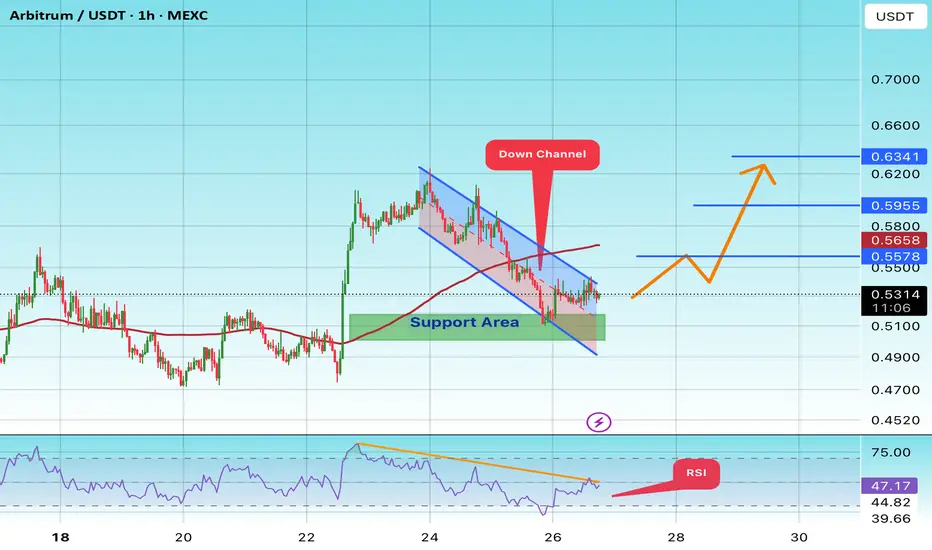
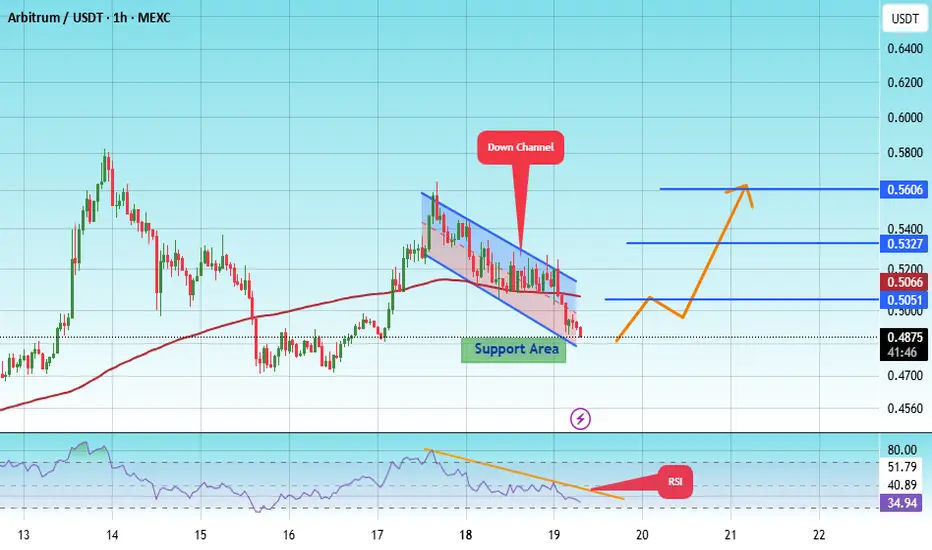
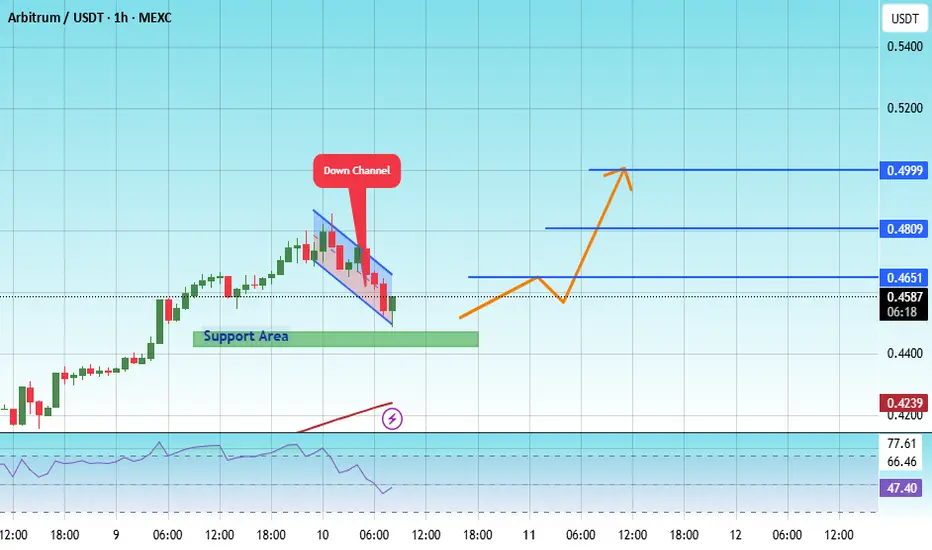
The price is moving within a descending channel on the 1-hour frame and is expected to break and continue upward.
We have a trend to stabilize above the 100 moving average once again.
We have a downtrend on the RSI indicator that supports the upward break.
We have a support area at the lower boundary of the channel at 0.4900, acting as strong support from which the price can rebound.
We have a major support area in green that pushed the price upward at 0.5000.
Entry price: 0.5314.
First target: 0.5578.
Second target: 0.5955.
Third target: 0.6341.
To manage risk, don't forget stop loss and capital management.
When you reach the first target, save some profits and then change your stop order to an entry order.
For inquiries, please comment.
Thank you.
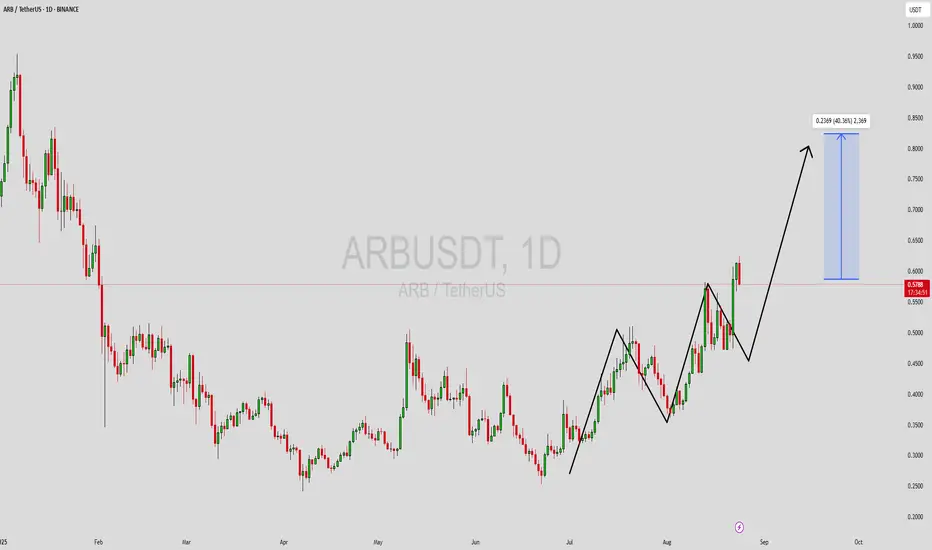
ARBUSDT Forming Bullish WaveARBUSDT is currently forming a bullish wave pattern, signaling a continuation of upward momentum after a period of accumulation. This setup often reflects strengthening buyer interest and growing confidence among investors. The market structure suggests that the pair could see a breakout, with projections pointing to potential gains of 30% to 40%+ in the coming sessions. The healthy trading volume further confirms strong participation and momentum support for this bullish outlook.
The consistent price movement within this wave formation highlights the potential for sustained upward growth. If ARBUSDT maintains its current pace and successfully breaks above key resistance levels, it could trigger a strong bullish rally. Traders should keep an eye on support and resistance zones to confirm the breakout and capitalize on possible price surges.
Investor sentiment toward ARBUSDT is also improving, with increasing participation and interest in the project. As more traders recognize the bullish technical structure and the possibility of strong returns, the pair is gaining traction as a favorable setup. With good volume and clear technical signals, ARBUSDT presents an attractive opportunity for those looking for mid-term upside potential.
✅ Show your support by hitting the like button and
✅ Leaving a comment below! (What is You opinion about this Coin)
Your feedback and engagement keep me inspired to share more insightful market analysis with you!
#ARB/USDT – Watching Key Support for Long Entry !#ARB
The price is moving within an ascending channel on the 1-hour frame, adhering well to it, and is on track to break it strongly upwards and retest it.
We have support from the lower boundary of the ascending channel, at 0.4880.
We have a downtrend on the RSI indicator that is about to break and retest, supporting the upside.
There is a major support area in green at 0.4800, which represents a strong basis for the upside.
Don't forget a simple thing: ease and capital.
When you reach the first target, save some money and then change your stop-loss order to an entry order.
For inquiries, please leave a comment.
We have a trend to hold above the 100 Moving Average.
Entry price: 0.4880.
First target: 0.5050.
Second target: 0.5327.
Third target: 0.5600.
Don't forget a simple thing: ease and capital.
When you reach the first target, save some money and then change your stop-loss order to an entry order.
For inquiries, please leave a comment.
Thank you.
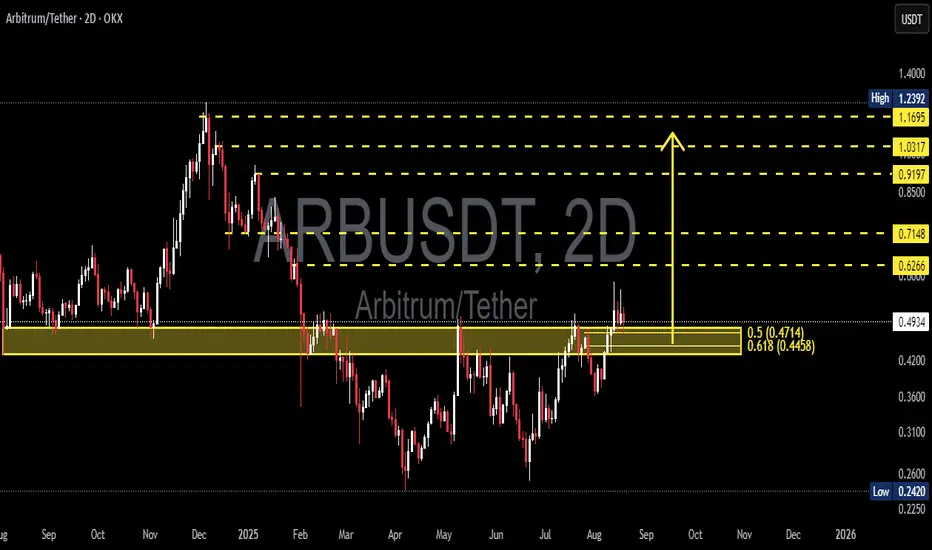
ARB/USDT — Golden Pocket Re-Test: Big Momentum Ahead?🔎 Chart Overview
ARB/USDT (2D - OKX) is now at a critical decision point. The price is currently testing the Golden Pocket Fibonacci 0.5–0.618 (0.445–0.475 USDT), which also aligns with a Support-Resistance Flip (S/R Flip) from previous structure.
This area is not just another technical level; it’s the “battlefield” that will define whether ARB enters a new bullish trend or slips back into a deeper correction.
---
📈 Bullish Scenario (Trend Continuation)
If ARB can close above 0.495–0.505 (2D candle confirmation), the Golden Pocket re-test will be validated. This could trigger a progressive bullish wave with targets as follows:
1️⃣ 0.6266 → first resistance checkpoint
2️⃣ 0.7148 → key psychological + structural resistance
3️⃣ 0.8500 → mid-range target
4️⃣ 0.9197 → prior supply zone
5️⃣ 1.0317 → strong historical resistance
6️⃣ 1.1695–1.2392 → major supply zone / previous swing high
👉 If this scenario plays out, we could see +20% to +120% upside from current levels.
---
📉 Bearish Scenario (Failed Re-Test)
On the flip side, if ARB fails to hold above 0.445, the Golden Pocket will flip into a strong sell zone. That could send the price into deeper levels:
0.420 → immediate minor support
0.360 → important support floor
0.310 → old consolidation base
0.260 – 0.2420 → extreme demand zone & structural low
👉 This scenario would expose ARB to a potential -30% to -50% downside.
---
🌀 Structure & Pattern Insight
Accumulation Signs: Since June 2025, ARB has been forming Higher Lows, hinting at steady accumulation.
Supply Test: Repeated rejection above 0.50 shows sellers are still defending this level.
Golden Pocket (0.445–0.475) → the ultimate battleground for buyers vs. sellers.
---
🎯 Key Takeaway
Above 0.475–0.495 = Bullish Bias → targets 0.6266, 0.7148, and beyond.
Below 0.445 = Bearish Bias → targets 0.42, 0.36, even 0.26–0.24.
In other words, this Golden Pocket will act as the gateway to ARB’s next big trend.
---
📝 Final Notes
Wait for 2D/1W closes to avoid false breakouts.
Manage risk wisely → this area is prone to liquidity grabs & fake-outs.
Whichever side wins this zone, momentum could be explosive.
#ARB #Arbitrum #ARBUSDT #CryptoAnalysis #PriceAction #GoldenPocket #SupportResistance #Fibonacci #CryptoTrading
#ARB/USDT – Watching Key Support for Long Entry !#ARB
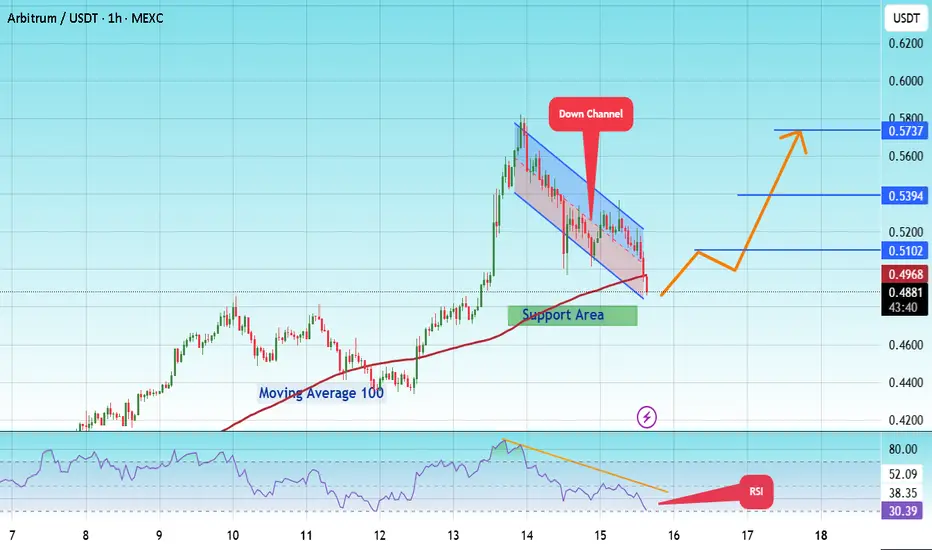
The price is moving within a descending channel on the 1-hour frame and is expected to break and continue upward.
We have a trend to stabilize above the 100 moving average once again.
We have a downtrend on the RSI indicator that supports the upward move with a breakout.
We have a support area at the lower boundary of the channel at 0.4850, acting as strong support from which the price can rebound.
We have a major support area in green that pushed the price upward at 0.4740.
Entry price: 0.4890.
First target: 0.5100.
Second target: 0.5394.
Third target: 0.5737.
To manage risk, don't forget stop loss and capital management.
When you reach the first target, save some profits and then change the stop order to an entry order.
For inquiries, please comment.
Thank you.
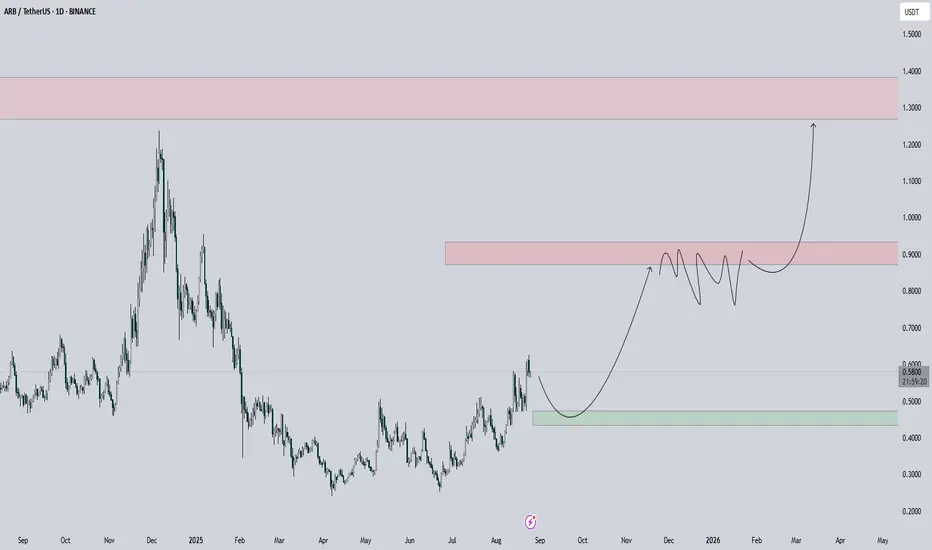
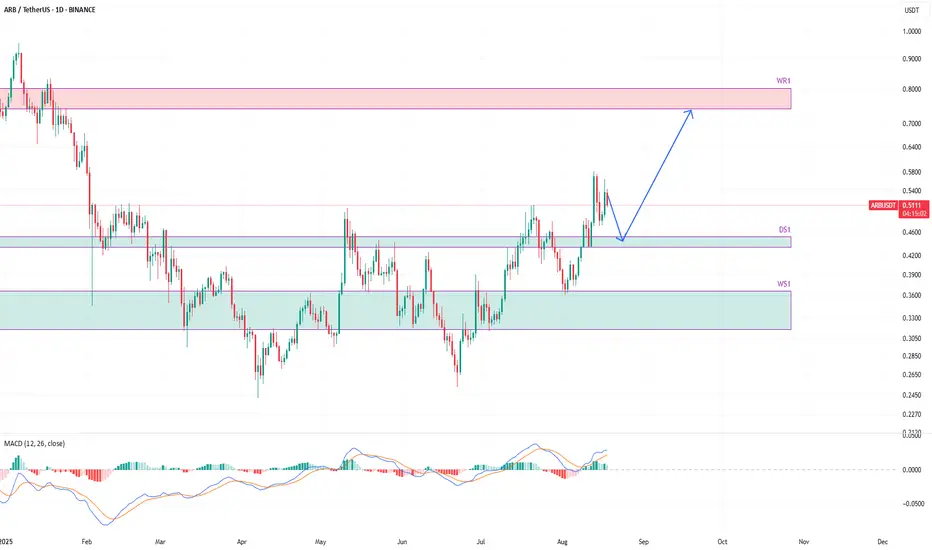
ARBUSDT to head to daily support before bounce to 0.75#ARB #ARBUSD #ARBUSDT AMEX:ARB
This is how I see #ARBUSDT playing out.
The price is pulling back right now and I see that it is likely that the price will land into daily support zone DS1.
The price is likely to bounce from DS1. However, we will monitor how it reacts when it taps into DS1 zone.
Upon bounce from DS1, the price will likely target weekly resistance zone WR1.
What do you think about this price action possibility? Let me know in the comments.
#ARB/USDT – Watching Key Support for Long Entry#ARB
The price is moving within an ascending channel on the 1-hour frame, adhering well to it, and is on track to break it strongly upwards and retest it.
We have support from the lower boundary of the ascending channel, at 0.4500.
We have a downtrend on the RSI indicator that is about to break and retest, supporting the upside.
There is a major support area in green at 0.4420, which represents a strong basis for the upside.
Don't forget a simple thing: ease and capital.
When you reach the first target, save some money and then change your stop-loss order to an entry order.
For inquiries, please leave a comment.
We have a trend to hold above the 100 Moving Average.
Entry price: 0.4580.
First target: 0.4650.
Second target: 0.4810.
Third target: 0.5000.
Don't forget a simple thing: ease and capital.
When you reach the first target, save some money and then change your stop-loss order to an entry order.
For inquiries, please leave a comment.
Thank you.
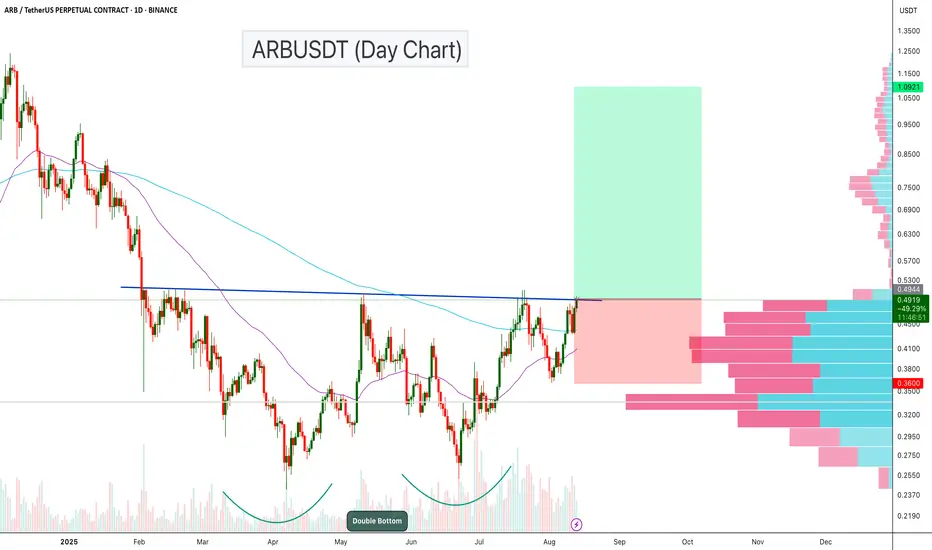
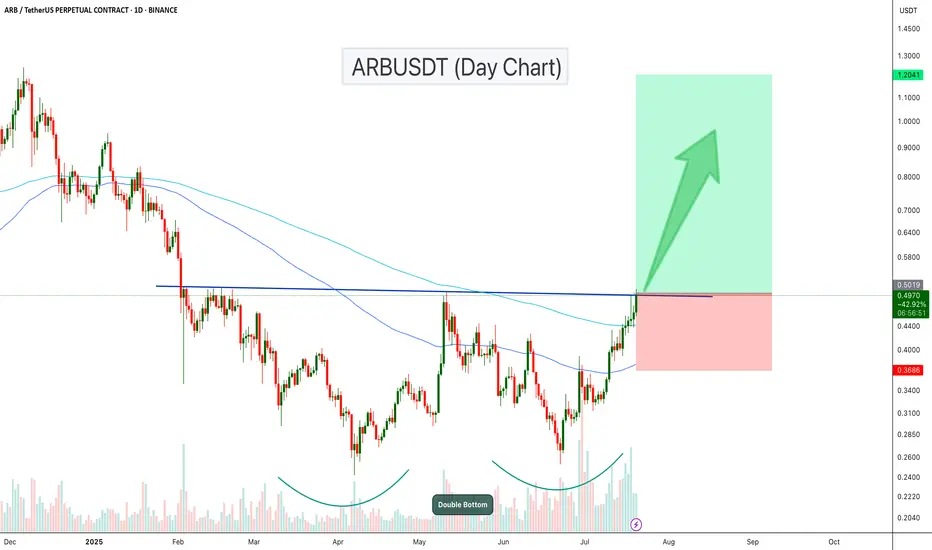
ARBUSDT – Double Bottom Breakout Loading?ARBUSDT is showing a strong bullish structure on the daily chart, with a classic Double Bottom pattern forming over the past few months. Price is now pressing against the neckline resistance, which, if broken, could trigger a powerful upside move.
Key Points:
Double Bottom Formation: The pattern started in April 2025 and completed its second bottom in July, indicating a potential long-term reversal setup.
Neckline Resistance: Price is currently testing the $0.49–$0.50 zone, which aligns with previous swing highs and marks the breakout level for the pattern.
Volume Profile: The visible range volume profile shows low-volume nodes above $0.50, suggesting a potential “thin air” move toward higher targets if the breakout is confirmed.
The chart is setting up for a potential trend reversal. A confirmed breakout from the double bottom neckline could propel ARBUSDT toward the $1+ zone
Cheers
Hexa
#ARB/USDT#ARB
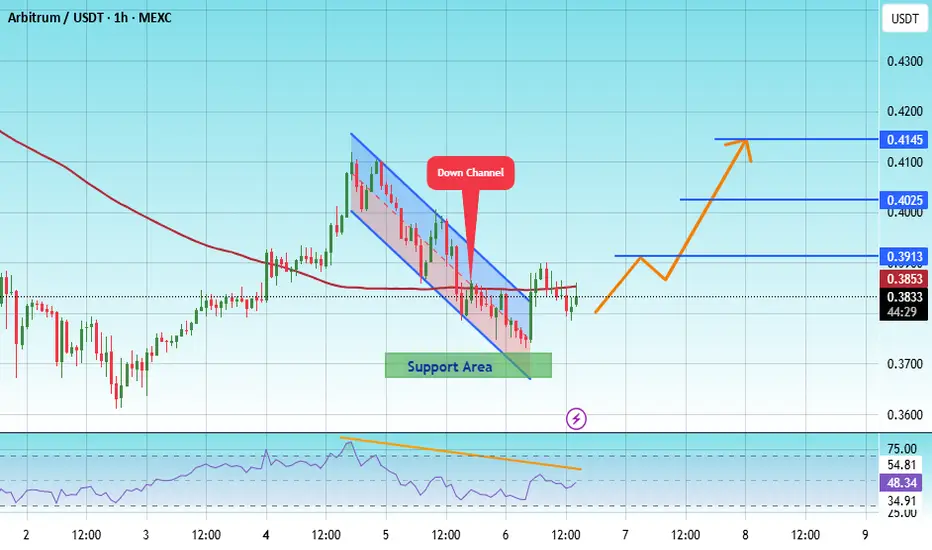
The price is moving within an ascending channel on the 1-hour frame, adhering well to it, and is on track to break it strongly upwards and retest it.
We have support from the lower boundary of the ascending channel, at 0.3735.
We have a downtrend on the RSI indicator that is about to break and retest, supporting the upside.
There is a major support area (in green) at 0.3688, which represents a strong basis for the upside.
Don't forget a simple thing: ease and capital.
When you reach the first target, save some money and then change your stop-loss order to an entry order.
For inquiries, please leave a comment.
We have a trend to hold above the 100 Moving Average.
Entry price: 0.3832.
First target: 0.3913.
Second target: 0.4025.
Third target: 0.4145.
Don't forget a simple thing: ease and capital.
When you reach your first target, save some money and then change your stop-loss order to an entry order.
For inquiries, please leave a comment.
Thank you.
#ARB/USDT#ARB
The price is moving within a descending channel on the 1-hour frame, adhering well to it, and is on its way to breaking strongly upwards and retesting it.
We have support from the lower boundary of the descending channel, at 0.4550.
We have a downtrend on the RSI indicator that is about to be broken and retested, supporting the upside.
There is a major support area in green at 0.4520, which represents a strong basis for the upside.
Don't forget a simple thing: ease and capital.
When you reach the first target, save some money and then change your stop-loss order to an entry order.
For inquiries, please leave a comment.
We have a trend to hold above the 100 Moving Average.
Entry price: 0.4616
First target: 0.4751
Second target: 0.4923
Third target: 0.5135
Don't forget a simple thing: ease and capital.
When you reach the first target, save some money and then change your stop-loss order to an entry order.
For inquiries, please leave a comment.
Thank you.

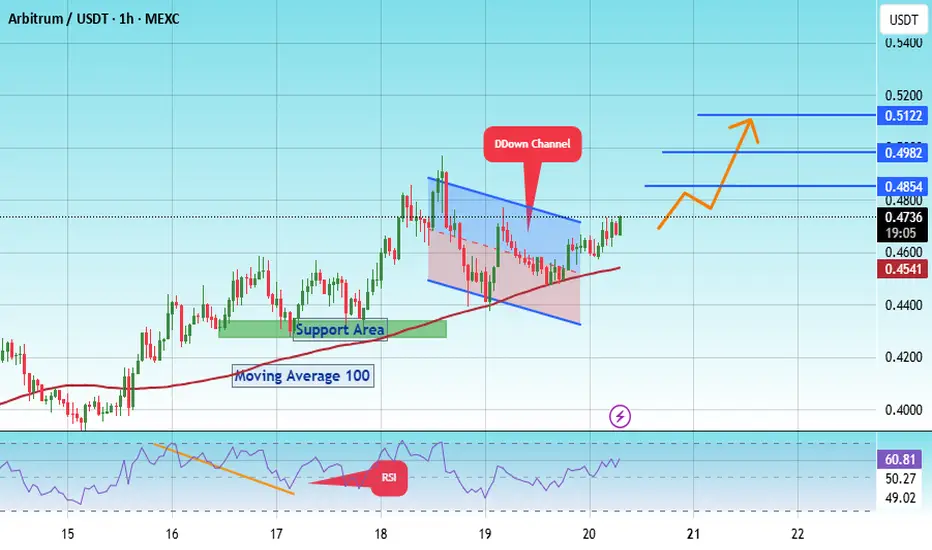
#ARB/USDT Arbitrum scalp long to $ 0.5122#ARB
The price is moving within a descending channel on the 1-hour frame, adhering well to it, and is on its way to breaking strongly upwards and retesting it.
We have support from the lower boundary of the descending channel at 0.4270.
We have a downtrend on the RSI indicator that is about to be broken and retested, supporting the upside.
There is a major support area in green at 0.4300, which represents a strong basis for the upside.
Don't forget a simple thing: ease and capital.
When you reach the first target, save some money and then change your stop-loss order to an entry order.
For inquiries, please leave a comment.
We have a trend to hold above the 100 Moving Average.
Entry price: 0.4720
First target: 0.5554
Second target: 0.4982
Third target: 0.5122
Don't forget a simple thing: ease and capital.
When you reach your first target, save some money and then change your stop-loss order to an entry order.
For inquiries, please leave a comment.
Thank you.
ARBUSDT Breaks Out of Double Bottom!ARB has formed a clear double bottom pattern on the daily chart, signaling a strong reversal structure. After multiple rejections, the price has now broken above the neckline resistance, confirming bullish momentum.
The breakout is also supported by increasing volume and a bullish crossover of the 100 and 200 EMA zones. If the current momentum holds, ARB could reach the target of $0.75- $1.20 level.
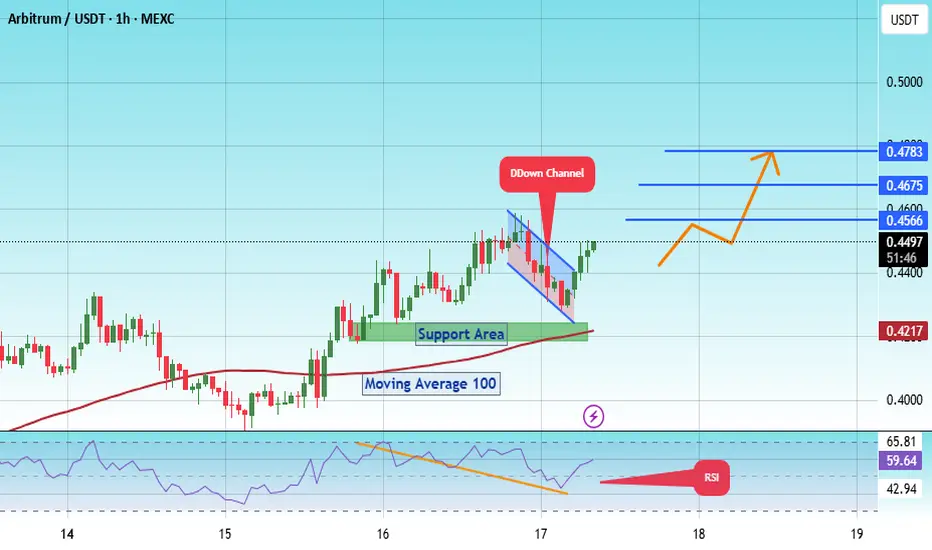
#ARB/USDT Arbitrum scalp long to $ 0.4783#ARB
The price is moving within a descending channel on the 1-hour frame, adhering well to it, and is poised to break it strongly upwards and retest it.
We have 0.4254 from the lower boundary of the descending channel. This support is at 0.0001500.
We have a downtrend on the RSI indicator that is about to be broken and retested, supporting the upward move.
There is a key support area in green at 0.4170, which represents a strong basis for the upward move.
Don't forget one simple thing: ease and capital.
When you reach the first target, save some money and then change your stop-loss order to an entry order.
For inquiries, please leave a comment.
We have a trend of stability above the Moving Average 100.
Entry price: 0.4484
First target: 0.4566
Second target: 0.4675
Third target: 0.4783
Don't forget one simple thing: ease and capital.
When you reach the first target, save some money and then change your stop-loss order to an entry order.
For inquiries, please leave a comment.
Thank you.
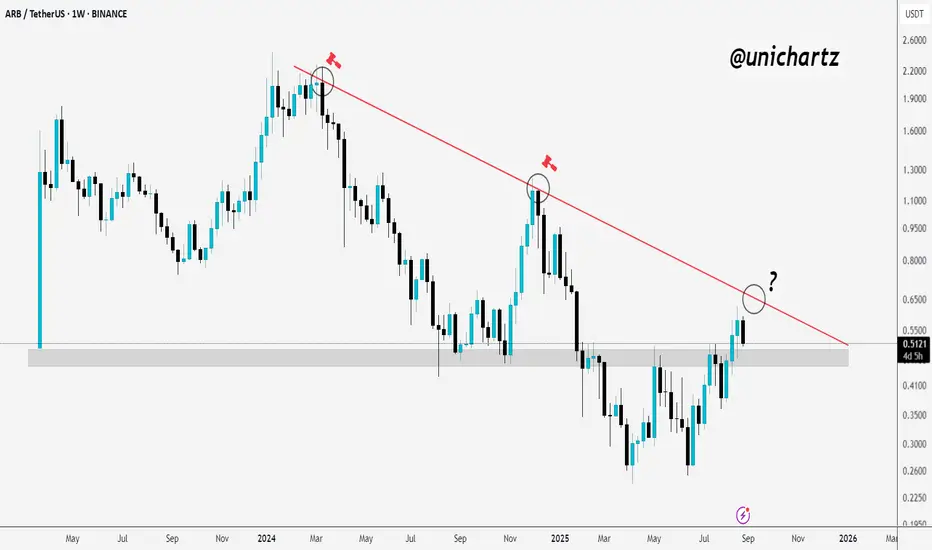
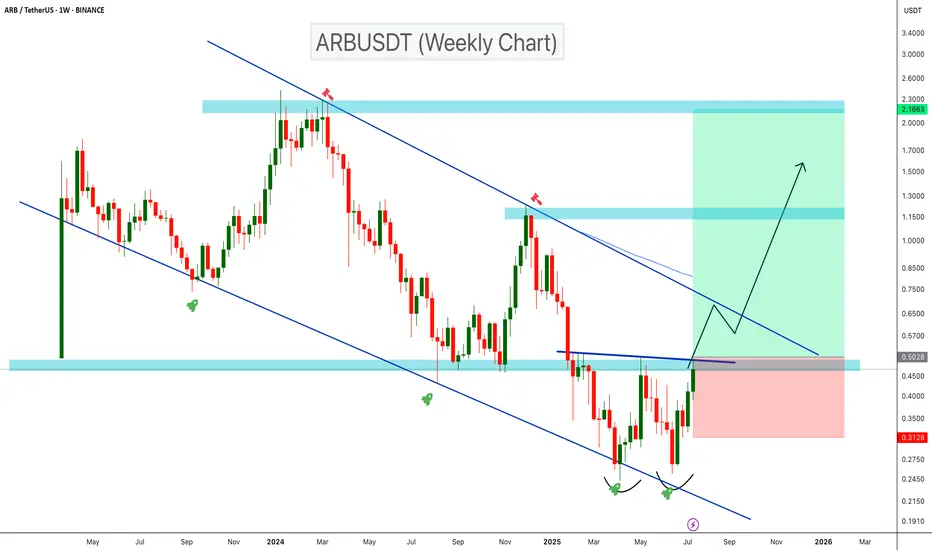
ARBUSDT Double Bottom Signals Bullish Reversal!ARBUSDT is showing a bullish reversal setup on the weekly timeframe after trading within a descending channel for over a year. A clear double bottom has formed near the channel’s lower support, and the price is now breaking above key resistance around $0.50. If this breakout holds, a move toward the upper resistance of the channel and potentially reach the ATH end of this bull run.
Cheers
Hexa
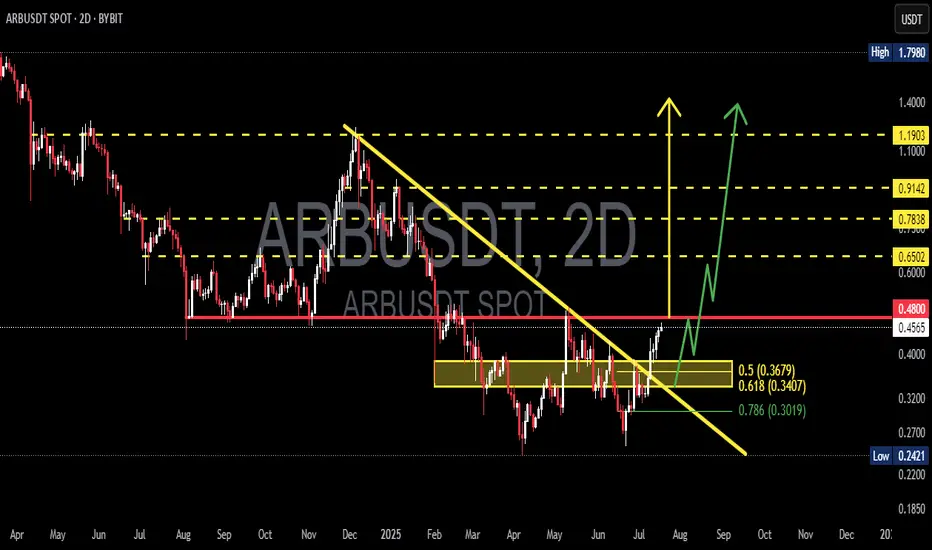
ARBUSDT Ready to Fly? Strong BreakoutARBUSDT has just completed one of its most critical technical phases in recent months — a clean breakout from a medium-term descending trendline that has been suppressing price since December 2024.
📌 Pattern and Price Structure Analysis:
🔹 Descending Trendline Breakout:
After months of downward pressure, ARBUSDT has finally broken above a long-standing trendline. This isn't just another breakout — it's a strong structural signal indicating a potential trend reversal.
🔹 Well-Defined Accumulation Zone:
A solid consolidation base formed between $0.30 - $0.37, highlighted in yellow, serving as a key demand zone. This area aligns perfectly with the Fibonacci retracement levels:
0.5 = $0.3679
0.618 = $0.3407
0.786 = $0.3019
This confluence of support suggests smart money accumulation before the breakout.
📈 Bullish Scenario (High Probability):
If price holds above the recent breakout zone ($0.45–$0.48), the bullish structure remains intact and a multi-level rally may unfold.
🎯 Bullish Targets:
1. First Target: $0.6502 — immediate horizontal resistance.
2. Key Target: $0.7838 — major resistance and previous rejection level.
3. Psychological Level: $0.9142 — pre-breakdown price zone.
4. Maximum Extension: $1.1903 — a potential target if a macro bullish wave develops.
📌 Look for higher lows (HL) and higher highs (HH) structure to confirm sustained bullish momentum.
📉 Bearish Scenario (If Breakout Fails):
A drop back below $0.45 would weaken the bullish outlook.
If the price slips below $0.3679 and loses the 0.618 Fib level at $0.3407, expect a deeper retracement toward:
$0.3019 (0.786 Fib level)
$0.2421 (previous macro low and key support)
🚨 Failure to hold the breakout level could trigger a bull trap, especially if accompanied by declining volume.
🧠 Additional Technical Notes:
Volume increased during the breakout, adding reliability to the move.
Potential formation of an inverse head and shoulders pattern within the base (still early but worth watching).
Momentum indicators like RSI and MACD (not shown) are likely to support the bullish breakout — watch for divergence confirmation.
🧭 Conclusion:
ARBUSDT stands at a critical juncture. The breakout from a long-standing downtrend coupled with a strong accumulation structure gives bulls a tactical edge. However, it must hold above key levels to sustain the momentum.
Smart traders may consider strategic entries on minor retracements while keeping risk in check below the golden pocket zone.
#ARBUSDT #CryptoBreakout #AltcoinReversal #TechnicalAnalysis
#BullishSetup #TrendlineBreakout #FibonacciLevels #CryptoTrading
#Altseason #CryptoSignals
#ARB/USDT Arbitrum scalp long to $ 0.4451#ARB
The price is moving within a descending channel on the 15-minute frame and is expected to break and continue upward.
We have a trend to stabilize above the 100 Moving Average once again.
We have a bearish trend on the RSI indicator, supporting the upward break.
We have a support area at the lower boundary of the channel at 0.4070, acting as strong support from which the price can rebound.
We have a major support area in green that pushed the price upward at 0.3970.
Entry price: 0.4160.
First target: 0.4300.
Second target: 0.4407.
Third target: 0.4451.
To manage risk, don't forget stop loss and capital management.
When you reach the first target, save some profits and then change the stop order to an entry order.
For inquiries, please comment.
Thank you.

ARB/USDT Breaks Downtrend – Major Bullish Reversal in Play!📊 Technical Analysis (Daily Timeframe)
ARB has officially broken out of a long-standing descending trendline that has defined its downtrend since late 2024. This breakout, supported by strong demand at key Fibonacci levels, could be the start of a major bullish reversal.
🧠 Key Chart Patterns & Structure:
🔸 Descending Triangle Breakout
Originally viewed as bearish, this triangle has instead resolved to the upside — a rare but powerful bullish reversal signal when paired with growing volume and price compression near the breakout.
🔸 Fib Retracement Bounce
Price rebounded precisely from the 0.618 (0.3210) and 0.786 (0.2910) levels, confirming these zones as strong accumulation and liquidity areas.
🔸 Break & Retest Zone at 0.3422 – 0.3210
This golden zone will be key for confirming the breakout. A successful retest here sets the stage for the next leg up.
🔸 Bullish Price Structure Formation
A potential higher low and higher high formation is beginning, which would fully confirm the shift from bearish to bullish market structure.
🟢 Bullish Scenario (High Probability)
If the breakout is validated with a successful retest of the zone:
✅ Short-term Targets:
0.4873 — First major resistance
0.6701 — Mid-range zone with historical confluence
🚀 Mid to Long-Term Targets:
0.8224
0.9216
1.1730
1.2384 — Full recovery back to former highs
🔼 These zones align with Fibonacci extensions and historical resistance areas. Bull momentum can accelerate quickly due to short covering and new buyers entering.
🔴 Bearish Scenario (Invalidation Level)
If price fails to hold above 0.3210, the bullish setup is invalidated short-term:
Breakdown could revisit 0.2910 (Fib 0.786 support)
Below that: full retrace to the December–March demand base at 0.2420
🛑 Key Invalidation Level: Break below 0.3210 with strong selling pressure.
📌 Strategic Summary
ARB has broken its macro downtrend, signaling the start of a new phase.
Holding above the golden pocket zone (0.3210–0.3422) is critical for continuation.
Targets above 0.9–1.2 are realistic if the market sustains its momentum.
Monitor volume and RSI for further confirmation of bullish strength.
🔍 Traders Note:
This setup reflects an ideal blend of trend reversal, Fibonacci support, and breakout confirmation — a textbook setup for swing and positional traders aiming for medium-term upside.
#ARB #ARBUSDT #BreakoutAlert #CryptoTA #TrendReversal #BullishSetup #TechnicalAnalysis #CryptoTrading #FibonacciLevels #DescendingTriangle #AltcoinBreakoutl

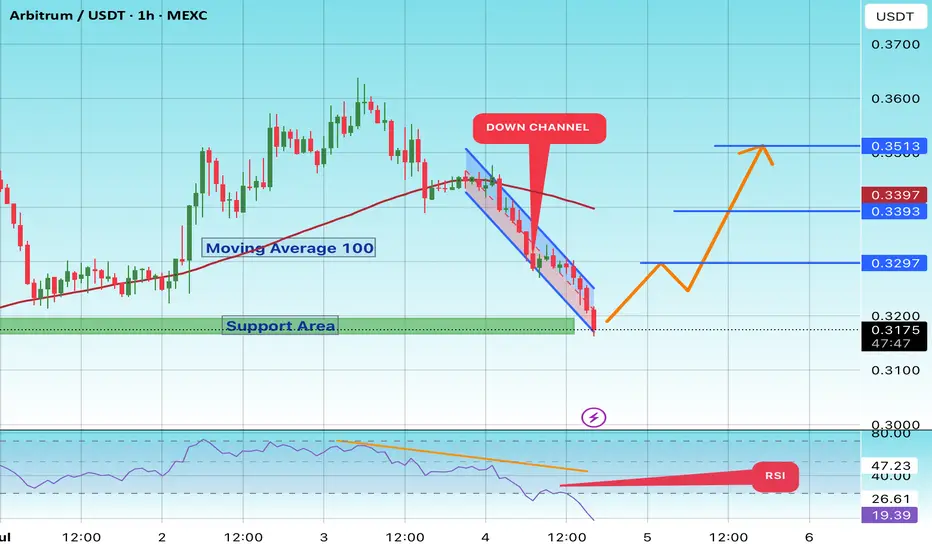
#ARB Can Long Soon#ARB
The price is moving within a descending channel on the 1-hour frame and is expected to break and continue upward.
We have a trend to stabilize above the 100 moving average once again.
We have a downtrend on the RSI indicator that supports the upward move with a breakout.
We have a support area at the lower boundary of the channel at 0.3190, acting as strong support from which the price can rebound.
We have a major support area in green that pushed the price upward at 0.3180.
Entry price: 0.3200
First target: 0.3297
Second target: 0.3393
Third target: 0.3513
To manage risk, don't forget stop loss and capital management.
When you reach the first target, save some profits and then change your stop order to an entry order.
For inquiries, please comment.
Thank you.
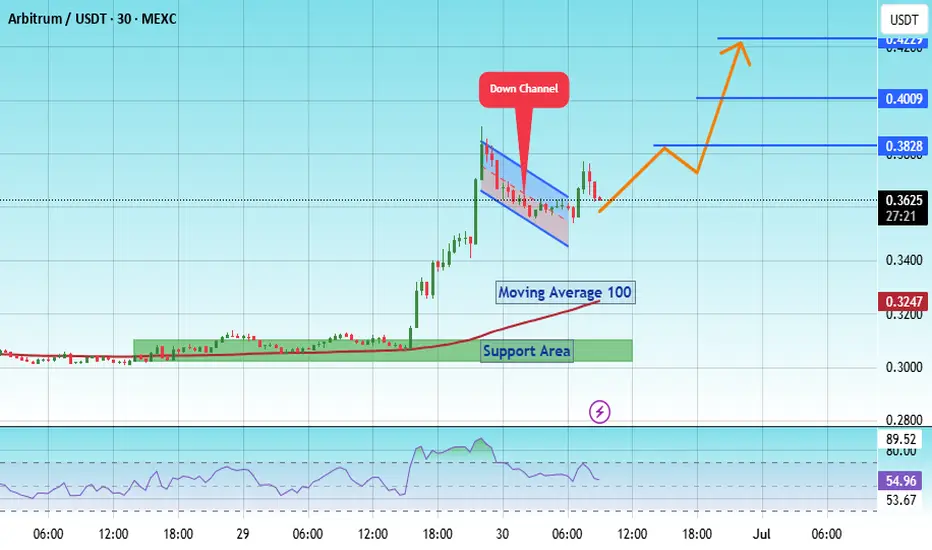
#ARB/USDT Ready for a Major Breakout!#ARB
The price is moving within a descending channel on the 1-hour frame, adhering well to it, and is heading for a strong breakout and retest.
We are seeing a bounce from the lower boundary of the descending channel. This support is at 0.3500.
We have a downtrend on the RSI indicator that is about to be broken and retested, supporting the upside.
There is a major support area in green at 0.3050, which represents a strong basis for the upside.
Don't forget a simple thing: ease and capital.
When you reach the first target, save some money and then change your stop-loss order to an entry order.
For inquiries, please leave a comment.
We are looking to hold above the 100 Moving Average.
Entry price: 0.3640
First target: 0.3828
Second target: 0.4009
Third target: 0.4229
Don't forget a simple thing: ease and capital.
When you reach your first target, save some money and then change your stop-loss order to an entry order.
For inquiries, please leave a comment.
Thank you.
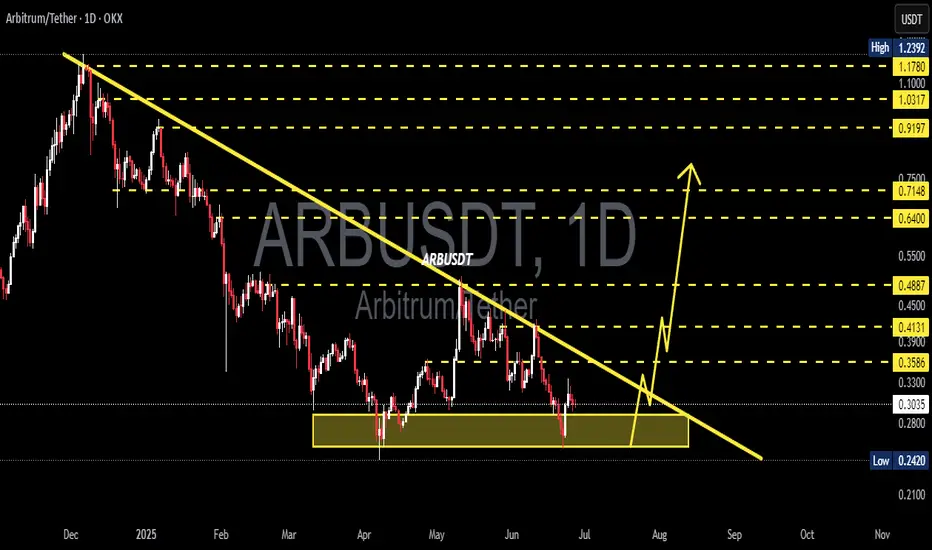
ARB/USDT Ready for a Major Breakout! Accumulation1. Downtrend Line:
ARB has been in a sustained downtrend since late 2024, marked by a descending trendline from previous highs. The current price is testing this resistance line, hinting at a possible breakout.
2. Strong Support Zone (Demand Area):
A clear accumulation zone is observed between $0.28–$0.30, where the price has consistently bounced back. This indicates solid buying pressure and strong investor interest at this level.
3. Potential Breakout Signal:
The price is now compressing near the end of the descending triangle and is forming higher lows, suggesting a breakout setup is forming.
4. Projected Price Targets (If Breakout Confirmed):
Upon successful breakout and retest confirmation, ARB may rally toward the following resistance levels:
$0.3586
$0.3930
$0.4131
$0.4887
$0.6400
Ultimate targets could reach as high as $0.7148–$0.9197, depending on market momentum.
5. Risk & Invalidations:
A failure to hold the $0.28–$0.30 support zone and a breakdown below may invalidate the bullish structure, potentially retesting the low near $0.2420.
Conclusion:
This chart presents a high-potential breakout opportunity for ARB/USDT. Strong accumulation at key support, along with building pressure against the descending trendline, suggests a significant reversal could be underway. A great setup for swing traders and medium-term investors to monitor closely.
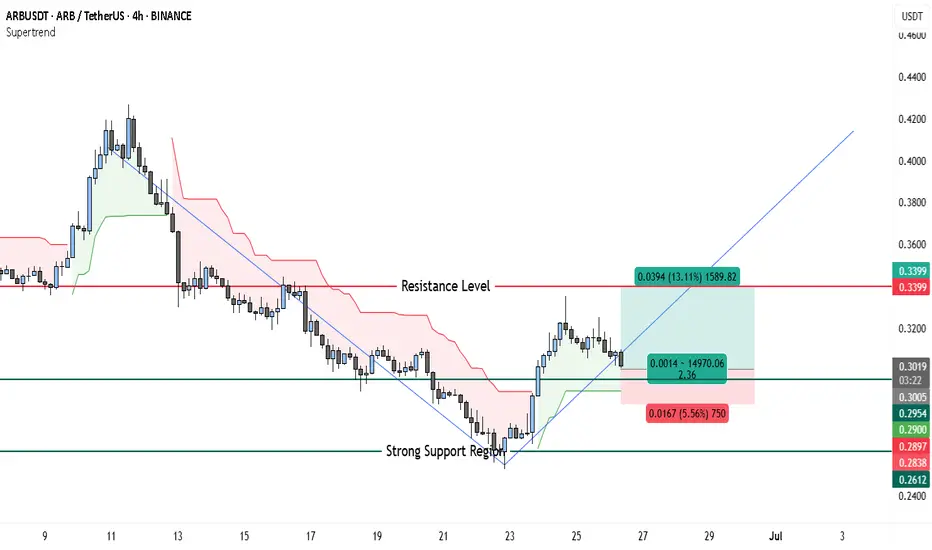
Bullish Setup on ARBUSDT: Risking 5.5% to Gain 13% Toward $0.339The price action of ARBUSDT has shown a significant reversal from a strong support region around 0.2612–0.2838 USDT, marked by bullish engulfing candles and a clear break above the descending trendline. This breakout is reinforced by the Supertrend indicator flipping green, signaling a potential shift in momentum toward the upside.
After bottoming out near 0.26, ARBUSDT has established a short-term higher low structure, and the current price action shows consolidation above the trendline, hinting at a possible continuation toward the next resistance.
A resistance level is marked at 0.3399, which coincides with previous supply and rejection zones. Volume and structure suggest buyers are regaining control, especially after holding support above 0.29 despite market-wide volatility.
📈 Trade Setup
• Entry Zone: 0.3000–0.3015
(Preferably on a bullish 4H candle close above 0.3000 for confirmation)
• Stop-Loss: 0.2838
(Just below the short-term demand zone and minor structure)
• Take-Profit: 0.3399
(Aligns with recent resistance and upper rejection zones)
• Risk–Reward Ratio: ~2.36
(Potential gain: ~13.11%, Potential loss: ~5.56%)
💬 Conclusion
ARBUSDT looks poised for a recovery after bottoming out near a strong multi-week support region. The break of the falling trendline and transition above the Supertrend resistance enhances the bullish outlook. A breakout above 0.3015 could lead to a push toward the 0.3399 resistance.
Note: If momentum builds above 0.3399, we may even see extension targets around 0.36–0.38 in the coming sessions. However, for now, staying disciplined within the trade plan ensures better risk control.