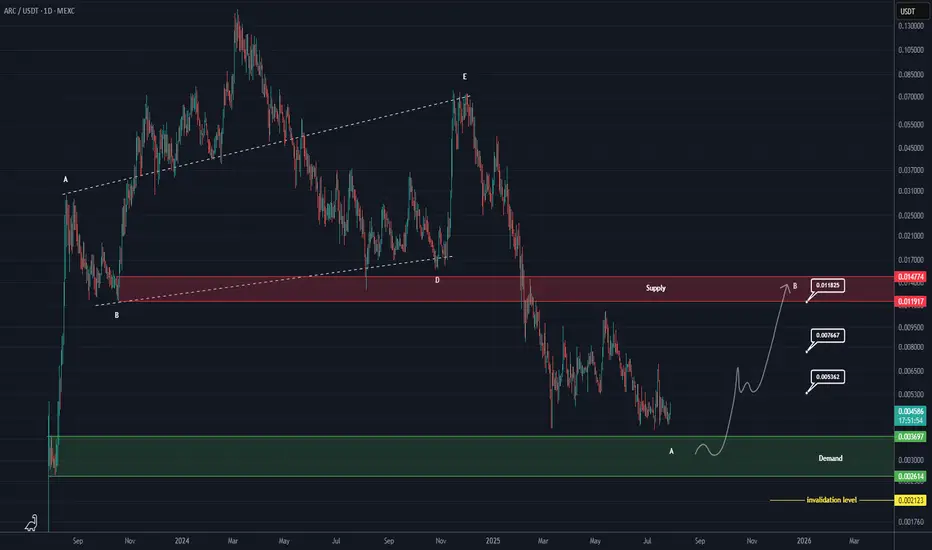
ARC Buy/Lonf Setup (1D)The ARC symbol, after completing a triangle and undergoing significant price and time correction, is approaching a strong and important origin.
It is expected that upon reaching the green zone, it will move toward the specified targets.
Since trading this symbol carries its own risks, make sure to practice proper risk management.
The targets are marked on the chart.
A daily candle closing below the invalidation level will invalidate this analysis.
For risk management, please don't forget stop loss and capital management
When we reach the first target, save some profit and then change the stop to entry
Comment if you have any questions
Thank You
Arcbtc
ARCUSDT - Bullish Breakout Confirmed ARC has been trading in a well-defined descending channel for several weeks, forming a consistent downtrend. However, the price has now broken out of the channel resistance, signaling a potential bullish reversal.
Descending Channel Breakout: ARC has clearly broken above the channel’s upper trendline, indicating a shift in market structure from bearish to bullish.
Resistance Zone Flipped: The price broke through a recent horizontal resistance zone.
EMA: ARC is now trading above both the 50 EMA and 100 EMA,
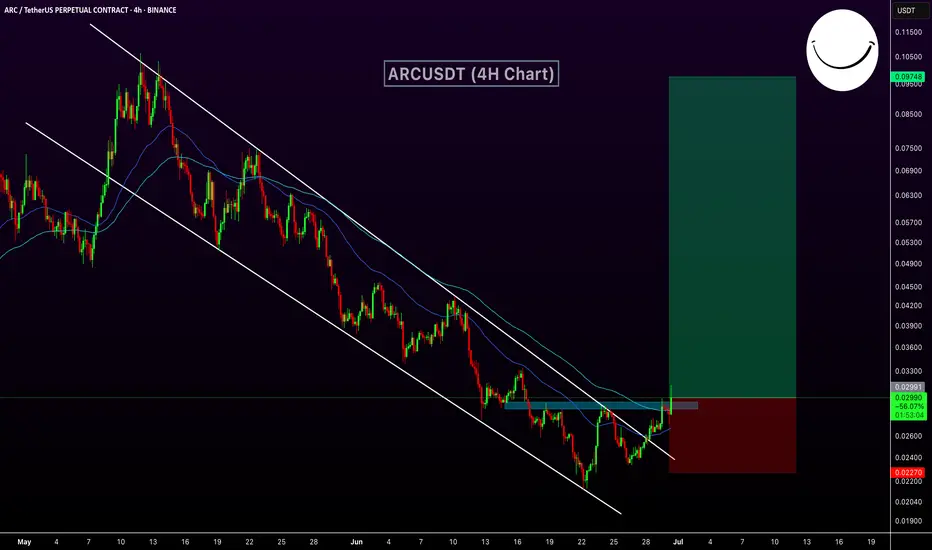
ARC analysis (4H)From the point where we placed the red arrow on the chart, it seems that ARC's correction has begun.
Based on the correction, a 3D pattern appears to be forming, with the third drive potentially completing in the green zone, where we can look for buy/long positions.
In this area, upon receiving a trigger, sell/short positions can also be considered.
For risk management, please don't forget stop loss and capital management
Comment if you have any questions
Thank You
