crypto harm reduction plan (trade boomer commodities instead)hi, hope all is well and you are all taking care of yourself
*boomer rant incoming*
the crypto market is the worst of all corners of the internet and finance. a bloodthirsty chimera of all our traps and shortcomings on the designer steroids of tech. "the crypto space" is designed to make you miserable, alone, addicted, ashamed...in a state of mind that makes you more susceptible to the loss chasing it's manipulated to push you into. bleeding out your already serotonin and dopamine-starved brain, and making you feel like you have something to prove the deeper you go. to yourself, to your ideals, to your desperation over the financial system and debt-based USD hegemony. farming misery to steal yr coins. don't fall for it. you are fearfully and wonderfully made. position yourself to succeed. everyone says to take breaks but we all know how hard that is with a 24/7 market when we can't live a minute without our phones anyway
/boomer rant (and possible crypto bottom signal, i know ;-) actually still thinking crypto will bounce soon)
the good news is i've had much more success trading this gold range and i feel much better mentally, physically, and spiritually
market closes an hour a day and on the weekends, highly recommend. (absolutely medical advice)
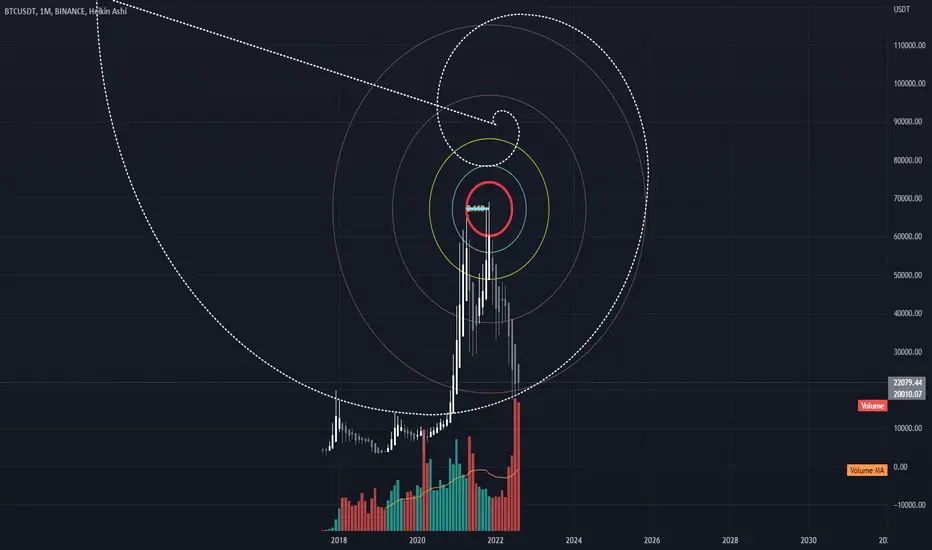
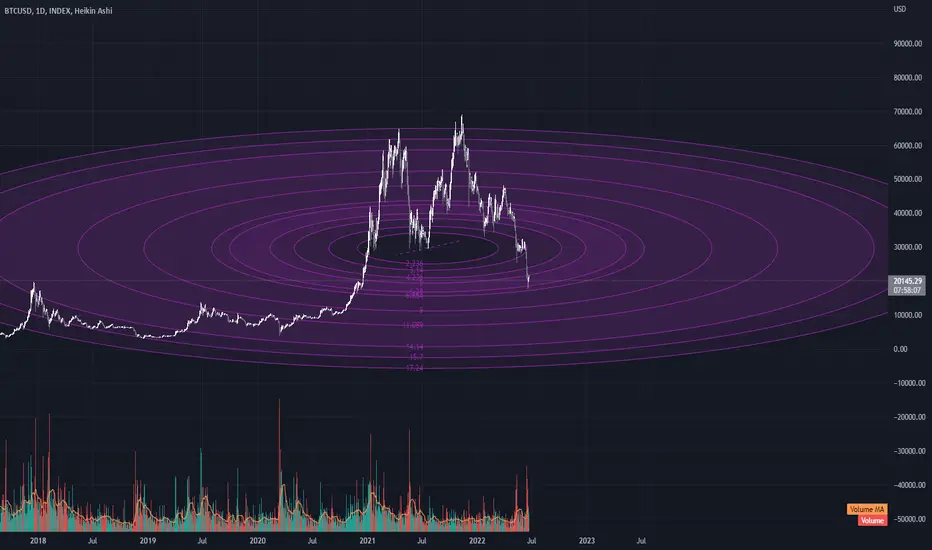
(fib spirals made from double bottoms as per usual, different orientations visually fit til one emerges victorious as s&r...important to remember they are just s&r's. they are just curved trendlines with acceleration and decay, they can break and they are not 100% precise...always manage risk. and lock your scale. mine is 1:1 here, and lately i've been trying to use multiples or factors of 10 (10, 100, 0.1, 0.01) depending on what looks best with the timeframe)
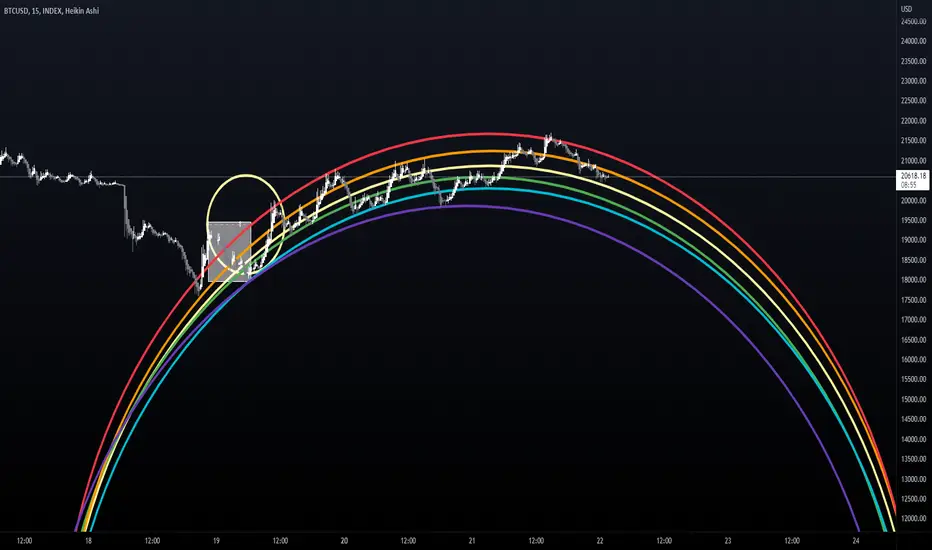
not sure when/where the range would top out, just been trading it smallest possible positions for now. rewiring my brain. if ihs plays out looking at 1920-1930, which would also jibe with the highest resistance spiral. still working out timefibs
sacredtraders.com
sacredtraders.com
both have amazing free vids on youtube, jenkins' www.youtube.com is really all you need, watch at 0.5x speed over and over again
take care, and always remember money aint shit. It's all God's anyway
Arcs, Circles And Spirals

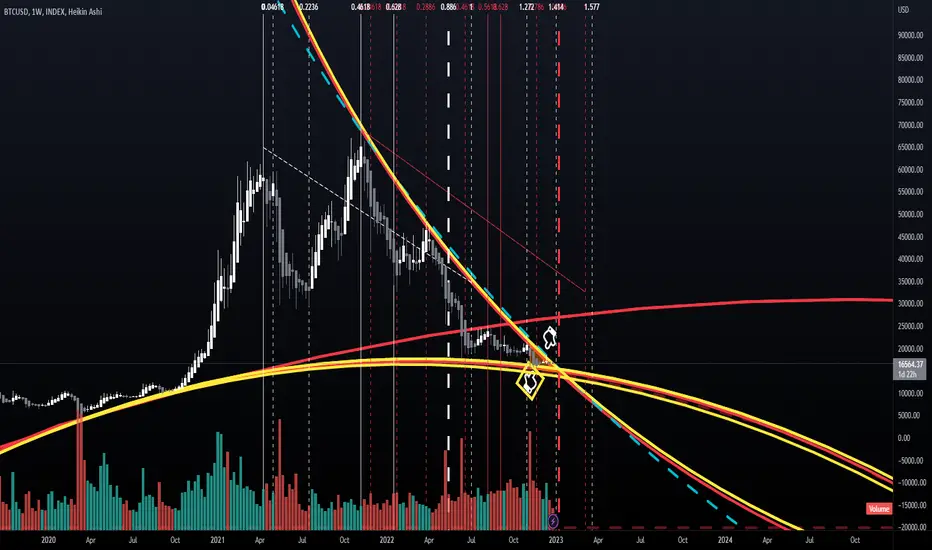
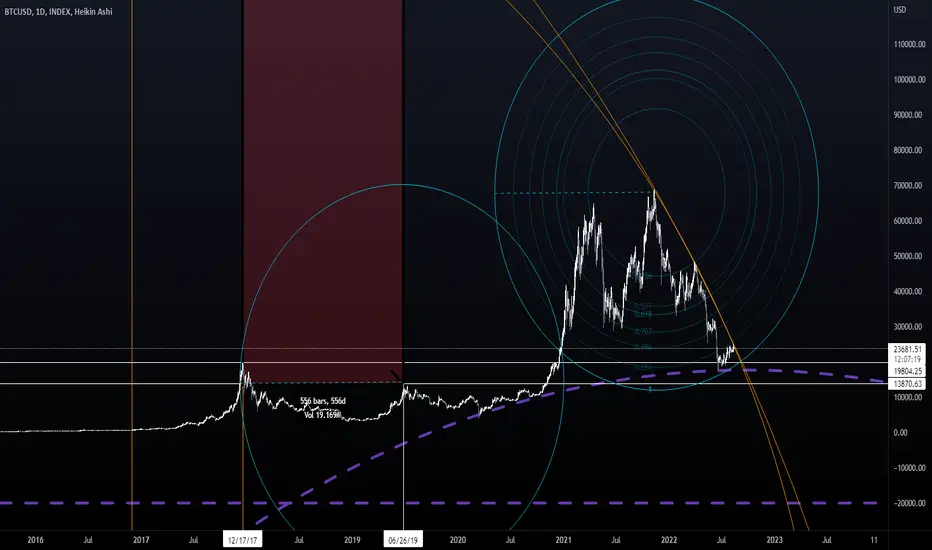
seek and you will findmore assured version of this idea with timefibs
spirals made from 2021 tops then visually fit and triangle highlighted, getting tight
timefibs made from converting price to time (a la the guru you should be watching yesterday michael s jenkins - www.youtube.com)
aka $64k top = 64 weeks from that top
& 69 weeks from $69k top
watching this as a resistance, kinda embarrassed to be bearish here tbh but i'm loyal to my htf spirals wutamagonnado
mostly trading metals these days bc crypto is toxic, and yes i'm aware that sentiment may be a bottom signal lol. personally love a market that closes and so will you
far be it from me to call the bottom of this lil scalliwag but currently side-eyeing 14.8 if we go lower. maybe a wick?
stay safe out there, and do one thing today to take care of yourself
"He who loves money will not be satisfied with money, nor he who loves wealth with his income; this also is vanity."
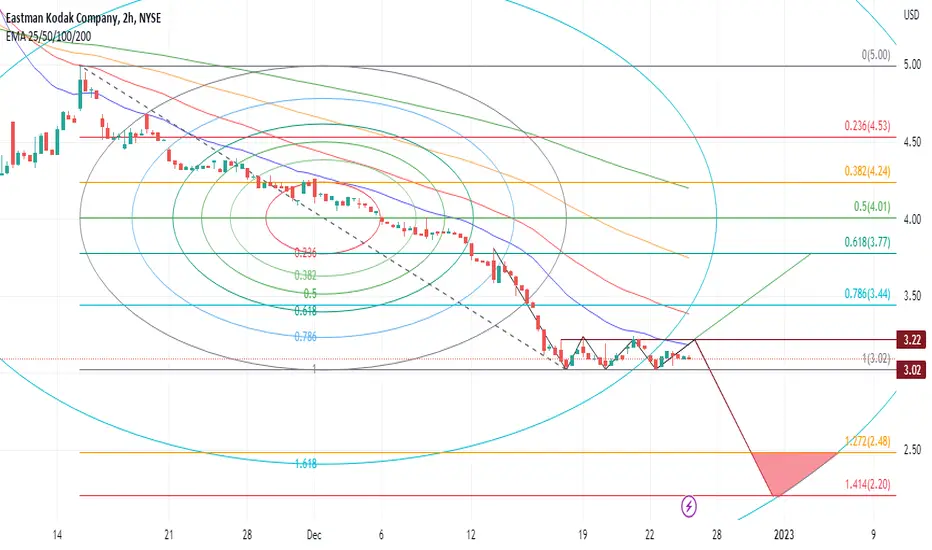
A Further 25% Loss or a 20% Gain for KODK the Week Ahead?Following a severe bearish trend since mid-November that resulted in a 40% loss, Kodak share (KODK) is currently traded within a horizontal channel. Furthermore, KODK share is traded below the short and long term EMAs.
If KODK share breaks below the previous channel, as indicated by the Fibonacci circle and Fibonacci extensions, the red colored area between 2.48-2.22 could be a feasible target in the following days.
A break up above the channel, on the other hand, suggests that the three-bottoms pattern is still intact, and the 3.44-3.77 levels are the next targets.
Fib Circles show GME at $80!Been playing around with Fib circles on GME and if you mirror it to the original run, it'll knock at previous highs then come back to retest the top of the channel.
$80 by January then back to $30 range in spring-summer 2023.
Then MOASS end of 2023-2024.
Of course, it's a new tool I'm playing around with, but I personally will be considering selling at this range and waiting to see if it consolidates.
Let me know your thoughts

i say hAYYYyyyyyy what's goin ONNnnnnnfirst of all i hope everyone is okay out there <3...so many opportunities to make money in the markets and, more importantly imo, out of them
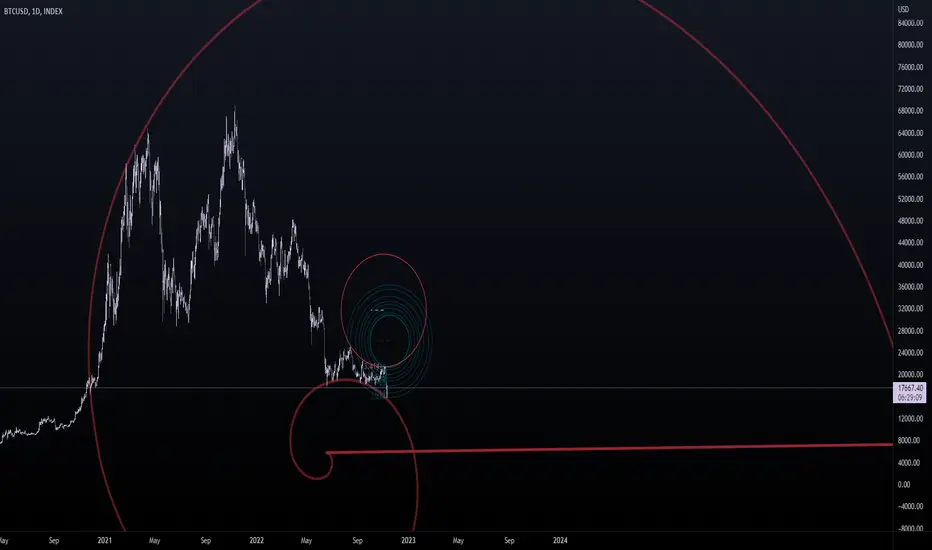
time between tops in '21 was 210 days aka 30 weeks
spiral is radius of 210, circle is 30 (with growth multiple of 3.414 applied)
(you have to play with scale and with the diff tfs/time cycle measurements)
markets are fractal, recursive, harmonic....etc etc etc and this can be expressed geometrically/visually. i think of price action/charts as a purely energetic organism growing
still haven't figured out why 3.414 is so important tho lol (self-similar reproduction aka 1+1+square root 2?)
also formed a bullish butterfly inside a massive bullish shark/cypher...still bullish tho i didn't think it would go this low...but now maybe we are ready for that bounce i've been talking about ;-)
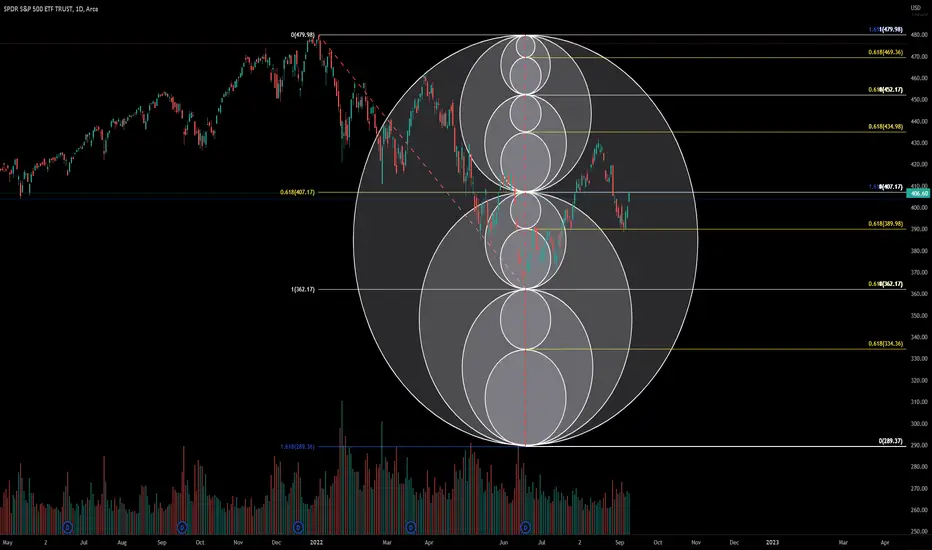
Innercircle Trading with FibsA daily chart with one major fib from the most recent extreme high down to the most recent extreme low.
We then break down the main levels further with the fibs that come in between the major levels.
The circles are there to give a visualization of how important each level is compared to the others.
The circles also go to show that it's all apart of the same set.
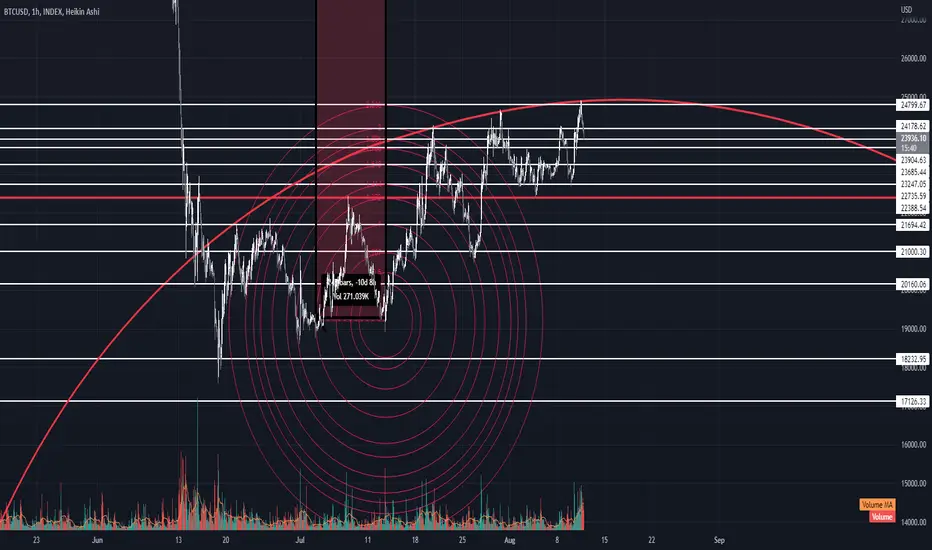
uhhhh point out the bounce (jay-z voice)just some phibonacci tingz
price is now at 6.854 of time (chart scaled 1000:1)
it consolidated at 4.236 area before kittycat earlier this year (where it bounced up to the 2.618...can you feel the phi??)
volume nice, we are in cypher completion zone, spiral w/radius between 2017 tops moved to visual fit (curling up with verticals calling time reversals?)....lotta confluence. plus indicators oversold if you're into that sorta thing
she goin up soon (i don't think lower than 17-18k double bottom but don't quote me on that)
(unless that lil bounce to 25k was it??? not financially advise and i would be very sad)
<3 enjoy the last few days of summer
(see michael s jenkins on youtube for some great vids on price=time and why geometry works)
and listen to this song (jay z - the bounce)
6.854 sphiralyou have to expand/pinch the scale to snap the shapes back to where they're supposed to be (shoutout to my fav @TradingView glitch)
time = price
orange are clockwise and counterclockwise spirals made from radius x 6.854 (vertical from center) of OG circle. can the clockwise and counterclockwise convergence of 1.618 ^ 4 really be random? even if algos are just using the same coloring book...
copied and pasted OG circle and added levels so you can see the harmonics within the trend, but i'm really posting this to keep track of the orange spiral...arcs also fit but too many notes
i'm thinking spirals of diff harmonic radii call micro reversal points within the larger trend, showing cycles within cycles and cycle confluence. maybe someday i'll do them all on one chart LOL
blessed are the meek, for they shall inherit the earth (matthew 5:5)
price=time (NOTE: this looks wrong til u expand scale on right)YOU HAVE TO EXPAND THE SCALE ON THE RIGHT TO MAKE THE CHART/RESISTANCE LOOK THE WAY IT'S SUPPOSED TO...@Tradingview continues to be weird with spirals/circles...they shift from where they are when i publish the chart, when i post the chart...when you play with the scale, expand and/or pinch, the shapes should automatically revert to where i drew them, with my locked scale)
anyway...have you met the 2.236? aka the square root of 5? it's kind of a big deallll
spiral is time between those bottoms and fit visually
(vertical lines tangent to spiral seem to call reversal points but that's another story for another time..."too many notes" )
bounced off 6.854 (1.618 ^ 4) spiral of time between macro tops, see update on this idea
a map scribbled on a napkini forget which bottoms/tops i made the spiral from...i think it's just 1 ratio but at some predetermined angle but i really can't remember lol
but those are the same spiral from reversal points, copied and pasted...not random
a break and dump = shark confluence
trade responsibly, get some sleep

germinatrixbroke the clockwise resistance but i just realized it bounced off the counterclockwise resistance
(all same spiral from prior tops, visually fit to more recent tops/bottoms...imo not drawing random lines on charts...just a visual/geometric expression of recursion & history rhyming...moving shapes around/applying growth multiples...position means something in pricetime - position of observer as well)
foundation
hope everyone is enjoying the summer and some good company
stay safe out there
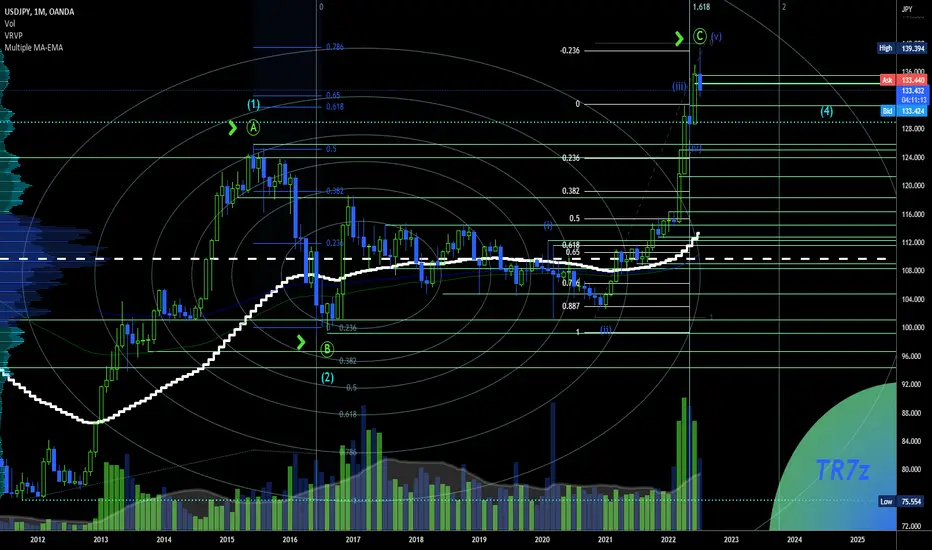
USD/JPY - Support and Resistances from the low to the high a EWhey guys,
if the amount of strokes bothers you just zoom in. I think it's more helpful for swing traders.
The forex pair made its low in Q3 2011 at 75,554. 👍
Since then, she has been able to establish a long-term upward trend again.👌
The intermediate high wave 1 or (A) stopped at 125,879 and formed an Adam and Eve pattern after we had a recent push to the current ATH at 139,394.
EW technically quite a bit is possible, but first let's look at the time periods
The Fib Cycle shows that the POC was breached at 0.786 and the last upward thrust began at 0.886
According to the trend-based fixed time, the IMO current high from low to A to B is an almost exact hit with 1,618 👌❕
The 0.786 Fib Extension also meets the high, Fib Retracement Wave C, current high as well 1. Target zones for Wave C drawing a nice monthly Doji on Monday ✔
The 5 waves would also be an option, but according to the textbook, 2 impulse waves seem more consistent to me
But you never know how long the Fed will play its games with small investors. In other words, they reacted far too late to permanent inflation
The street must be protected 😉
I would like to mention that all I post are just options and my own opinion!
Always trade with SL, and do not risk more than 1% of your portfolio (max 3%) per trade.
If you have any questions, let me know
➡️ If you like my posts, smash the like 👍👍 button, comment or follow me. ⬅️
Thanks for reading my ideas,
Trade save !!
🤑 ⚱ 💸 💲
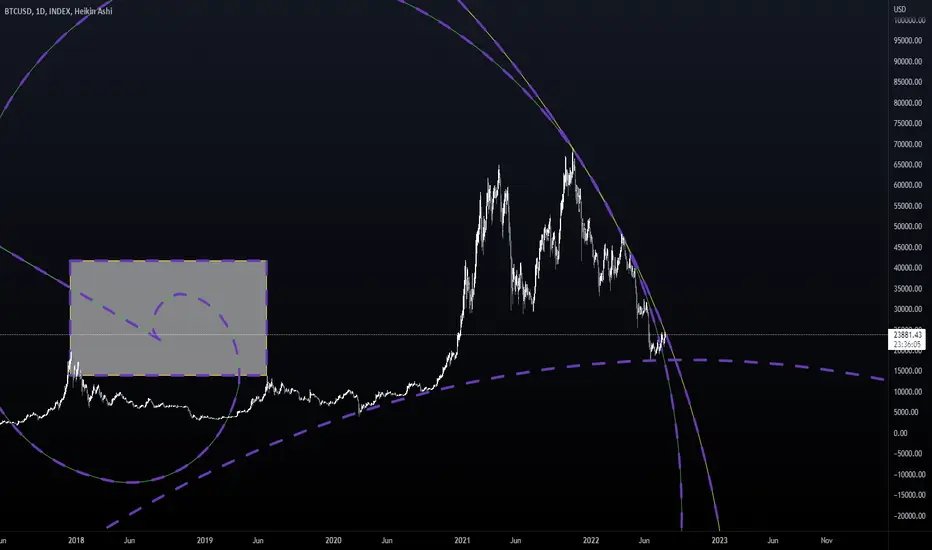
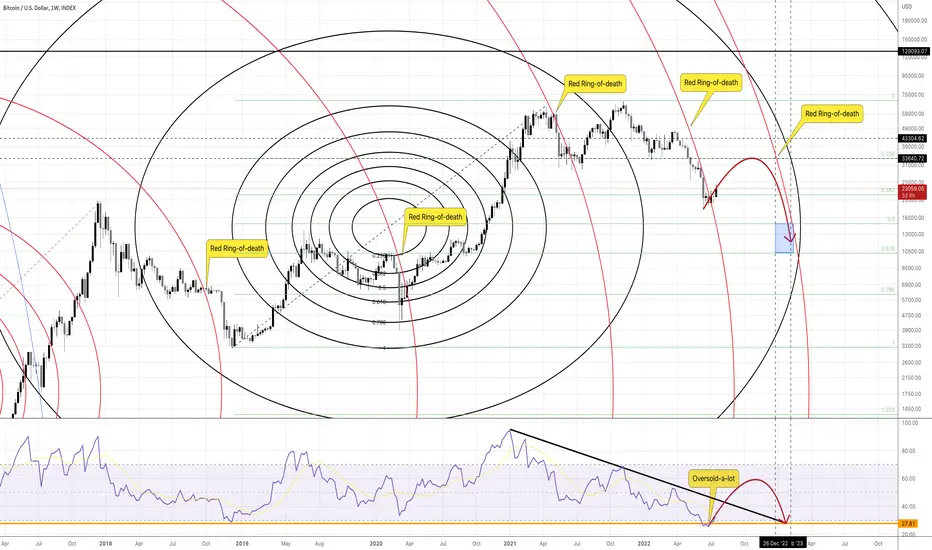
Bitcoin 2nd bottom dec '22 / jan '23This scenario is inspired by previous encounters with the 'red ring of death'.
Combined with the fact that historically BTC made double bottoms (2nd bottom always a bit higher than the 1st one).
RSI wise it wouldn't surprise me neither as these setups are made quite often.
It's not improbable.
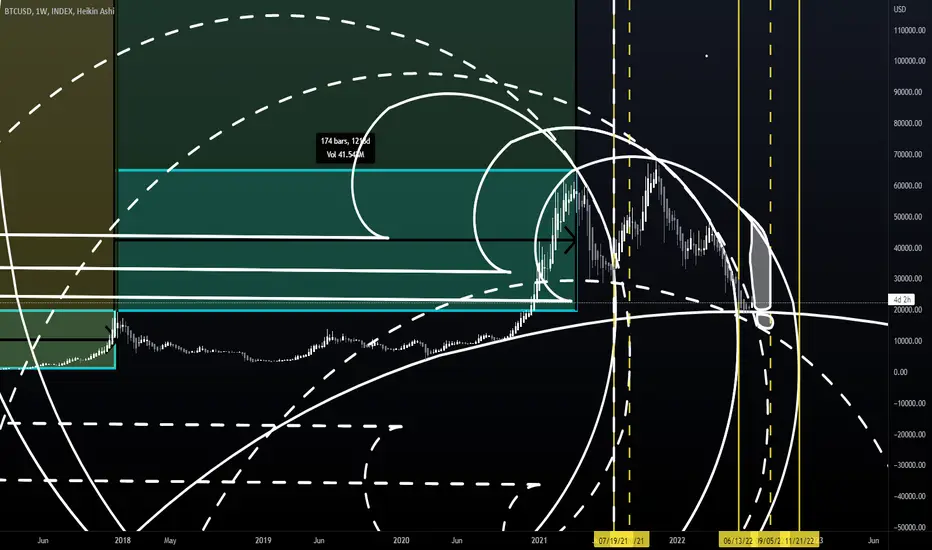
bitty time spiralsspiral of time between 12/2013-12/2017 tops, all same spiral, solid = clockwise & dashed = counterclockwise
fit to tops and bottoms, vertical lines tangent = reversal dates?
scale = 1000:1
resistance, and price crossing outside of it indicating trend reversal (aka price moving outside the trend indicated by the boundary of the shape), seems legit but i'm really not sure of support...which placement will it respect? the lines are magnets just like regular fibs/fans/trendlines
God help you if you take this to be financial advice, still pondering all this and also minor changes in placement/creation can have a huge effect on a scale this size
stay safe and hydrated out there...enjoy the summer! bring bitty to the beach if you have to <3

quick sketch of psychopathythe only way bitty can feel anything anymore is by messing with us...i would not be surprised if she does that here between the ihs arc neckline (2pi arc between recent tops, see previous chart) and the ihs LINE neckline...a retest if you will
(convinced the space between square/line and circle/arc has some meaning on these charts (which are just maps of emotion, something the geo gurus have gotten me thinking about lately)...ideal/avg vs real or something)
gut says double bottom range around here (slightly lower low like 16kish wouldn't bother me) for a few more months...but extra NFA. i'm basing that on my crab rockefeller idea (spirals geo noob stuff)
stay safe out there
fresh air, sunshine, move your body, tell your family and friends how lucky you are to have ppl who love you in spite of (because of?) your degeneracy
i'm not letting bitty hijack my summer!
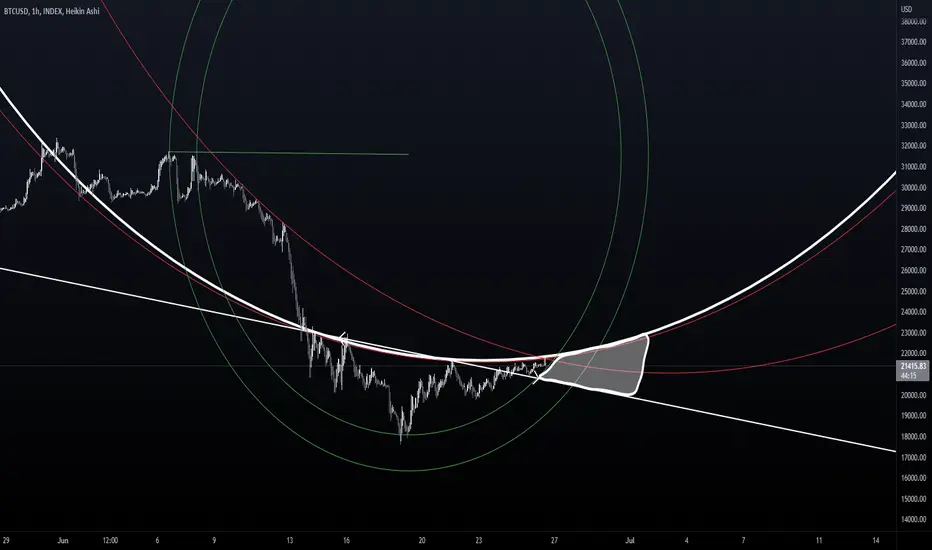
flirting at the neckline (bullas tp)lotta bear confluence here...which is my local bias. i do think recent low was a longer-term bottom we will range at for a lil while but nfa...
resistance is 2pi arc of the smaller circle you see (radius = between those two tops)
bearshark zone as well (included some bull harmonic possibilities)
ihs neckline
ihs and hs "fakeouts" are actually just PA following a curved neckline imo (just like irl :-) ) ...trendlines are not straight
NFA...expect the unexpected! a break here would be bullish to mid-twenties imo (w/successful retest)...lots of alts looking juicy if that happens

spirals are special snowflakes (wen 3D polar)these are all root 5 spirals (of the original circle...meaning the segment i'm creating them from is 2.236 times the radius of the original circle)
not only does final placement and direction of rotation (clockwise or counterclockwise) matter, but the positioning of the original segment matters. for example all of these spirals have the same radius but they look wildly different because of the original angle of the segment i'm deriving them from. (remember from geometry class that every point on a circle is equidistant from the center - that's the beauty of circles)
perhaps something meaningful in drawing them at 0, 90, 180, and 270 degrees as the limits of differences in direction
ultimately i think the spirals can help visualize the chart in 3d...as an axis or line of sight
(i spent way too long yesterday drawing circles with my finger in midair, in different directions and moving my head/perspective to try to understand sine waves...then thinking about what this all means for cycles)

pi in the skyfib "circles" made from tops & moved to big 2021 summer bottom
phi & pi and harmonics, square roots, integers
multiplying/dividing by 10 as well...wonder if that's independent of scale (would make sense if your scale is 10:1 or 100:1 or whatever)
i generally use 100:1 on the daily and 1000:1 on the weekly for leftbrain reasons but always wondering if the secret sauce is just finding the right scale on the right TF (427:1 or 232348971.34738920:100 or something...looking at the chart thru the cycle as a lens to find points of resonance...frequency...harmony...i think this is what Gann means by squaring the chart but i have not read him yet)
fresh air and sunshine maxi this week
happy pride monthbrought to you by the 11.089 fib harmonic
(last chart should have been one more fib level up from the 6.854 (meaning 1.618 x 6.854))
not sure where the pot of gold is
i sent this to my financial advisor and he blocked me :-(jk, but not financial advice obviously...just sketching and learning and talking to myself as per usual
1. visually square chart to a move (i chose the correction you see the square around)...i just realized you can do this by drawing a circle (fibonacci arc, click full circle) with radius time (totally horizontally) and another with radius price (totally vertically) - not diagonally ... the absolute change in time and change in price of the move -then pinching/expanding the y axis til the circles look the same/disappear into each other. (start them from the same place) LOCK YOUR CHART
2. copy and paste that circle and do different multiples and fit visually...this is the 6.854 (1.618 x 1.618 x 1.618 x 1.618) . try other fib multiples/square roots/whatever you fancy (pi, euler, regular ol numbers)
3. confluence = cycles in alignment
one thing i have to be careful with is thinking these are prescriptive...these are the same as any support/resistance/trendlines. can break and retest. but they are similarly magnetic where price will tend toward them
short term bear bias here because it's in bear harmonic zone - antishark/anticypher
learning:
michael s jenkins
bradley f cowan

the devil is in the details (lines tangent to circles)my last idea was playing with price action dancing along the arcs of the circles created from time and its multiples and placed to recent bottoms
here i'm looking at drawing horizontal lines tangent to the circles...aka at the bottom-most point of the circle aka where a move of the same "distance" (considering price chart as a unitless chart, like a math problem) has the lowest price aka the limit
and drew the lines much thinner bc vision is the price we pay for precision (idk why the lines look tangent until i publish, then there's an offset? @TradingView?)
here we are at the 4.236 or 4.618ish which as the TV default fib settings will tell you are important levels (1.618 ^ 3 or that plus .382)
ongoing questions:
1. arcs vs horizontal tangents vs sloped tangents, or some combination of these, each having a specific meaning (what are these meanings)
2. placement: best-fit? first two bottoms? two most recent bottoms? first and last bottoms?
3. time projection using same method (but from price instead of time)...do the same circles/vertical tangent lines call time of reversals? i'm guessing different circles, unless you find the random scale that works for both, aka not like here where i've been doing whatever neat multiple or factor of 10 looks best (1:100, 1:1000, 1:0.1 etc) because that is easiest to conceptualize with leftbrain...it would be whatever scale makes the move look the most square. this would vary according to TF as well. this is what i mean when i say pricetime but i'm guessing this would be messy and not constant (perhaps being affected by position of observer aka scale, like a camera flying around a chart)...like a funhouse mirror
wen class on perspective drawing
michael s jenkins
bradley f cowan
shapes = leading indicator
don't hate; hydrate

accidental wormhole cleanupadded some levels and tweaked placement, these belong at the first two of three bottoms
not sure where bottom will be or if we'll even go down more...2.718 (euler's number) is important supposedly (i think of it as inverse phi..phi is infinite outward growth and euler is infinite inward growth) and we're there now...but we wicked to the 4.236 so maybe that?
just think of these as curved pitchfans, i think
see for process/tutorial
use stop loss, get outside, be nice to each other
