US Indices Weekly Analysis | Sept 27, 2021S&P500 along with the rest of the US indices have recovered from the sell-off last week. Some indices have fair better than others. Can the recovery continue? or this is just a dead cat bounce?
ARKK

Reverse Repos - ATH - KarmaGeddeon Bid Expands to $1.35 TrillionNon-Financial rated Debt, Corporate Debt will begin to roll over as GDP Forecasts,
although no longer provided... does not matter, the Global Economy is once again
on the Steep Decline.
Supply Chain Issues compound monthly, with no end in sight.
The answer is, Buy STONKS, they are the New, New, New, and Improved Liquidity Economy.
Stocks are the Economy for most Americans. GDP is resolved with Gains in Zombie Companies
buying Trillions of their own shares.
1.6 Million Options were swapped for Tesla Friday, 52% Calls.
The Gamma Squeeze for protected entities is in trade.
Yeah, Naw, we'll pass for now, wait for the Pullback into the Final Stage of this Historic
Bull Market.
Commodities are pitching a large Bis as the Safety Trade is back in force.
There will be a final Blow Off Higher into 2022 as Debt Markets join the idiocy until
it all simply implodes.
2022 is going to be a very difficult year for most.
Perpetual Bonds are assured, the reset there will require a degree of patience while the
"Distribution Phase" requires time.
Insider selling remains robust, Retails are going All-in on the YOLO.
Meme's will begin to roll over and collapse into the next Sell, which is ahead.
We will see how long they can continue this Distribution .
Margin Debt remains elevated at Highs.
INever forget Crammer issuing Buys in March of the DotCom peak for the most bloated
overvalued JUNK Stocks which promptly collapsed from $600 to $0.
2022... one for the Books after 5/5 completes.

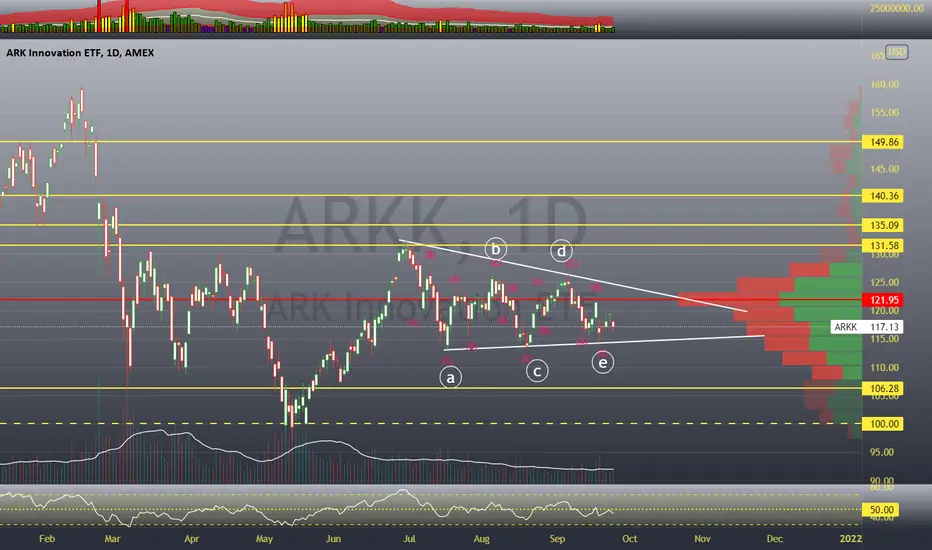
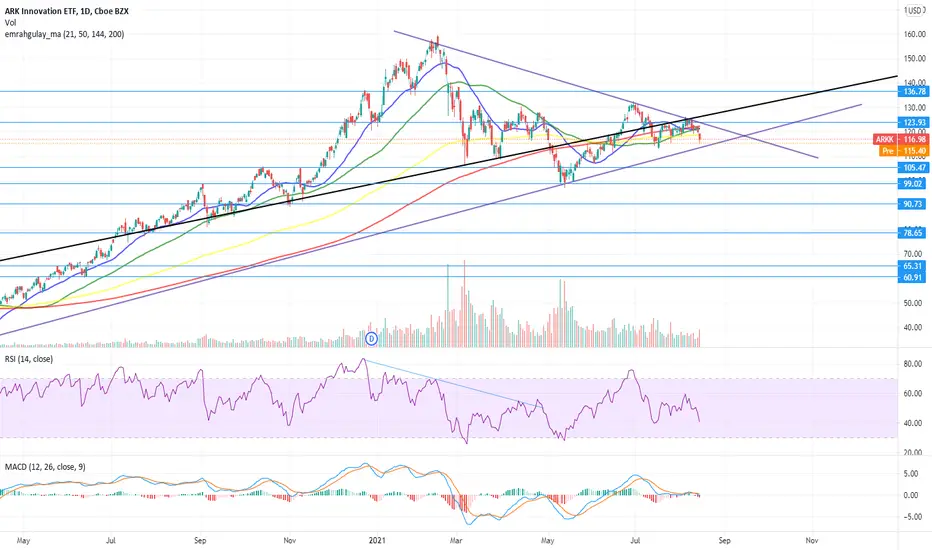
ARKKARKK looks on daily, symmetrical triangle looks textbook. The break of the triangle would also resume in a volume breakout as we can see with the volume profile ! Dont miss that one !

AMZN looking perfect from a technical perspectiveToday we will talk about the AMZN setup we have currently pending. Most of the time, we never have more than three setups executed at the same time. One of those is Amazon; after the breakout of the massive range, we observed a Flag Pattern on the edge of it, which is a sequence that has been repeated with different variations across the history of the asset.
Why is this relevant? Because our primary approach when executing any setup is: "Can I demonstrate that what I'm trying to trade right now have been proven to have a statistical advantage on the past? If the answer Is yes, we proceed. Based on our research, this setup represents a pattern with an excellent statistical edge overall.
Does it mean that the following setup will be a profitable one? Nobody knows; it's impossible to determine which "game" or "sequence" of the system will be a take profit or a stop loss. However, we know that after 15 or 30 setups with this quality, we can create a statistical advantage, or in other words, "Profits."
Returning to the chart, the strategy we are using here is pretty simple. We will execute our setup above "B," or the inner local resistance of the flag pattern. Stop loss will be below the structure. Take Profit will be on the fibo extension of the previous impulse ( MAR 2020 - SEP 2020)
Risk: We will be taking a maximum loss of 1.5% of our trading capital.
A movement like this can take between 100 to 150 days. (Be patient)
Thanks for reading!

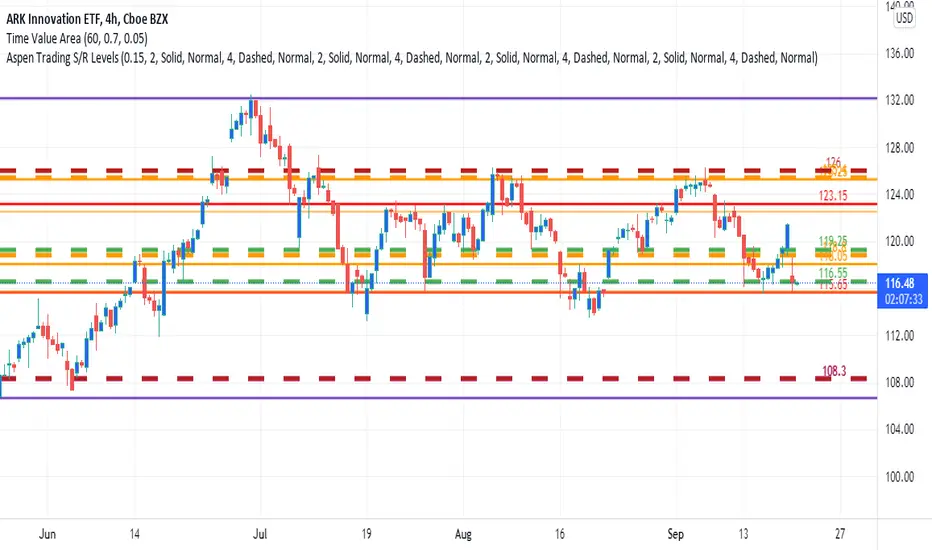
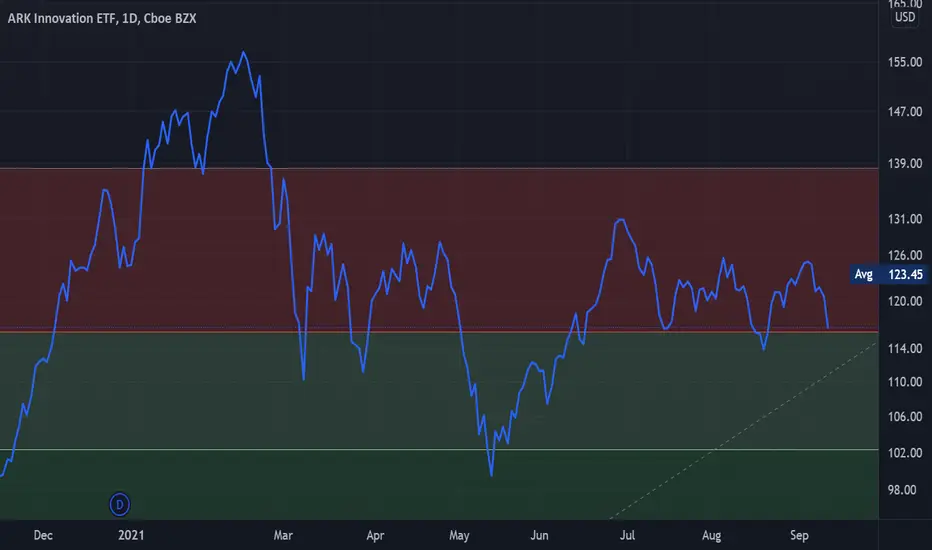
$ARKK Consolidation StraddleArk is strongly respecting these lines looking to see if it wants to break down or consolidate further.

ARKK: Not Taking On Water....YetThese levels have created a pretty impressive price channel. At some point this will give way though.....~115.62 holds the key for the bulls who have been waiting for this ETF to catch fire. I suspect they might be disappointed.
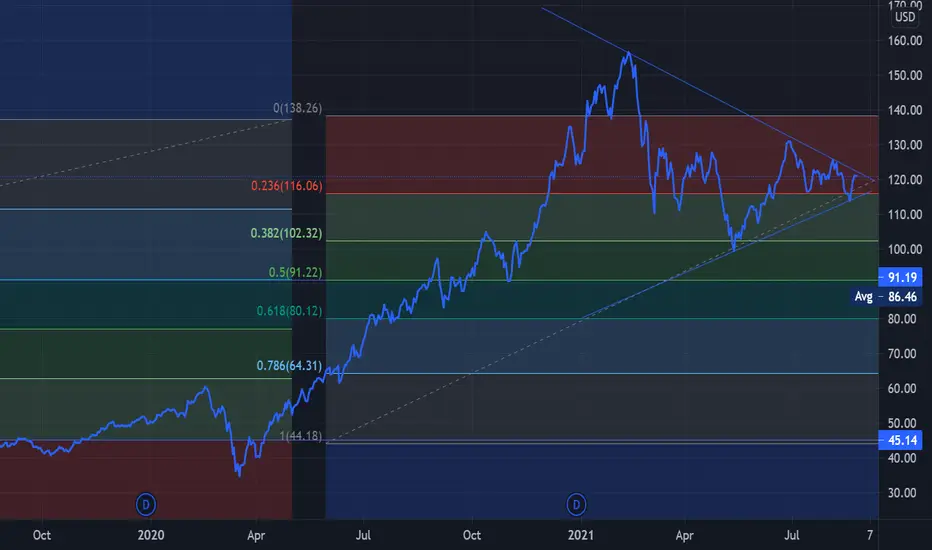
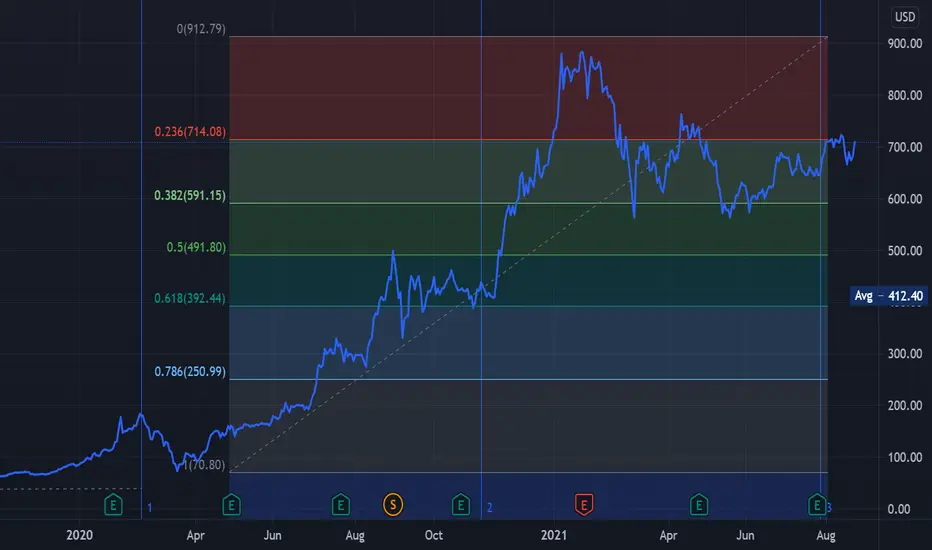
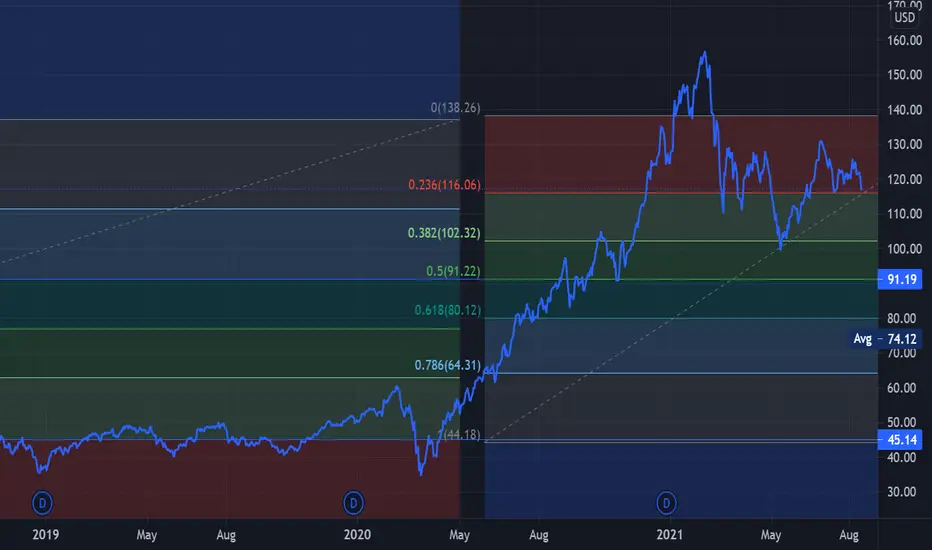
Ark Innovation ETF - ARKK - Technical outlook is bright?Ark Innovation ETF - ARKK - Technical outlook is bright? Found support in he 61.8 % fibonacci level. Technical longterm price target $160? We will see?
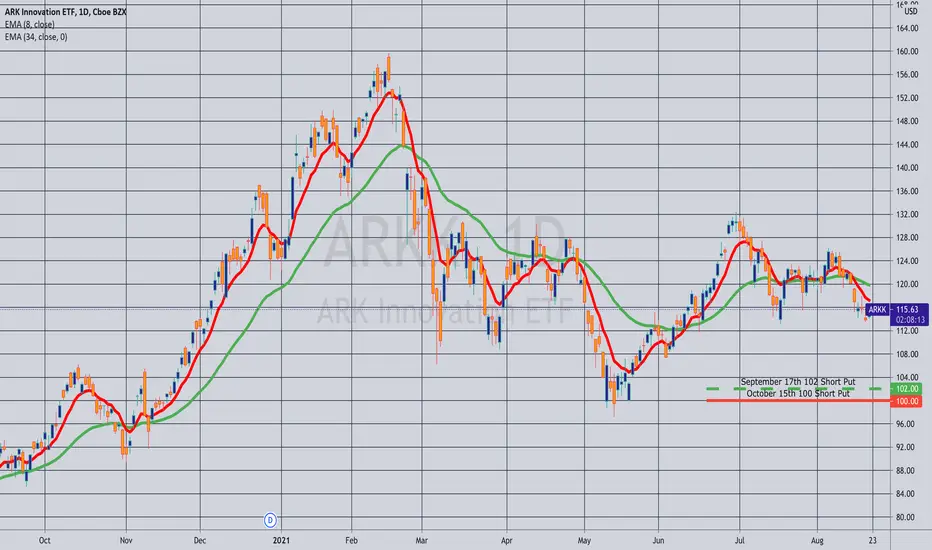
Opening (IRA): ARKK November 19th 100 Short Put... for 2.09/contract.
Comments: With 30-day implied at 40% or so, adding in some November here.

ARKK - The convenant of the DunceWoods is a shyster... a Carnie New Age TECH Guru.
Pumping is an automatic SELL.
Hugging our ARKK PUTS.
ARKK - Woods MEMEOh no, oh no, oh no no no no no...
Nothing much left to add.
Woods a Circus Carnie.
Gamma Failure EOW.
- HK
Rolling (IRA): ARKK Oct 15th 100 Short Put to Nov 19th 104... for a 1.50/contract credit.
Comments: With the 100's at greater than 50% max (they're worth .84 here), rolling out to the November monthly for a realized gain and a credit. The implied isn't as good as it was, but is still >35%; otherwise, I'd just leave it alone or take profit and move on. Relatedly, since the implied isn't fantastically great, keeping my units the same instead of adding, keeping buying power free for a higher volatility environment.
Total credits collected of 3.52 (See Post Below) + 1.50 = 5.02 versus a current short put value of 2.38, so I've realized profits of 5.02 - 2.38 = 2.64 ($264)/contract so far.

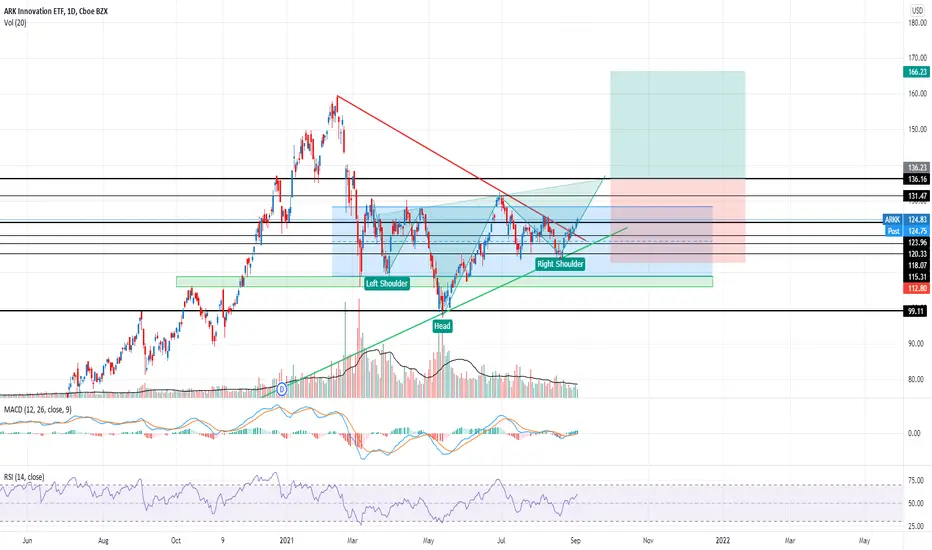
ARKK close to completing inverted H&S formationDaily chary: Entry point as the candle closes above the neckline at $136.23.
Stop loss: $112.80
Take profit: $166.23
Risk/Reward Ratio: 1.28
Same pattern shows on the weekly chart. You could enter slightly earlier at $130 if you consider the main body of the head's candle instead of the top wick.
Pattern negated if price drops outside of it.
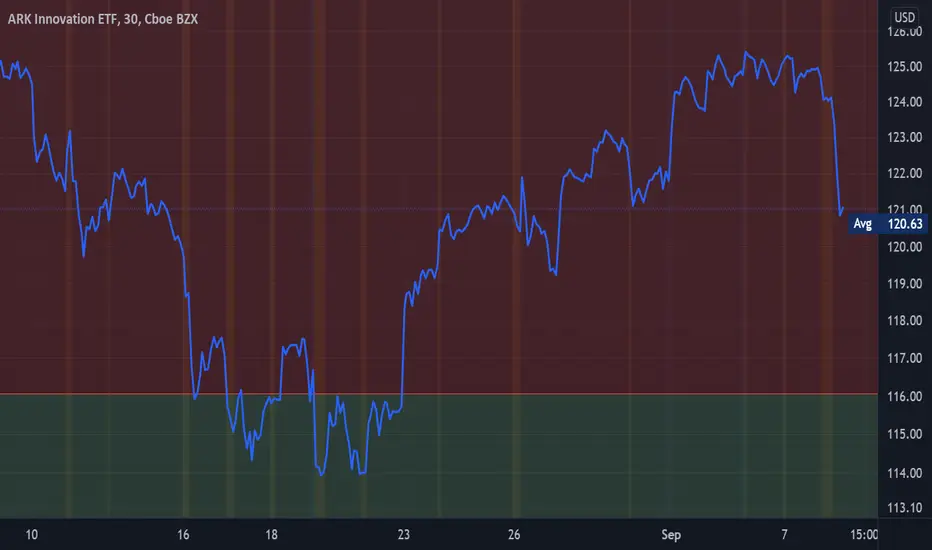
ARKK descending triangleNice descending triangle,
My pivot price point is 122.50
A break of that level could open 126 and 130

$PLTR: Have we finally found our inflection point? (Do or Die)ARKK making a strong name for itself after the Jackson Hole meeting. Are we nearing the breakout point or will we continue to see more waiting and what will ultimately happen with the ARKK index at this juncture? We will see! Good luck traders :)

ARKK - Jive Talking ONLY goes so farAdios Woodie we are SELLERS
20% Haircut dead ahead as the failed TSLA
GS will unwind this attempted New Age Guru
non-sense.
Woods is hanging on by a thread.
Position - 3.5K ~ 121.13
Last one out, please turn off the lights to 90s.
Buying up small cap spec garbage, priced to perfection...
Ends very badly.
xoxo - Hunter Killer
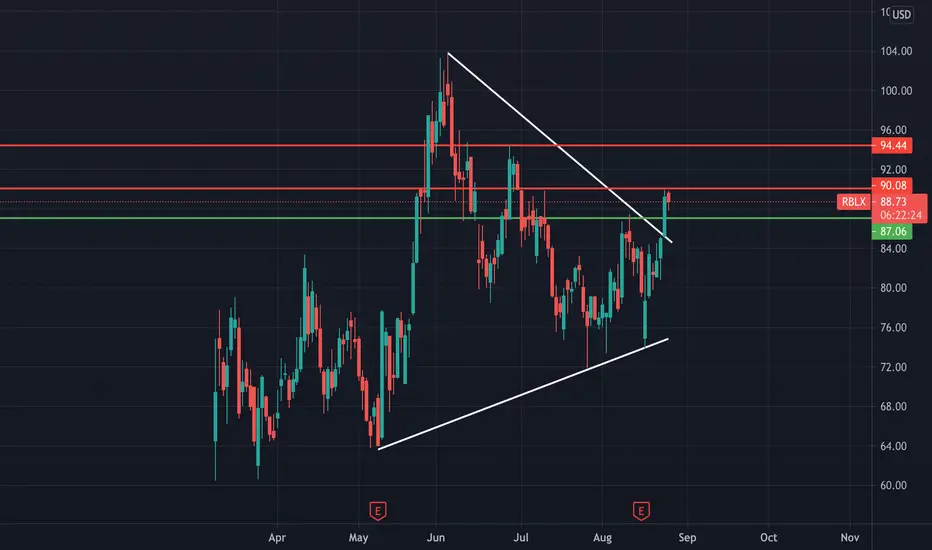
RBLX: Crucial point at $90Strong break of the flag on RBLX, yesterday price action was solid. A break of $90 and I think we could see a retest of previous highs around $94. $90 is crucial point to see if it could hold the trend or else rejection might happen. RBLX is one of Cathie's Wood favourite stock as well.
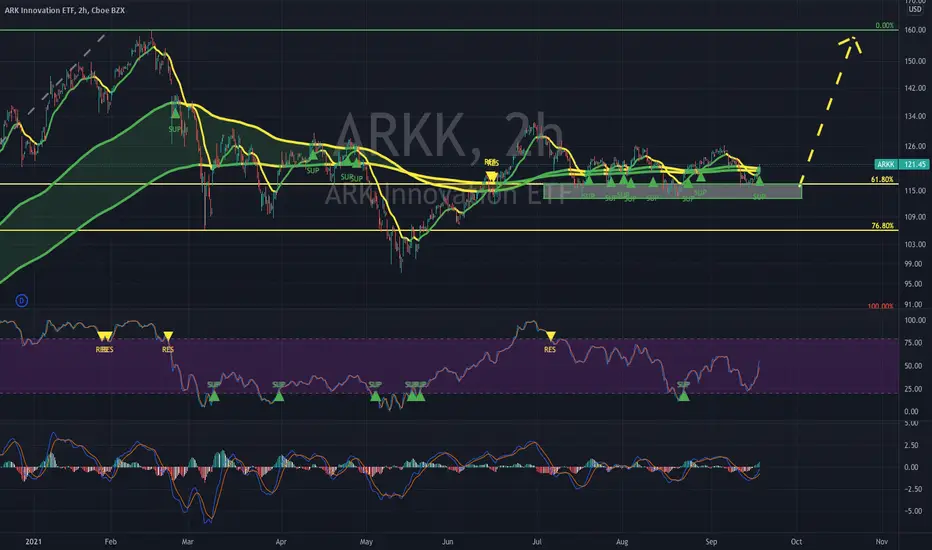
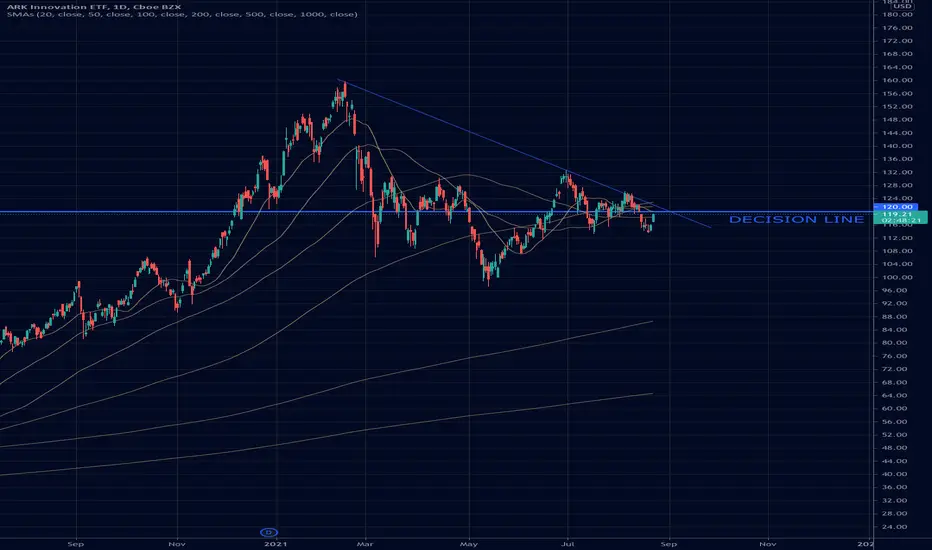
$ARKK: Cathie vs Burry, Which Side Will You Choose?The 120 level on ARKK continues to act as a very prominent level. What would you do?
ARKK 120 features a prominent low volume node and now we have a chance to meet this level with the falling trendline that starts from the Feb high to the June 2021 lower high. Together these forces will meet and ultimately decision in the coming weeks. I'll let time tell me which way I'll play this one but will the Russell 2000 be a canary in the coal mine or will it successfully squeeze bears like it's been known to do. You may also look to the Fed and forex markets to see how the dollars role may play apart. Good luck traders!
TSLA - Woodie Doubles down, Attempts to Call out BurryAnd fails miserably. Burry has outperformed the S&P by a factor of 10.112 X
Burry nailed the prior 2 Highs prior to meltdowns.
Burry is a Hedge Fund, Woods a Joke ETF.
Burry has been calling the Ball correctly for 20 Years.
Woods has been screwing the pooch of late with a track record
of 19 straight losses on entries.
Woods is well out of her league, by any metric - ARKK Gamblers
will see this JUNK Fund shed 20% with relative ease as CALLs only
go so far, desperate attempt by Woodie to prop up her very large
mistakes.
It will end very badly for Cathy as this reverses, the same tired
game once again.
We are SELLERs of ARKK @ 120.11.
The 750 Call buyer are back in play attempting their 5th Gamma
Squeeze on the Pivot of 679 and then 696.
We closed a small position in TSLA we bough to open @ 696 for 10 handles
@ 706 x 400.
We have a large sell ladder from 720 to 750....
- Hunter Killer
Rolling (IRA): ARKK September 17th 102 to October 15th 100... short put for a 1.08/contract credit.
Comments: With the 30-day implied remaining fairly decent at 43.2% and the September 17th 102's at around 50% max, rolling them down and out to the October 100's for a 1.08/contract credit here. I originally collected 2.44/contract for the 102's, (See Post Below), so have collected 2.44 + 1.08 = 3.52 versus a current short put value of 2.40/contract (i.e., I realize a gain of 1.12 ($112)/contract).
$ARKK - 3 weeks to make it or break itThere is a triangle formed, coming to a cross section in 3-4 weeks time. Either to pop-up or break down. Either way now is not the point to enter. We need to see a bounce back from bottom line and one more touch to upper line to confirm the triangle.
I bet on upper break through so if the above condition met, I will enter around 109s with a small portion
ARKK - 102s NextCathy Woods trading abilities are unparalleled.
Somehow she lost again... she's near perfect on rotation failures.
TSLA the most recent demonstration of FUD.
How on earth anyone buys this JUNK is comical.
ARKK had it's day, every DOGE does.
Adios ARKK, no covenants, just wracking up Management Fees.
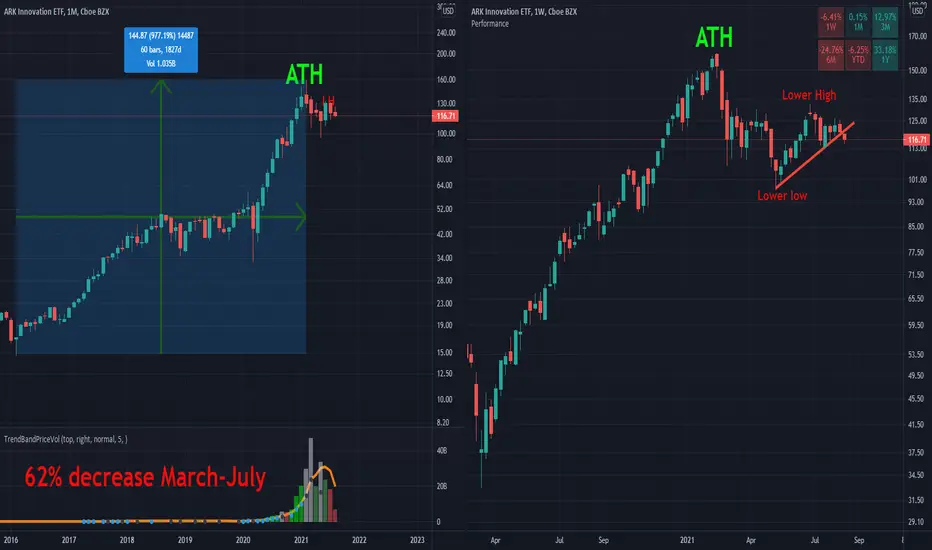
No one buys ARKK tales anymore..!1000% gain in the past 5 years! (Feb 2016-Feb 2021)
The monthly Price volume decreased 62% between March and July 2021.
ARKK builds bearish patterns in higher (weekly and monthly timeframe) and YTD performance is negative (-6.45%)..! This happened while all major indexes were positive!
A non-random walk hypothesis
Martin Weber, a leading researcher in behavioral finance, has performed many tests and studies on finding trends in the stock market. In one of his key studies, he observed the stock market for ten years. Throughout that period, he looked at the market prices for noticeable trends and found that stocks with high price increases in the first five years tended to become under-performers in the following five years. Weber and other believers in the non-random walk hypothesis cite this as a key contributor and contradictor to the random walk hypothesis.
Falsehood always preferred the tale to the truth— Sir Winston Churchill.
Reference Article:
www.jstor.org