ARKMUSDT Make or Break? Testing the Ultimate Historical Support!🧱 Critical Support Zone in Play
ARKM is currently trading around $0.470, sitting right on top of a major historical support zone ($0.400–$0.470) highlighted in yellow on the chart. This area previously served as a launchpad in late 2023, propelling price to an all-time high of $3.996.
Now, after a prolonged downtrend, the price is once again testing this same key level. The market's reaction here will likely define the next macro direction—will ARKM bounce and reverse, or break down into new lows?
---
📐 Technical Structure & Key Levels
Major Support (Demand Zone): $0.400 – $0.470
Layered Resistance:
Minor: $0.616, $0.730, $0.894
Mid-Level: $1.575
Major: $2.493 & $3.188
All-Time High: $3.996
Volume Insight: Still relatively low, suggesting possible accumulation.
---
🔄 Pattern Development:
✅ Potential Double Bottom or Accumulation Base – Multiple bounces off the $0.400 zone hint at the formation of a medium-term reversal structure.
If buyers step in and push the price above $0.616–$0.730, we could see confirmation of a trend reversal beginning.
---
📈 Bullish Scenario:
If price:
Holds and rebounds strongly from $0.400–$0.470
Breaks and closes above $0.616 and $0.730 with increasing volume
Then next bullish targets are:
➡️ $0.894 (key resistance)
➡️ $1.575 (mid-range supply zone)
➡️ $2.493 – $3.188 (macro targets for medium-long term rally)
📌 Volume breakout and bullish candle structures will strengthen this scenario.
---
📉 Bearish Scenario:
If price:
Breaks and closes decisively below $0.400, invalidating the support zone
This could trigger a mass stop-loss cascade, with sellers taking over.
Next possible supports: ⚠️ $0.250 (minor support)
⚠️ $0.170 (last structural support in breakdown mode)
This scenario might unfold if overall crypto market sentiment worsens.
---
🧠 Strategy & Trade Ideas:
Buy on Reversal: Strong bounce at $0.400 zone with tight stop-loss below support
Buy on Breakout: Clear break and retest of $0.730 with volume confirmation
Sell/Short: Breakdown below $0.400 with failed retest
🛡️ Always apply proper risk management with a minimum 1:2 risk-reward ratio. Avoid FOMO—wait for confirmation.
---
🔍 Final Thoughts:
ARKM is in a high-stakes zone that has historically generated explosive moves. This is either a huge opportunity for accumulation or a potential breakdown into uncharted lows. The next few candles could define the rest of the year for this asset.
#ARKM #ARKMUSDT #CryptoTA #AltcoinAnalysis #SupportAndResistance #CryptoBreakout #DoubleBottomPattern #ReversalZone #BuyOrBreak #CryptoSetup
ARKMUSD

ARKM/USDT – Major Breakout Signal from Multi-Month Accumulation Detailed Analysis:
ARKM/USDT is currently showing a strong technical signal for a potential bullish reversal after a prolonged downtrend from its peak near $3.996. Here are the key insights from the chart:
1. Long-Term Accumulation Zone:
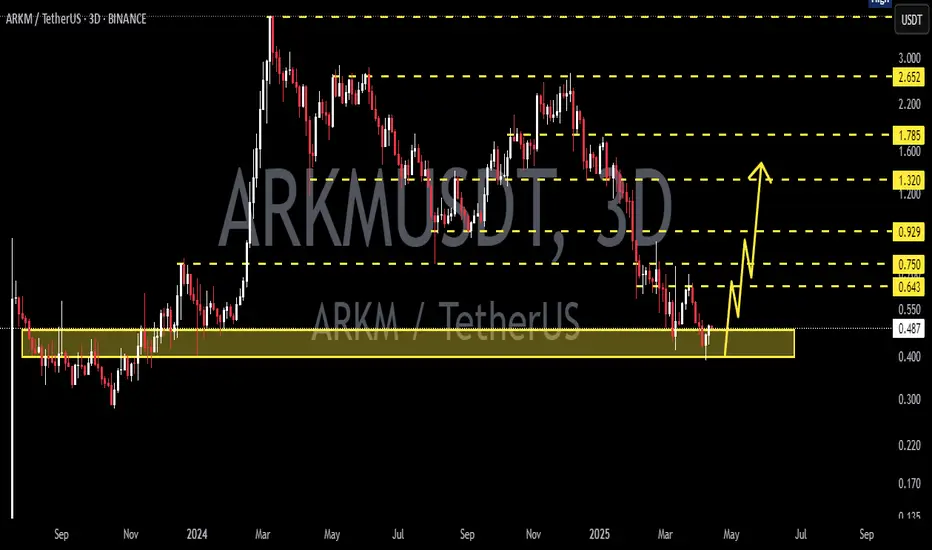
Price has formed a strong horizontal support zone between $0.35 and $0.45 (highlighted in yellow).
Multiple rejections from this zone indicate accumulation by smart money.
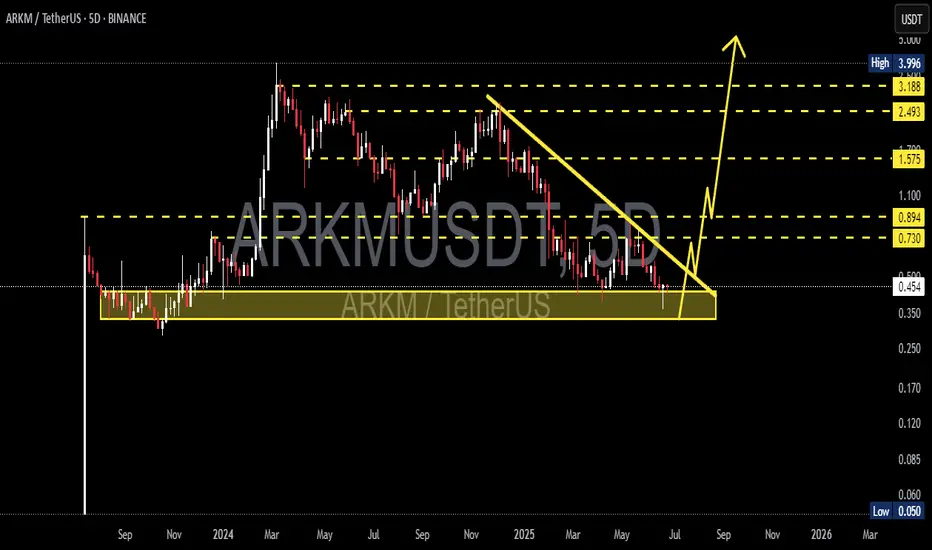
2. Descending Triangle Breakout Pattern:
A clear downward trendline has been tested multiple times and is now close to being broken.
A successful breakout could trigger a powerful upward rally.
3. Potential Upside Targets (Resistance Levels):
Target 1: $0.73
Target 2: $0.894
Target 3: $1.575
Target 4: $2.493
Target 5: $3.188
Final Target (ATH): $3.996
4. Potential Trading Strategy:
Aggressive entry: On breakout above the descending trendline with strong volume.
Conservative entry: On retest of the broken trendline, now acting as support.
Stop-loss: Just below the accumulation zone (~$0.30).
5. Market Sentiment:
The market structure suggests a potential bullish reversal is building.
If momentum confirms, this setup has significant upside potential.
🎯 Summary:
ARKM is showing signs of strength as it approaches a breakout from a key descending triangle pattern. A move above the resistance could mark the beginning of a strong bullish trend. Keep an eye on volume and breakout confirmation.
#ARKM #ARKMUSDT #CryptoBreakout #AltcoinAnalysis #TechnicalAnalysis #CryptoReversal #BullishSetup #CryptoTrading #TradingView #DescendingTriangle
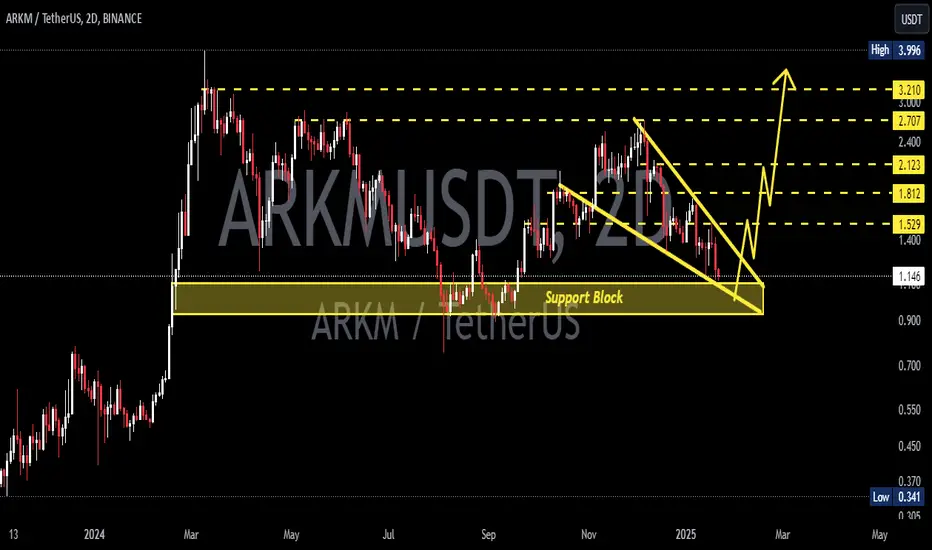
ARKMUSDT 2D AnalysisARKM ~ 2D Analysis
#ARKM Buy gradually from this support block with a short term target of at least 20%+ from here.
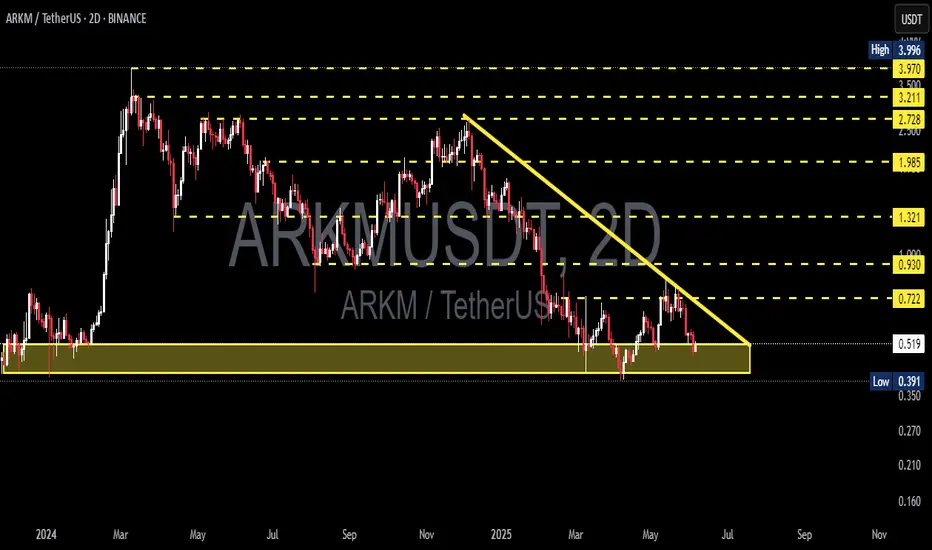
Arkm's price may drop more and more.Arkm may provide a good opportunity for long-term buying in the coming months. Most likely in the autumn months.
* The purpose of my graphic drawings is purely educational.
* What i write here is not an investment advice. Please do your own research before investing in any asset.
* Never take my personal opinions as investment advice, you may lose your money.
Arkm near term.Possible near term scenarios.
* The purpose of my graphic drawings is purely educational.
* What i write here is not an investment advice. Please do your own research before investing in any asset.
* Never take my personal opinions as investment advice, you may lose your money.
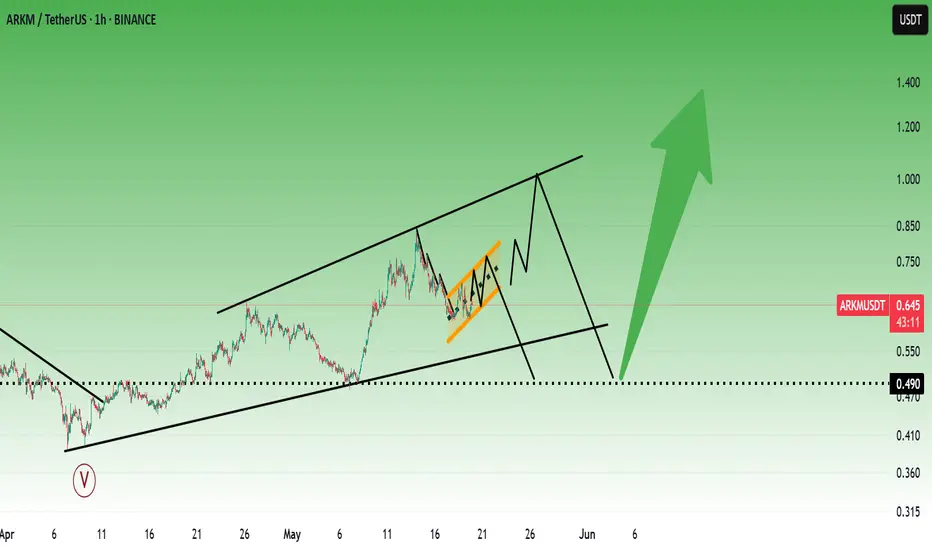
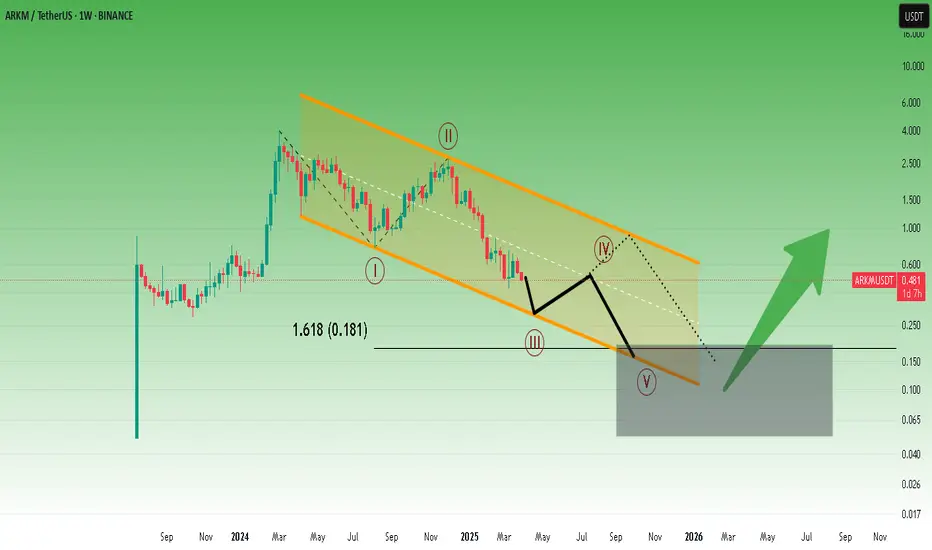
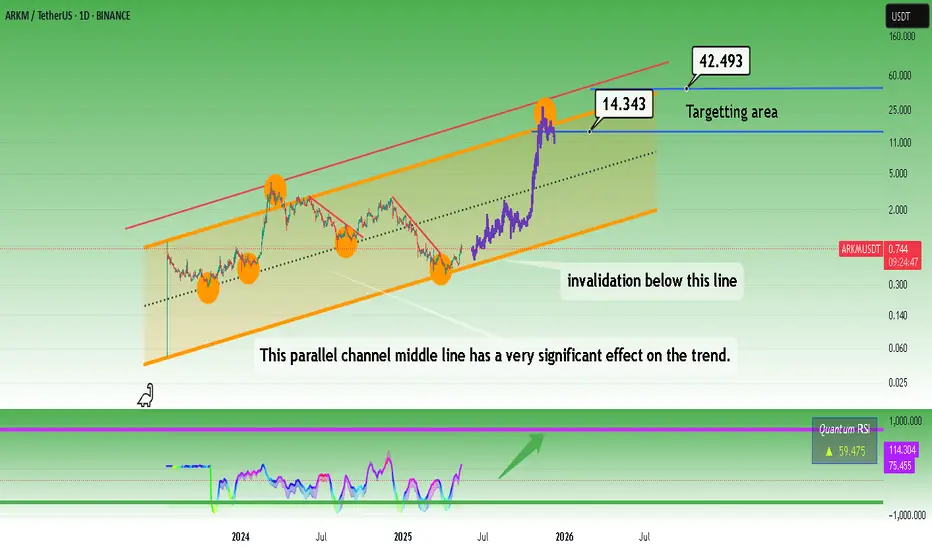
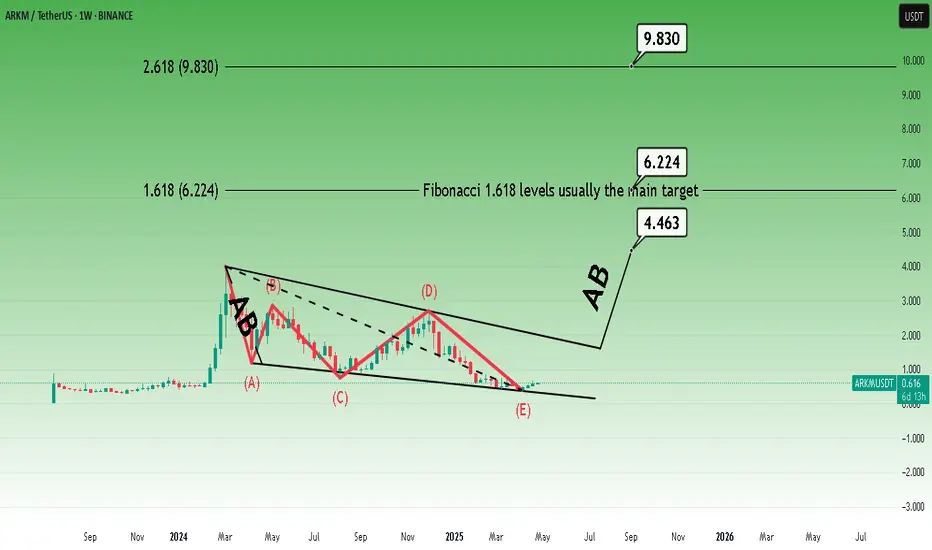
Arkm possible bull market targets.Possible bull market targets and invalidation level. It is obvious that prices have been moving within this channel so far.
* The purpose of my graphic drawings is purely educational.
* What i write here is not an investment advice. Please do your own research before investing in any asset.
* Never take my personal opinions as investment advice, you may lose your money.
#ARKM/USDT#ARKM
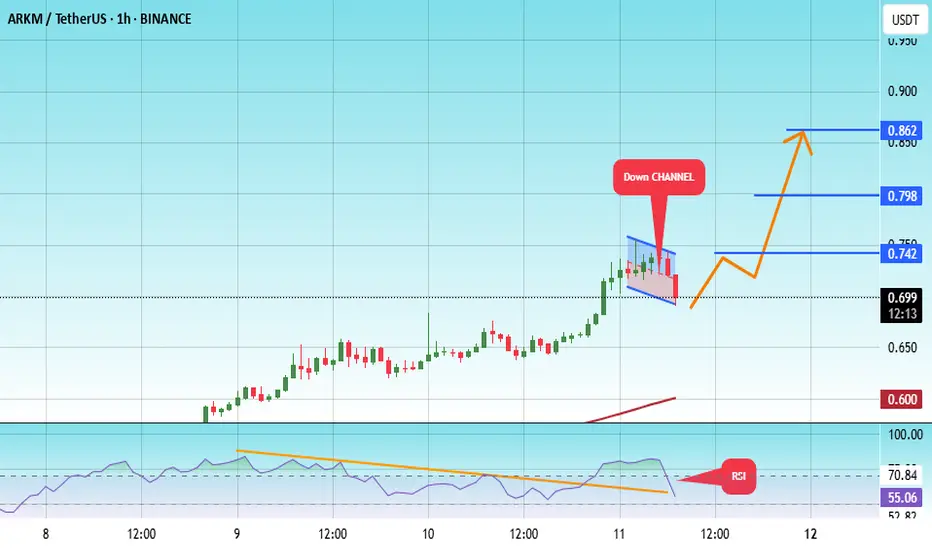
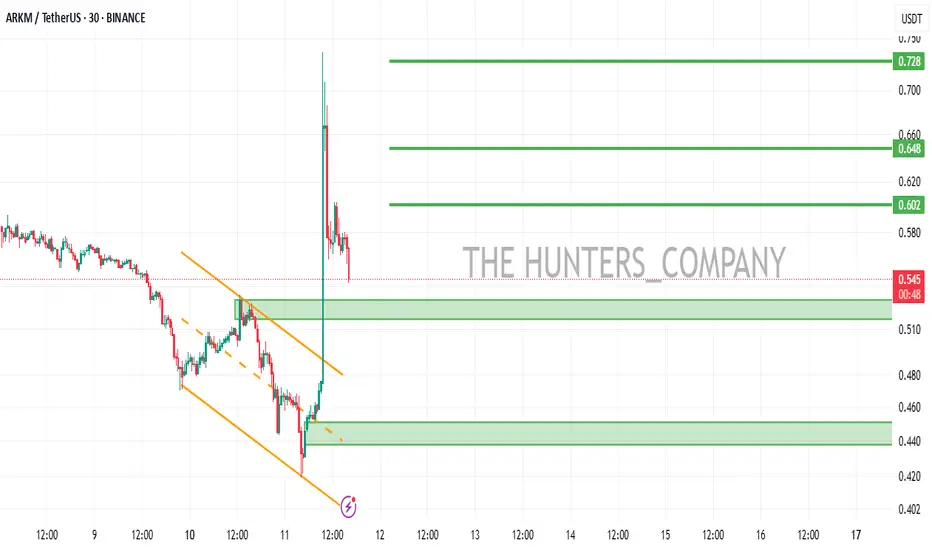
The price is moving within a descending channel on the 1-hour frame, adhering well to it, and is heading for a strong breakout and retest.
We are seeing a bounce from the lower boundary of the descending channel, which is support at 0.690.
We have a downtrend on the RSI indicator that is about to be broken and retested, supporting the upward trend.
We are looking for stability above the 100 moving average.
Entry price: 0.695
First target: 0.742
Second target: 0.798
Third target: 0.862
#ARKM/USDT#ARKM
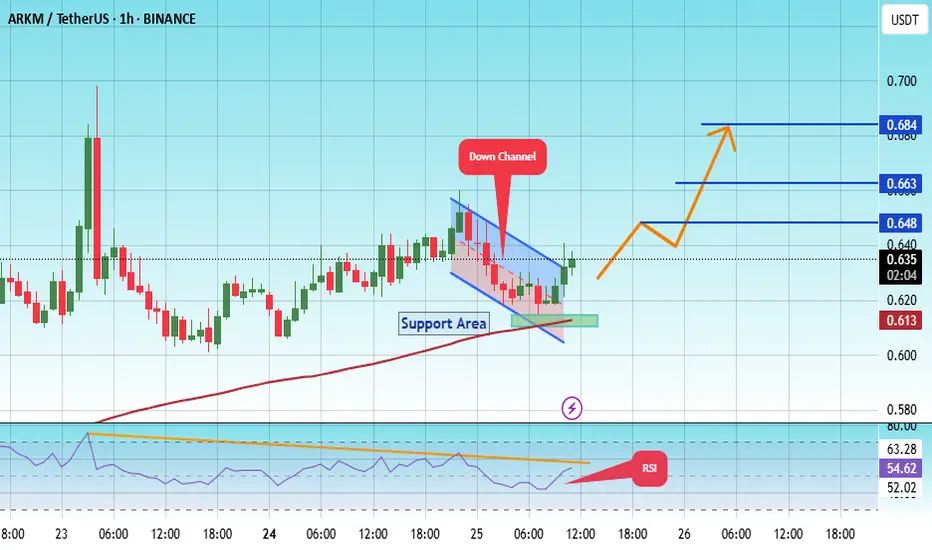
The price is moving within a descending channel on the 1-hour frame, adhering well to it, and is heading for a strong breakout and retest.
We are seeing a bounce from the lower boundary of the descending channel, which is support at 0.612.
We have a downtrend on the RSI indicator that is about to break and retest, supporting the upward trend.
We are looking for stability above the 100 moving average.
Entry price: 0.635
First target: 0.684
Second target: 0.663
Third target: 0.684
My eyes are on Arkm.The downtrend in Arkm may be over. I was actually predicting a further downtrend, but the fact that the trade war issue is getting off the agenda and Bitcoin remains strong in my opinion may start the rise.
A possible bull market in Arkm wouldn't surprise me, as the possibility of a strong upside on the Bitcoin side begins to emerge. The falling wedge target may be the first target
* The purpose of my graphic drawings is purely educational.
* What i write here is not an investment advice. Please do your own research before investing in any asset.
* Never take my personal opinions as investment advice, you may lose your money.
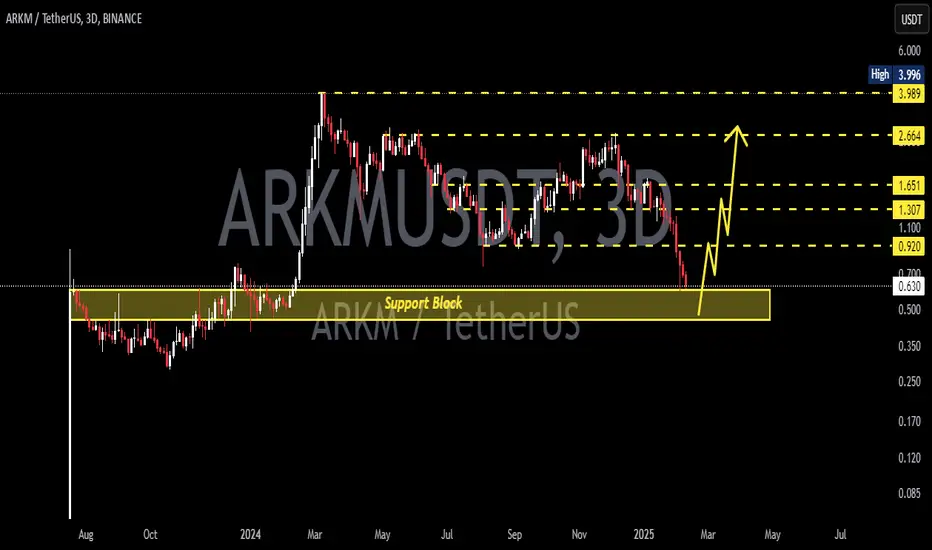
ARKMUSDT 3DARKM ~ 3D Analysis
#ARKM Buy gradually from here if you still have a Conviction on this coin with a short -term target of at least 20%+.
ARKM/USDTHello friends
Given the price growth of this token, now that we are in a price correction, it is a good opportunity to buy.
We have identified the buying steps for you, which are three ranges, one is the market, the other two are green ranges, and price targets have also been identified.
*Trade safely with us*
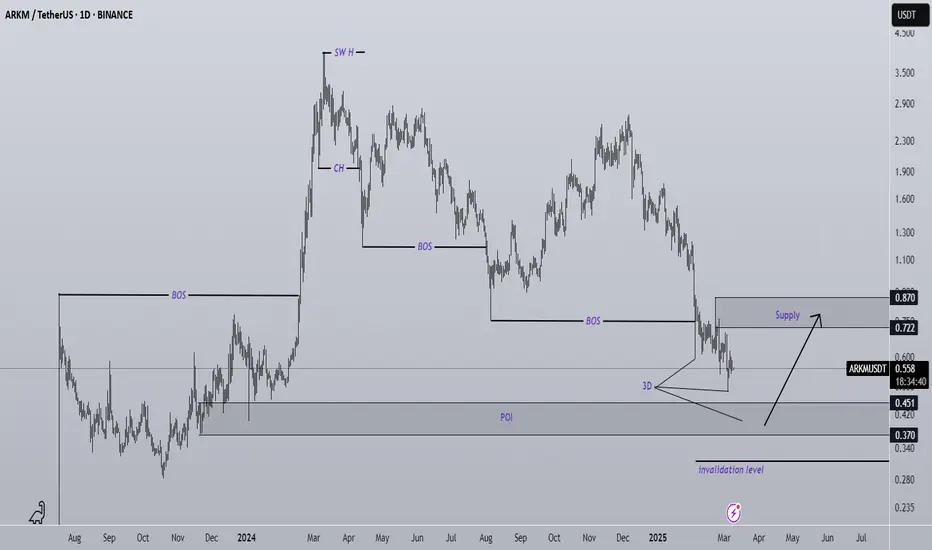
Over 70% profit with ARKM (1D)ARKM is approaching a strong support zone with a 3D structure, presenting a BUY opportunity for us.
We are looking for buy/long opportunities within the POI (Point of Interest) zone. The target can be the Supply box.
A daily candle closing below the invalidation level could invalidate this analysis.
Do not enter the position without capital management and stop setting
Comment if you have any questions
thank you
ARKMUSDT 3DARKM ~ 3D Analysis
#ARKM Buy gradually from here with a short -term target of at least 15%+.
ARKM | CHART PATTERNS | BUY the BOTTOMARKM is a fairly new altcoin that's been on my TOP alt list for some time.
The bearish M chart pattern is a pattern that signifies a large correction, especially in the macro timeframe such as the weekly. By looking at the chart, e can see the correction is nearly over since it has almost retraced ack to opening levels - almost .
Opening levels have in fact not yet been retested, and this may be a great place to stack up / re-accumulate if you're a believer.
Another ALT that's seems to be approaching a bottom is AVAX:
______________
BINANCE:ARKMUSDT

ARKM | ALTCOINS | Is another 400% Increase Possible??ARKM is an altcoin that has great upside potential, and it's approaching a key support zone - the opening levels.
The good news, is that the corrective pattern (in the macro timeframe) is nearly over. However, there are large bounces possible between these zones that look "small" in the weekly timeframe:
_____________________
BINANCE:ARKMUSDT

ARKMUSDT 3DARKM ~ 3D Analysis
#ARKM If you still have a Conviction on this Coin, Maybe you can consider this support to start buying again.
ARKMUSDT 2DARKM ~ 2D
#ARKM If you still have Conviction on this coin,. Buy in stages from here with a minimum target of 20%++
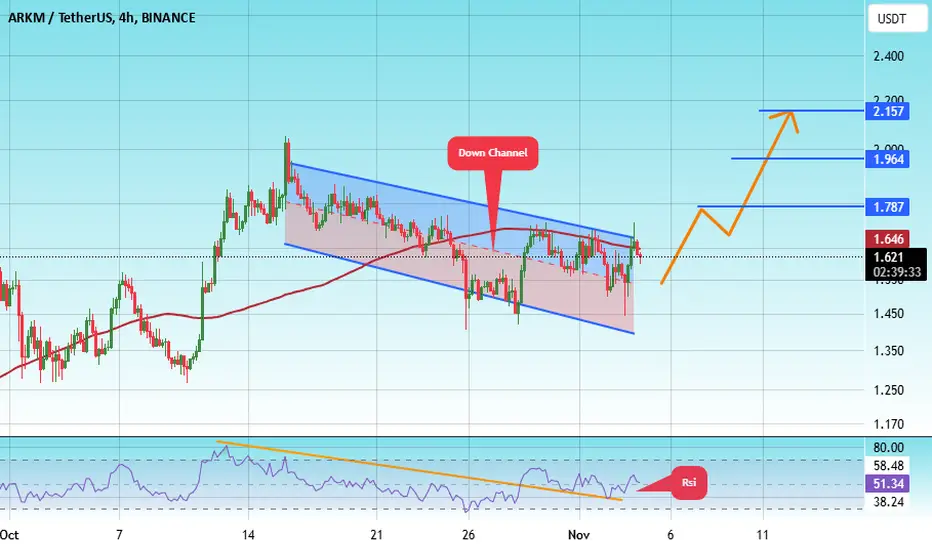
#ARKM/USDT#ARKM
The price is moving in a descending channel on the 4-hour frame and is sticking to it well
We have a bounce from the lower limit of the descending channel and we are now touching this support at a price of 1.45
We have a downtrend and the RSI indicator is about to break, which supports the rise
We have a trend to stabilize above the moving average 100
Entry price 1.56
First target 1.78
Second target 1.96
Third target 2.15
ARKM Looks Bearish (1D)From where we placed the red arrow on the chart, it seems that ARKM has entered a correction.
This correction looks like a diametric as we are now at the end of wave D.
It can drop by maintaining the supply range.
The green range is good support.
Closing a daily candle above the invalidation level will violate this analysis
For risk management, please don't forget stop loss and capital management
Comment if you have any questions
Thank You

#ARKM Quick PUMM Is Loading #ARKM Quick PUMM Is Loading .. A Exit/Quick Pump may occur in #ARKM..This is about 70 % Pump Target..
For Timely Updates DM me.

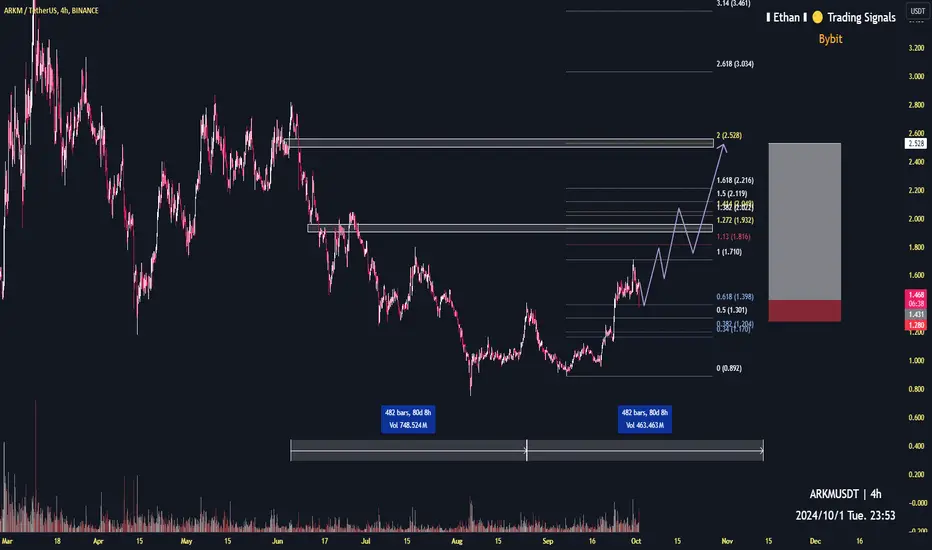
ARKM target 2.524h time frame
-
Entry: $1.4
TP: $2.52
SL: $1.28
RR: 7.26
-
(1) Potential symmetrical structure, will go to the high at $2.52 before December
(2) Retesting the standard double bottom, which neckline is around $1.4
(3) Fibonacci projection 0.618 provide another support
(4) Target is set at Fib 2.0, which also have the resistance from previous structure
(5) Stop loss once going below $1.28
ARKMARKM / USDT
–It looks like it finally Found support at big imaginary channel bottom ✅
–falling wedge breakout ✅
Looks bullish for me

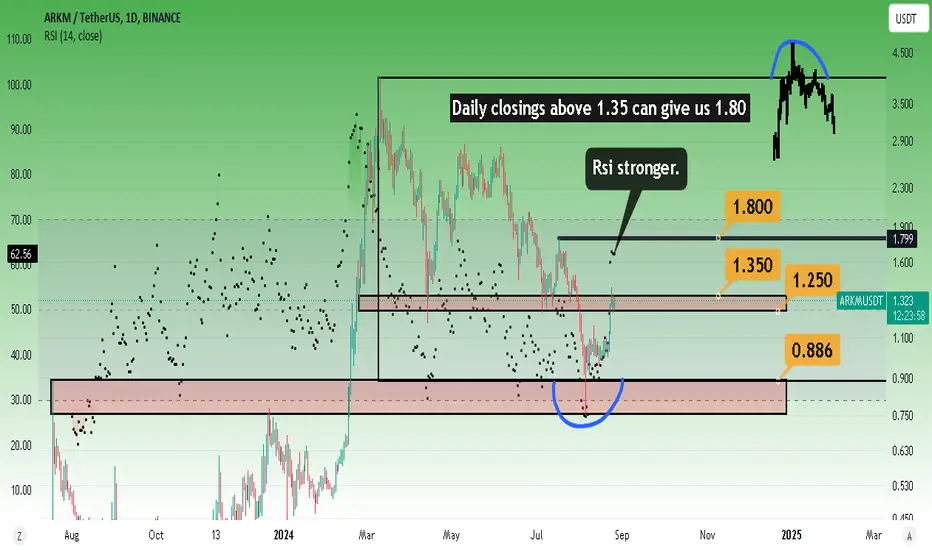
Arkm looking stronger.Above 1.35 uptrend may accelerate.
Stronger rsi is promising.
It is also important to follow the short-term support level. ( 1.25$ )
* What i share here is not an investment advice. Please do your own research before investing in any digital asset.
* Never take my personal opinions as investment advice, you may lose all your money.