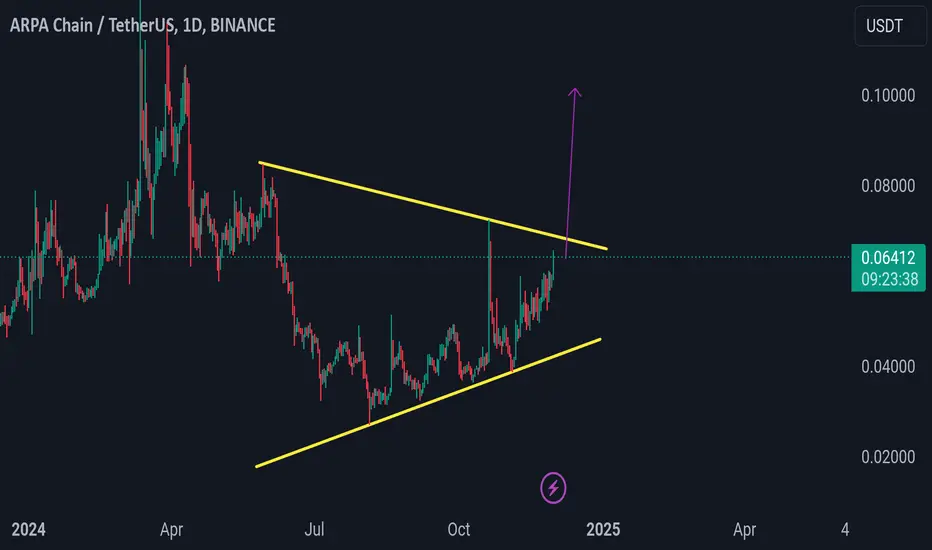
ARPAUSDT Forming Falling WedgeARPAUSDT is drawing fresh attention from crypto traders as it forms a classic falling wedge pattern on the daily timeframe. This technical pattern is widely recognized as a strong bullish reversal signal when backed by healthy volume and growing investor interest. The falling wedge indicates that the downtrend is losing momentum, and a breakout to the upside could trigger a significant move. With current market dynamics, ARPAUSDT is showing promising signs that it could deliver an expected gain of 80% to 90% or more once this pattern resolves.
Good volume levels in recent sessions confirm that accumulation is happening quietly, which is often the case before a breakout from a wedge pattern. Traders looking for high-probability setups should keep an eye on the breakout zone around the wedge’s upper trendline. A confirmed close above this resistance with increased volume could be the catalyst for a strong rally. ARPA’s fundamentals, coupled with positive sentiment from investors taking interest in the project, add extra fuel to the potential upside.
As more altcoins regain momentum, ARPAUSDT stands out as one of the most interesting pairs to watch for short- to mid-term gains. Technical traders and pattern-based investors often target these setups to capture explosive price action. Staying patient for a clean breakout and using proper risk management will be crucial to maximize the reward potential in this setup.
✅ Show your support by hitting the like button and
✅ Leaving a comment below! (What is You opinion about this Coin)
Your feedback and engagement keep me inspired to share more insightful market analysis with you!
ARPAUSDT
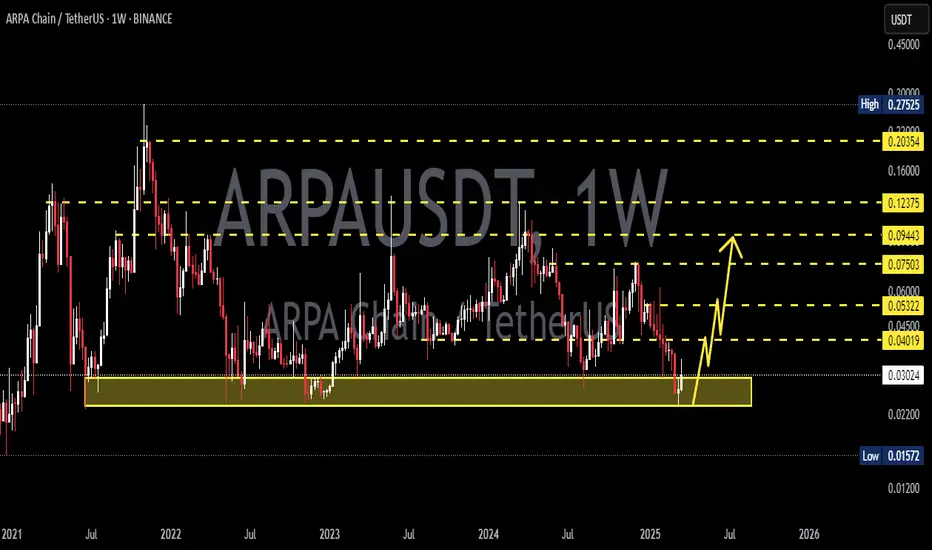
ARPAUSDT 1W Analysis ARPA ~ 1W Analysis
#ARPA Buy back from here if you still have confidence in this coin with a short term target of at least 20%++.
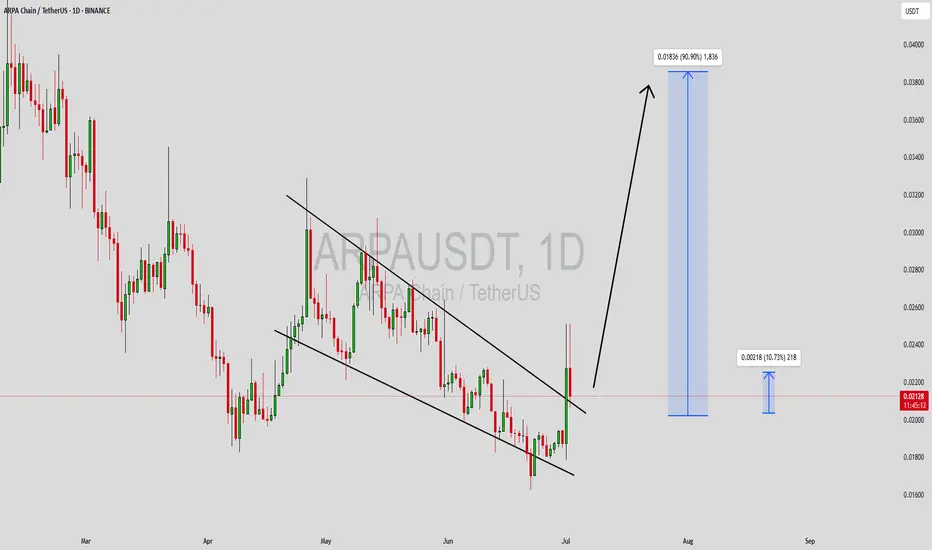
ARPAUSDT Forming Falling WedgeARPAUSDT is currently presenting a classic falling wedge pattern, which is widely recognized as a bullish reversal formation in technical analysis. This setup suggests that the recent downtrend may be losing momentum, with lower highs and lower lows converging toward a breakout point. The narrowing wedge, combined with consistent volume, indicates that a strong move could be imminent once resistance is broken. Based on the structure and historical behavior, traders are eyeing a potential gain in the range of 80% to 90%+ in the upcoming sessions.
The volume profile remains healthy, reflecting strong investor interest and growing participation around these price levels. This is often a precursor to breakout rallies, especially when the broader market sentiment is shifting toward altcoins. The wedge pattern, if confirmed by a breakout above the resistance line with strong bullish candles, could trigger a significant upside momentum as technical traders and algorithms enter long positions.
ARPAUSDT also benefits from strong community backing and increasing mentions across social and trading platforms, signaling that sentiment is tilting positive. With fundamentals aligning and technicals pointing to a breakout, this pair stands out among mid-cap altcoins for traders looking for potential explosive setups. Key levels to watch include the breakout point and subsequent resistance zones, which, if cleared, may lead to a sustained bullish move.
As the pattern develops and market dynamics unfold, ARPAUSDT could become one of the more attractive opportunities in the short term. Be prepared for increased volatility and monitor the breakout closely for confirmation.
✅ Show your support by hitting the like button and
✅ Leaving a comment below! (What is You opinion about this Coin)
Your feedback and engagement keep me inspired to share more insightful market analysis with you!

ARPAUSDT: A Resilient Asset Amidst Market UncertaintyAmidst the current market's discernible weakness, where many altcoins experience a decline, a close examination of ARPAUSDT reveals characteristics that suggest it is not merely another asset in freefall. Indeed, it presents as a potentially more resilient area within this volatile landscape.
While price has experienced significant depreciation, a diligent review indicates that buying activity persists, demonstrating a notable resilience against selling pressure. This is derived from objective observation:
Volume Footprint: Despite falling prices, the volume footprint indicates a consistent, albeit intermittent, presence of genuine buying activity—an underlying current of demand.
CDV (Cumulative Delta Volume): CDV frequently suggests that selling pressure is being absorbed, even during price declines, differentiating its behavior from assets under clear bearish dominance.
Buyer Resilience: The consistent strength demonstrated by these buyers, despite prevailing market weakness, suggests a foundational capacity to mitigate further significant depreciation.
This distinct behavior positions ARPAUSDT as noteworthy. Consistent with a disciplined approach, particular attention is given to assets exhibiting sudden and significant increases in volume. For ARPAUSDT, the quality of buyer volume, though fragmented, merits consideration.
Therefore, diligent observation of ARPAUSDT is advised. During periods of broader market uncertainty, genuine underlying strength becomes more apparent. Further validation through low timeframe (LTF) confirmations is essential to corroborate these dynamics. Opportunities in resilient assets, distinct from the general apprehension, are indeed uncommon.
📌I keep my charts clean and simple because I believe clarity leads to better decisions.
📌My approach is built on years of experience and a solid track record. I don’t claim to know it all but I’m confident in my ability to spot high-probability setups.
📌If you would like to learn how to use the heatmap, cumulative volume delta and volume footprint techniques that I use below to determine very accurate demand regions, you can send me a private message. I help anyone who wants it completely free of charge.
🔑I have a long list of my proven technique below:
🎯 ZENUSDT.P: Patience & Profitability | %230 Reaction from the Sniper Entry
🐶 DOGEUSDT.P: Next Move
🎨 RENDERUSDT.P: Opportunity of the Month
💎 ETHUSDT.P: Where to Retrace
🟢 BNBUSDT.P: Potential Surge
📊 BTC Dominance: Reaction Zone
🌊 WAVESUSDT.P: Demand Zone Potential
🟣 UNIUSDT.P: Long-Term Trade
🔵 XRPUSDT.P: Entry Zones
🔗 LINKUSDT.P: Follow The River
📈 BTCUSDT.P: Two Key Demand Zones
🟩 POLUSDT: Bullish Momentum
🌟 PENDLEUSDT.P: Where Opportunity Meets Precision
🔥 BTCUSDT.P: Liquidation of Highly Leveraged Longs
🌊 SOLUSDT.P: SOL's Dip - Your Opportunity
🐸 1000PEPEUSDT.P: Prime Bounce Zone Unlocked
🚀 ETHUSDT.P: Set to Explode - Don't Miss This Game Changer
🤖 IQUSDT: Smart Plan
⚡️ PONDUSDT: A Trade Not Taken Is Better Than a Losing One
💼 STMXUSDT: 2 Buying Areas
🐢 TURBOUSDT: Buy Zones and Buyer Presence
🌍 ICPUSDT.P: Massive Upside Potential | Check the Trade Update For Seeing Results
🟠 IDEXUSDT: Spot Buy Area | %26 Profit if You Trade with MSB
📌 USUALUSDT: Buyers Are Active + %70 Profit in Total
🌟 FORTHUSDT: Sniper Entry +%26 Reaction
🐳 QKCUSDT: Sniper Entry +%57 Reaction
📊 BTC.D: Retest of Key Area Highly Likely
📊 XNOUSDT %80 Reaction with a Simple Blue Box!
📊 BELUSDT Amazing %120 Reaction!
📊 Simple Red Box, Extraordinary Results
📊 TIAUSDT | Still No Buyers—Maintaining a Bearish Outlook
📊 OGNUSDT | One of Today’s Highest Volume Gainers – +32.44%
📊 TRXUSDT - I Do My Thing Again
📊 FLOKIUSDT - +%100 From Blue Box!
📊 SFP/USDT - Perfect Entry %80 Profit!
📊 AAVEUSDT - WE DID IT AGAIN!
I stopped adding to the list because it's kinda tiring to add 5-10 charts in every move but you can check my profile and see that it goes on..
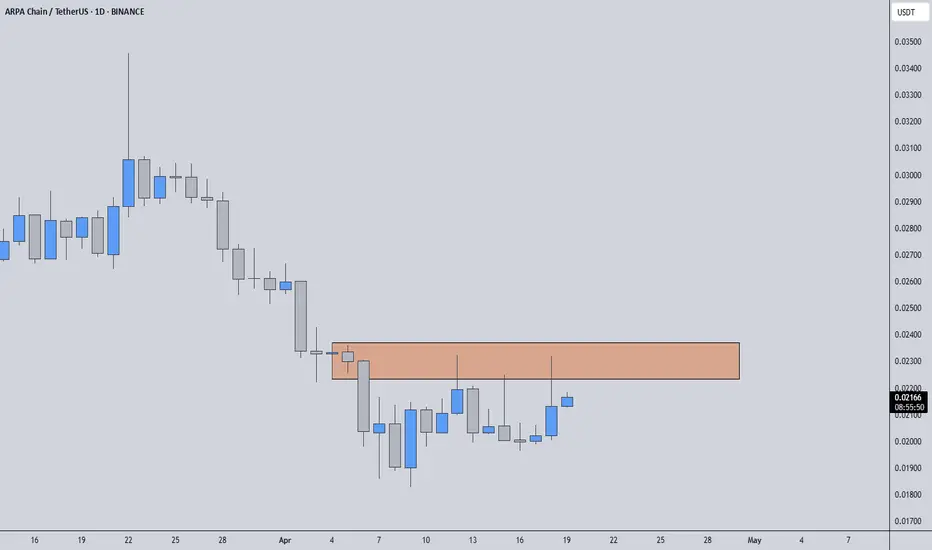
ARPAUSDT | The Whales Are Quiet, But I'm Watching Them CloselyARPAUSDT has been on my radar for a long time. What makes this coin special isn’t just the price movement, it’s who’s behind it. Every dip so far has been met with strategic buying.
🟧 Orange Box: Key Opportunity Zone
This orange box could act as a launchpad. If we break above it and receive a clean retest with confirmation on lower timeframes, a long setup becomes valid. This is not the time to guess, it’s the time to let the market speak and act with precision.
🚫 Why I’m Not Interested in Shorts
Despite the pullbacks, I don’t consider shorting ARPAUSDT. The nature of each drop has shown strong buying interest. If the price continues to dip, I’d see it as a buying opportunity rather than a weakness. There’s power behind this move and the smart money knows it.
💡 This Is Why You Follow Me
You follow me because my analysis works. Because I consistently identify these moves before the crowd. That’s not a coincidence. It’s the result of deep understanding, discipline, and a system that filters out the noise. Stick with me if you want to be ahead, not chasing behind.
Let others react emotionally. We plan, wait, and execute. That’s the difference.
📌I keep my charts clean and simple because I believe clarity leads to better decisions.
📌My approach is built on years of experience and a solid track record. I don’t claim to know it all but I’m confident in my ability to spot high-probability setups.
📌If you would like to learn how to use the heatmap, cumulative volume delta and volume footprint techniques that I use below to determine very accurate demand regions, you can send me a private message. I help anyone who wants it completely free of charge.
🔑I have a long list of my proven technique below:
🎯 ZENUSDT.P: Patience & Profitability | %230 Reaction from the Sniper Entry
🐶 DOGEUSDT.P: Next Move
🎨 RENDERUSDT.P: Opportunity of the Month
💎 ETHUSDT.P: Where to Retrace
🟢 BNBUSDT.P: Potential Surge
📊 BTC Dominance: Reaction Zone
🌊 WAVESUSDT.P: Demand Zone Potential
🟣 UNIUSDT.P: Long-Term Trade
🔵 XRPUSDT.P: Entry Zones
🔗 LINKUSDT.P: Follow The River
📈 BTCUSDT.P: Two Key Demand Zones
🟩 POLUSDT: Bullish Momentum
🌟 PENDLEUSDT.P: Where Opportunity Meets Precision
🔥 BTCUSDT.P: Liquidation of Highly Leveraged Longs
🌊 SOLUSDT.P: SOL's Dip - Your Opportunity
🐸 1000PEPEUSDT.P: Prime Bounce Zone Unlocked
🚀 ETHUSDT.P: Set to Explode - Don't Miss This Game Changer
🤖 IQUSDT: Smart Plan
⚡️ PONDUSDT: A Trade Not Taken Is Better Than a Losing One
💼 STMXUSDT: 2 Buying Areas
🐢 TURBOUSDT: Buy Zones and Buyer Presence
🌍 ICPUSDT.P: Massive Upside Potential | Check the Trade Update For Seeing Results
🟠 IDEXUSDT: Spot Buy Area | %26 Profit if You Trade with MSB
📌 USUALUSDT: Buyers Are Active + %70 Profit in Total
🌟 FORTHUSDT: Sniper Entry +%26 Reaction
🐳 QKCUSDT: Sniper Entry +%57 Reaction
📊 BTC.D: Retest of Key Area Highly Likely
📊 XNOUSDT %80 Reaction with a Simple Blue Box!
📊 BELUSDT Amazing %120 Reaction!
I stopped adding to the list because it's kinda tiring to add 5-10 charts in every move but you can check my profile and see that it goes on..
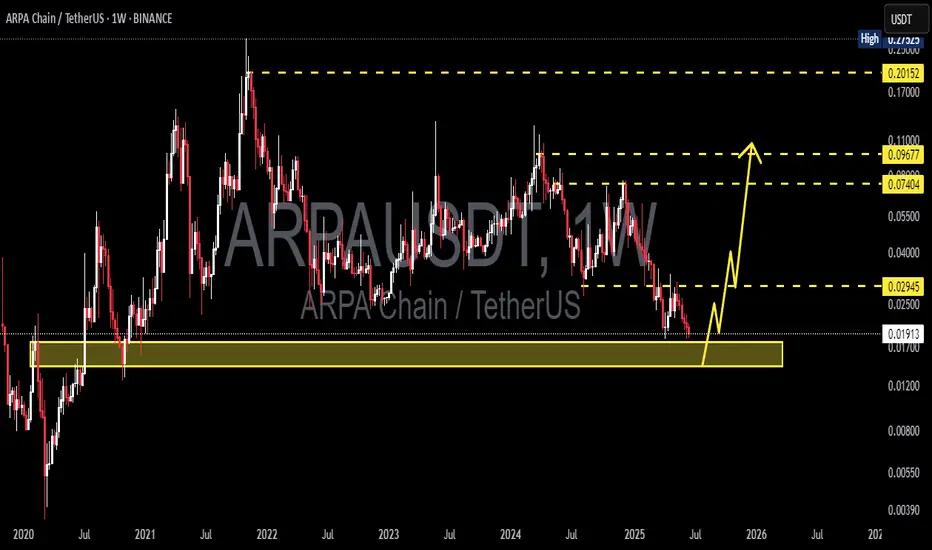
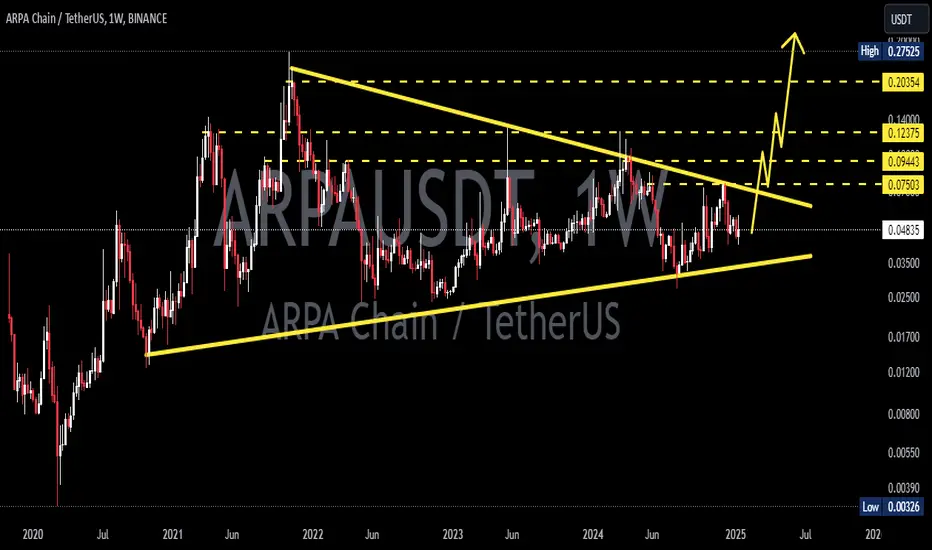
ARPAUSDT 1WARPA ~ 1W Analysis
#ARPA High risk trade. Buy gradually from here if you still have a Conviction on this coin with a short -term target of at least 15%+.
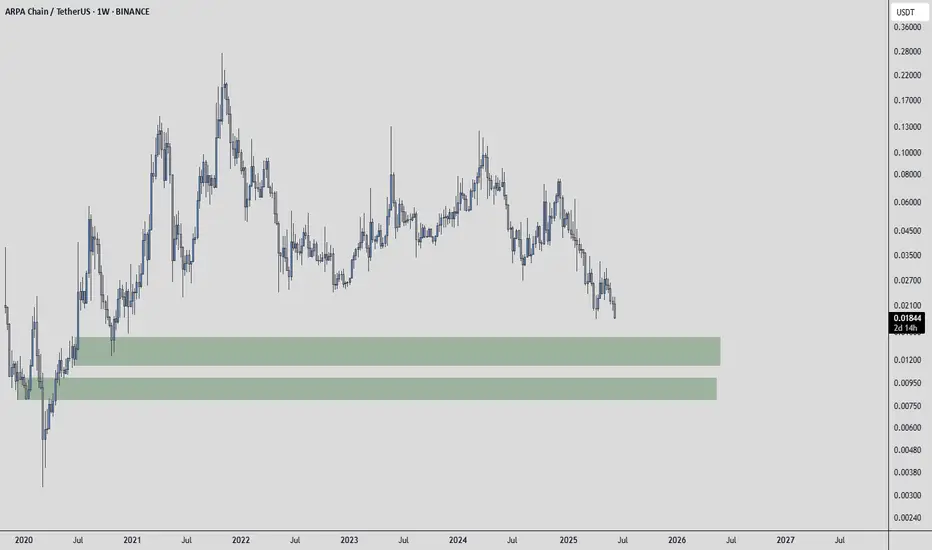
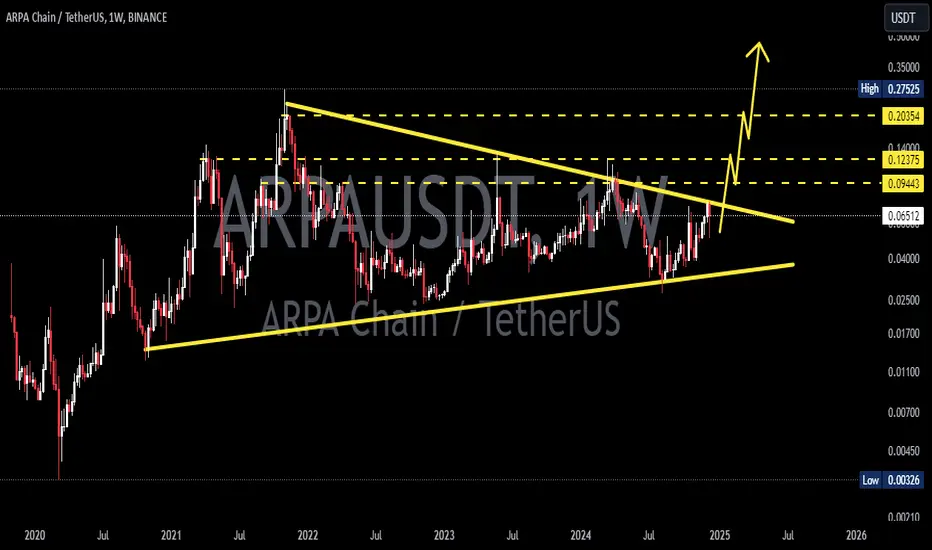
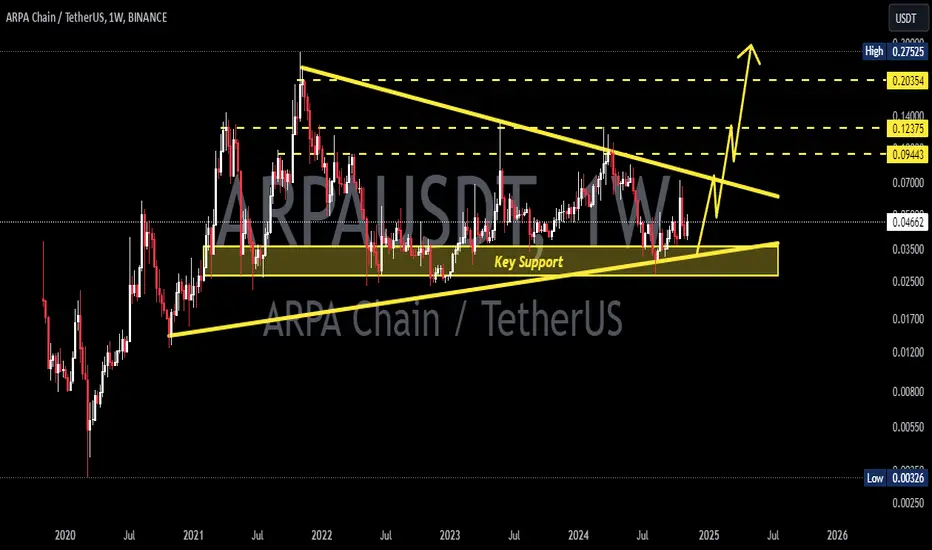
ARPAUSDT 1WARPA ~ 1W Analysis
#ARPA So far it still maintains this block of support. Buy gradually from here with a minimum target of 20%+

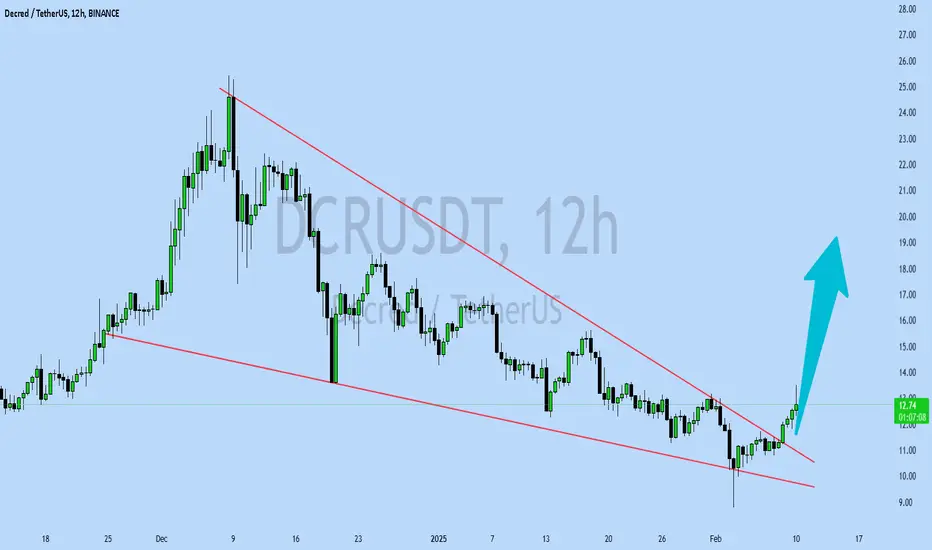
DCRUSDT UPDATEDCRUSDT is a cryptocurrency trading at $12.84. Its target price is $19.00, indicating a potential 50%+ gain. The pattern is a Bullish Falling Wedge, a reversal pattern signaling a trend change. This pattern suggests the downward trend may be ending. A breakout from the wedge could lead to a strong upward move. The Bullish Falling Wedge is a positive signal, indicating a potential price surge. Investors are optimistic about DCRUSDT's future performance. The current price may be a buying opportunity. Reaching the target price would result in significant returns. DCRUSDT is poised for a potential breakout and substantial gains.
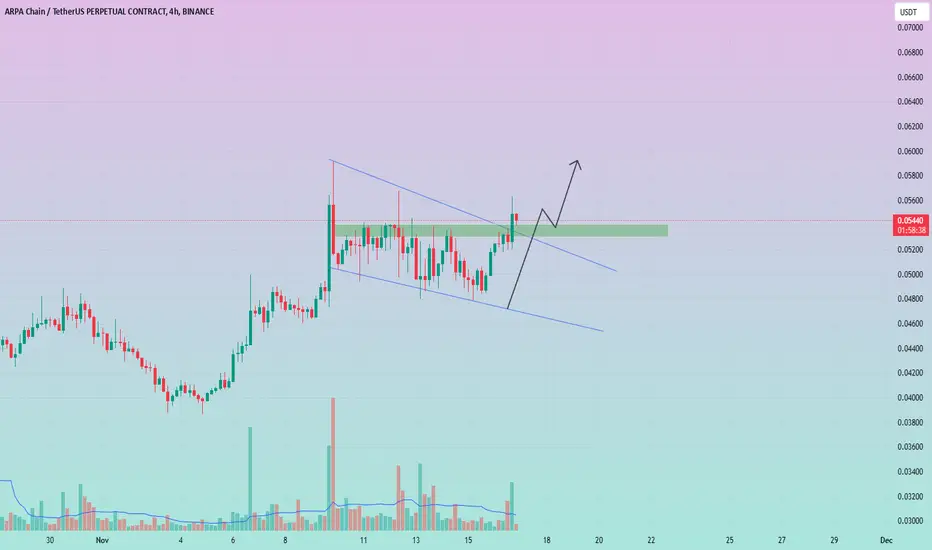
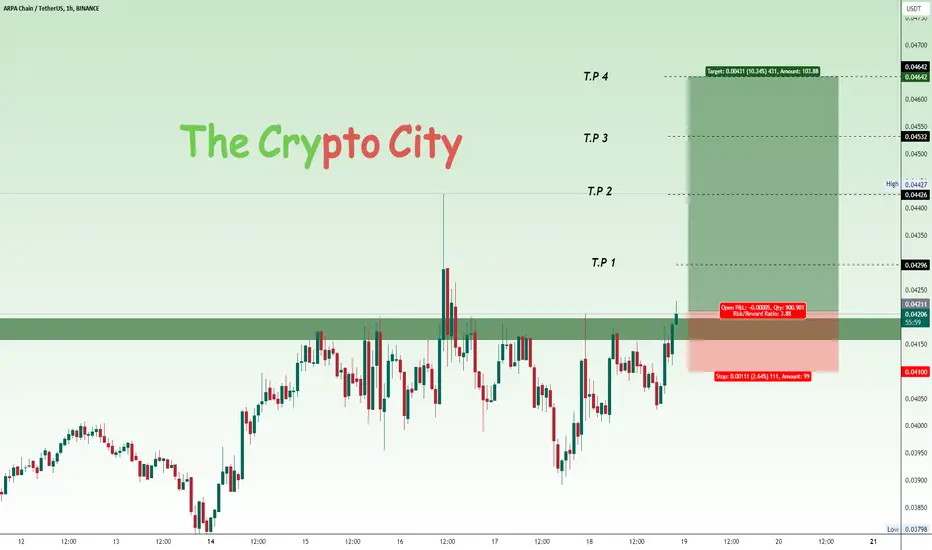
Long ARPAThe good moment for try to Buy ARPA. We have start creating up move trend. And now we are testing the middle level of maybe this future trend channel. Try to take a long with small stop and good risk reward ration if it will confirm. Will see...
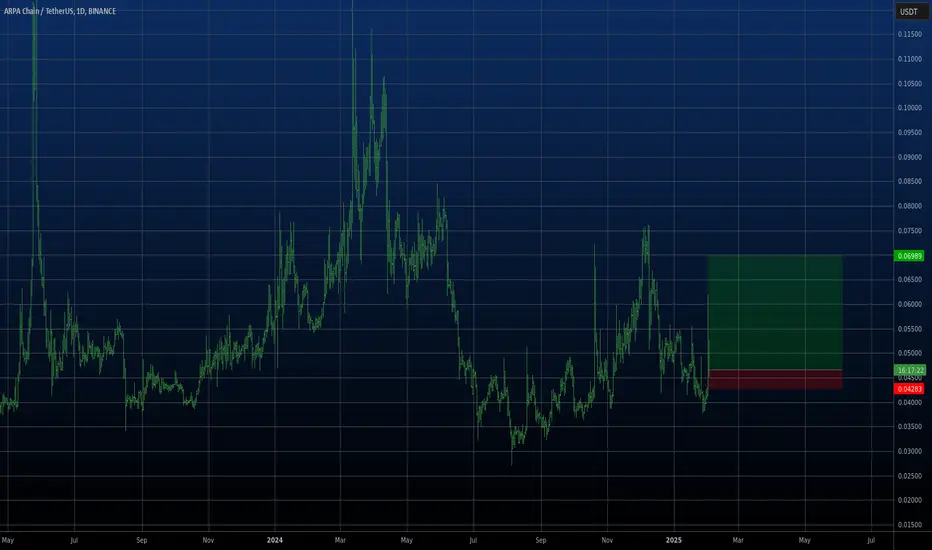
ARPAUSDT(ARPAChain) Updated till 02-02-25ARPAUSDT(ARPAChain) Daily timeframe range. alltho many things are dumping its still holding on to its level. and tried to get through 0.05405. but sadly volume is still not there. to further move it needs volume. recent support at 0.03973.

ARPAUSDT 1WARPA ~ 1W
#ARPA If you still have Conviction on this coin,. Buy gradually inside this bullish pattern with a minimum target of 20%++
ARPAUSDT 1WARPA ~ 1W
#ARPA If you still have Conviction on the coin,. buy gradually in this pattern., Resistance that continues to be retested will get weaker. It is only a matter of time until this resistance line is broken. Minimum target 20%+
#AR/USDT#AR
The price is moving in a descending channel on the 4-hour frame and is holding it tightly and is about to break out to the upside
We have a bounce from the lower limit of the channel at 17.70
We have a bearish trend for the RSI that is about to break out, which supports the upside
We have a trend to stabilize above the 100 moving average
Entry price 18.40
First target 20.50
Second target 22.22
Third target 24.95

Arpa/Usdt: Building Momentum for a Key BreakoutArpa/usdt is showing signs of an important setup as it approaches a key resistance level. The current price action suggests the potential for a breakout, which could lead to a strong bullish rally if confirmed.
Observations:
- The resistance zone has acted as a barrier in the past, and breaking above it could pave the way for an upward move.
- Watch for increased volume during the breakout, as it often signals strong market participation.
- Indicators like RSI and MACD are showing positive momentum, adding to the breakout possibilities.
Tips for trading:
- Wait for a clear 4-hour or daily candle close above the resistance to ensure confirmation.
- Look for a pullback to the broken resistance turning into support, which can provide a safer entry.
- Use a stop-loss below the breakout level to manage risk effectively.
- Be mindful of false breakouts, especially if the volume does not support the move.
Potential targets will depend on the next key levels on the chart and overall market conditions. Always conduct thorough research and follow your trading plan to ensure calculated decisions.
This is for educational purposes only, not financial advice. Always trade responsibly.
ARPAUSDTARPA ~ 1W
#ARPA If you have Conviction on this coin,. Buy gradually in this pattern. with a minimum target of 20%++
ARPA/USDT is on the verge of a big breakout! 🚀 ARPA/USDT is on the verge of a big breakout! 🚀
The ARPA/USDT trading pair is showing strong signs of a potential breakout as it approaches a key resistance level. 📈 If the price can push above this crucial zone, it could ignite a significant bullish rally, driving prices higher. Here’s a detailed look at what to watch for and why it matters. 🔥
What to watch for:
- Key resistance levels: The price is nearing a significant resistance area that has previously acted as a barrier. A breakout above this level could signal the beginning of a new bullish trend, paving the way for substantial gains. This move could attract more buyers, fueling a stronger rally. 🚀
- Trading volume: Watch for an increase in trading volume. If the breakout is accompanied by a surge in volume, it indicates strong market interest, with buyers stepping in to push the price higher. High-volume breakouts are generally more sustainable and less prone to immediate reversals. 📊
- Market sentiment: Broader market trends and sentiment can play a crucial role in determining the strength of the breakout. If the overall crypto market is showing signs of recovery or optimism, it could support the breakout in ARPA/USDT and make a sustained rally more likely. If sentiment is bearish, the breakout could face additional challenges. 🏦
Why this setup matters:
A breakout above the current resistance level could indicate a trend reversal or the continuation of an upward trend for ARPA/USDT. For traders, this could present an opportunity to capitalize on potential gains if the bullish momentum builds. Keeping a close eye on these factors will help gauge the breakout's strength and potential sustainability. 🧐
⚠️ Disclaimer: This is not financial advice. Always do your own research (DYOR) before making any investment decisions, and ensure you manage your risk appropriately.

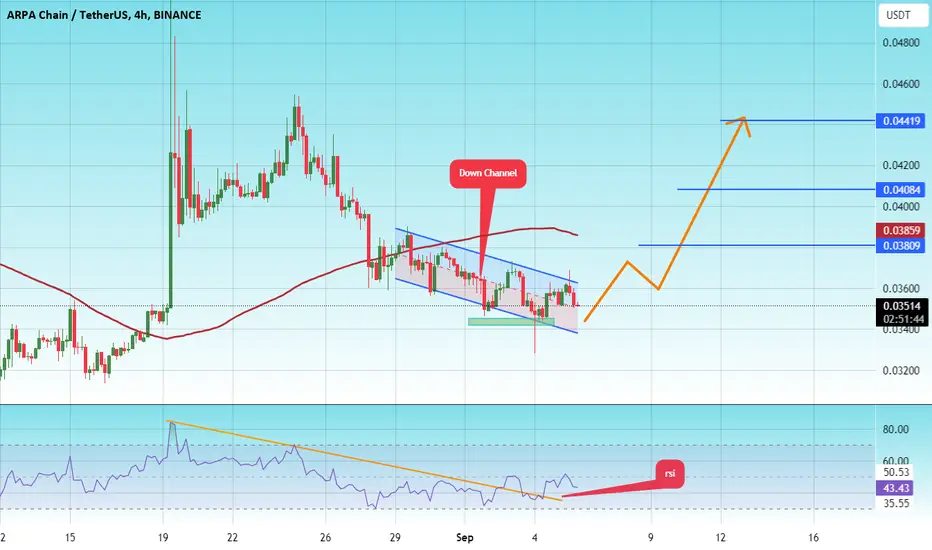
#ARPA/USDT#ARPA
The price is moving in a downtrend on the 4-hour frame and is about to break upwards
We have a trend to stabilize above the moving average 100
We have a downtrend on the RSI indicator that supports the rise by breaking it upwards
We have a major support area in green at a price of 0.03400
The price rebounded from it
Entry price 0.0350
First target 0.0809
Second target 0.04084
Third target 0.04420
Is #ARPA on the Verge of a Massive Breakout? Yello, Paradisers! Could #ARPA Be on the Verge of a Major Breakout? Here's What You Can’t Miss!
💎#ARPAUSDT is sitting at a critical demand zone of $0.03621, and we’ve been watching it closely as it forms a Falling Wedge pattern. This is a key setup, and we might be on the brink of a breakout. If momentum holds, we could be looking at a significant bullish move ahead.
💎For this bullish scenario to unfold, we need to see #ARPA break above the upper resistance of the wedge. If this breakout occurs, the next target is the internal resistance zone at $0.08388, potentially sparking a strong rally.
💎However, be cautious! If the demand zone fails to hold, a pullback could take the price to the lower support area around $0.02830. A daily close below this level would invalidate the bullish outlook and could lead to further declines.
Keep your focus sharp, Paradisers! This next move could be a real game-changer. Patience and discipline are your greatest allies when navigating market opportunities like these. Stay strategic and ready!
MyCryptoParadise
iFeel the success🌴

ARPA Technical AnalysisThe ARPA is currently in a well-defined downtrend, as indicated by the descending channel that has been guiding the price downward since early March. Currently, the price is consolidating on the support zone (Green) at $0.03499 - $0.03596, after a pull back from the $0.04539 level.
If the price breaks below this support zone (Green) at $0.03499 - $0.03596, it could potentially decline further, testing the next support level at $0.03047 and possibly moving down to the historical low support zone (Yellow) at $0.02264 - $0.02555. On the other hand, if the price manages to break above the resistance at $0.04539 and breach the descending channel's upper boundary, it may indicate the beginning of a bullish reversal. However, the overall trend remains bearish, and any upward move would need to be sustained by a significant increase in volume to confirm a true breakout.
Overall, the market is at a crucial juncture where it could either continue its downward trajectory or attempt a reversal. Traders should closely monitor the key support and resistance levels and watch for changes in volume to gauge the potential direction of the next move.

Potential Big Moves for ARUSDT: Bullish Continuation Ahead?
Yello, Paradisers! Are you ready for some potential big moves with #ARUSDT? Let’s dive into the analysis to see what’s brewing!
💎#AR is showing signs of a probable bullish continuation from a support zone at $29.112. We have observed #AR following a descending channel for a long time. Recently, after breaking above descending resistance, it’s restoring momentum at the key support.
💎If the price successfully holds momentum at this support level of $29.112, there is a great probability of a bullish ride, similar to previous behavior at this level. If #AR manages to break above the probable resistance at $38.347, it will likely target the next resistance zone and beyond.
💎However, if the price fails to hold momentum at the key support, we’re expecting a probable bullish rebound from the lower demand zone around $25.618.
💎It's vital to maintain vigilance and closely observe #AR price movements. A breakdown below the demand area, confirmed by a daily closure, would challenge the bullish scenario and could result in further declines.
Paradisers!Stay focused, patient, and disciplined, Paradisers!
MyCryptoParadise
iFeel the success🌴

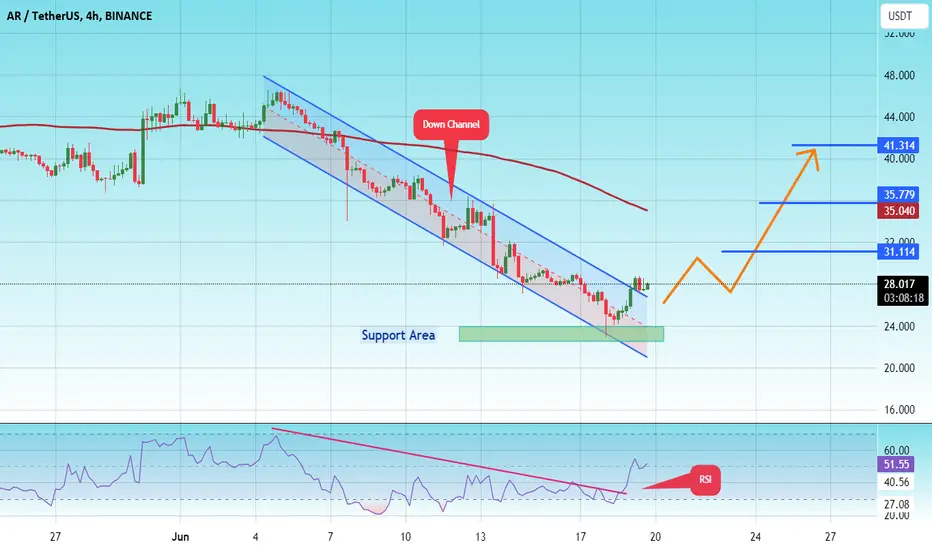
#AR/USDT#AR
The price is moving in a bearish channel on a 4-hour frame and is holding it strongly and is about to break it upward
We have a bounce from the green support area at 23.00
We have a tendency to stabilize above the Moving Average 100
We have a downtrend on the RSI indicator that is about to break higher and supports the rise
Entry price is 24.00
The first goal is 31.11
The second goal is 35.77
The third goal is 41.30