Blue Energy: BLU.AXWatchlist
Watching break of 7.5 level
Ascending triangle
Volume drop off
Trading above 21EMA
Ascending

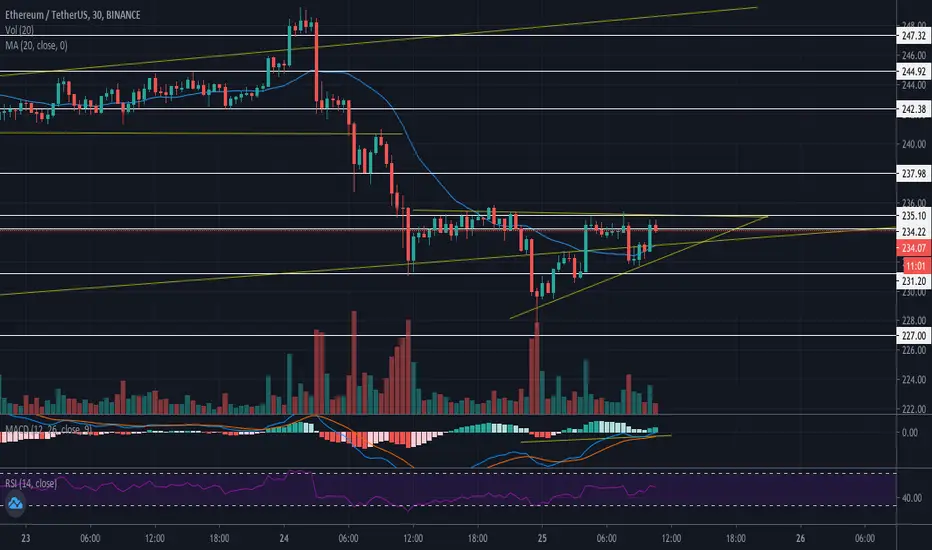
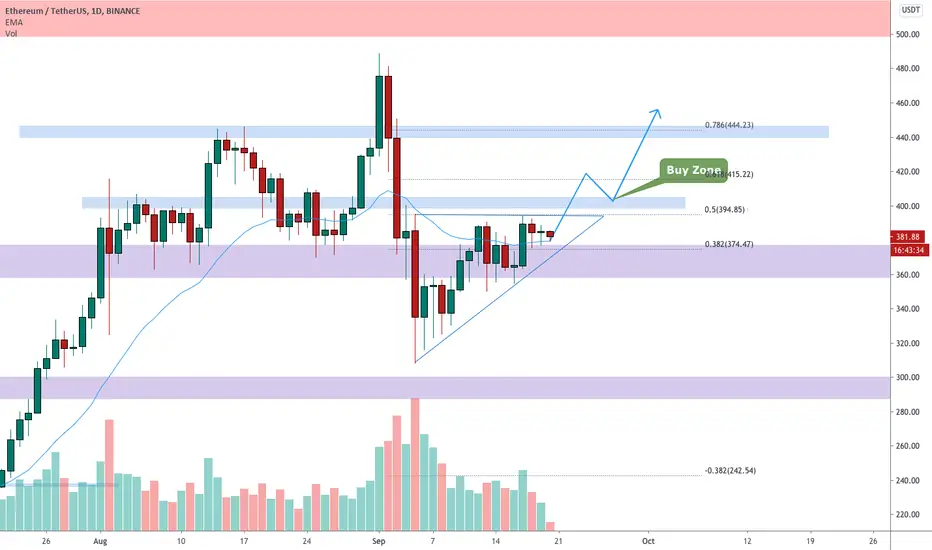
ETHUSDT is inside an ascending triangle 🦐ETHUSDT is inside an ascending triangle, and the price is testing 0.5 Fibonacci level and daily resistance.
IF the price will break the triangle and the daily resistance, and flip te resistance to support, According to Plancton's strategy, we can set a nice order
–––––
Follow the Shrimp 🦐
Keep in mind.
🟣 Purple structure -> Monthly structure.
🔴 Red structure -> Weekly structure.
🔵 Blue structure -> Daily structure.
🟡 Yellow structure -> 4h structure.
Here is the Plancton0618 technical analysis, please comment below if you have any question.
The ENTRY in the market will be taken only if the condition of Plancton0618 strategy will trigger.
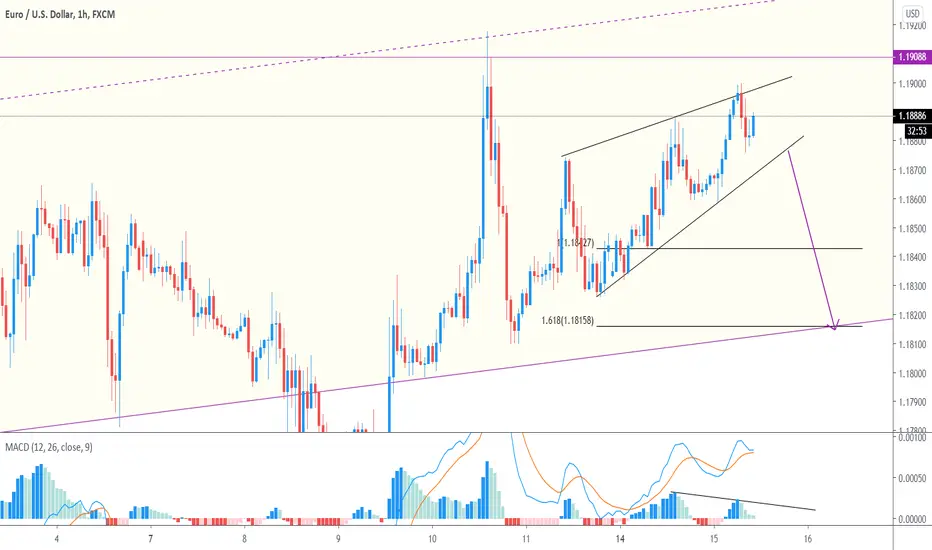
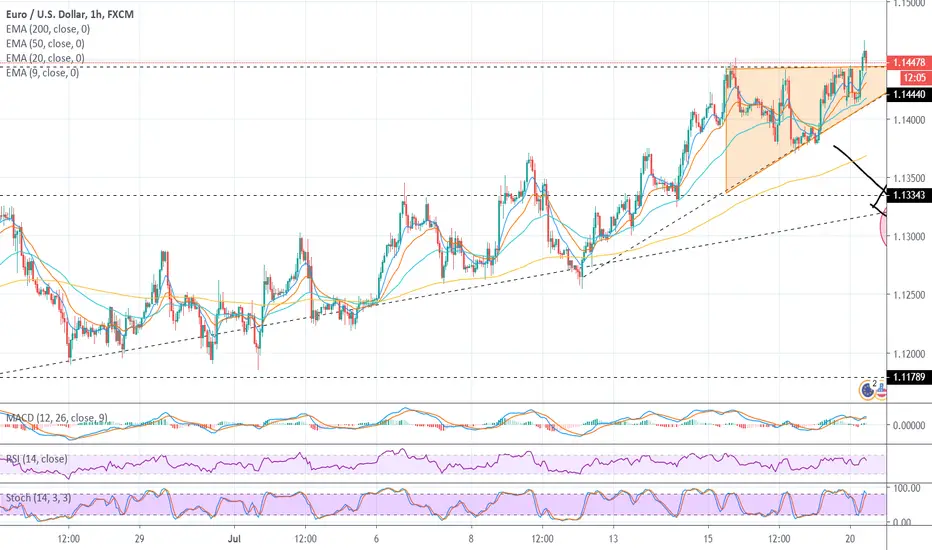
nice and simple short setup EURUSDthis one is nice and simple. A break of this structure gives Fib extension targets that sit directly on the daily channels bottom... Coincidence? i think not...
I'm looking for a break of this rising structure to confirm this trade. Not the biggest trade in the world, but will give a very tasty RRR is it does break and give entry.
Current 1 Day Chart Ascending Triangle is Starting to SolidifyAfter morphing back and forth between several different potential trendlines since it began forming, the 1 day chart's current ascending triangle pattern is starting to finally offer some clarity and solidity on which of those countless trendlines is most valid as the top and bottom trendlines of this triangle. Thanks to the recent close of yesterdays big red daily candle we now have a very convincing bottom trendline to work with. I have also drawn a dotted trendline connecting the wicks since it is still potentially a candidate for becoming a more valid bottom trendline...but as for now the solid one looks much more valid. For simplicity I have wiped the chart clean of any other trendline that no longer feels like a potential top or bottom trendline to this triangle.

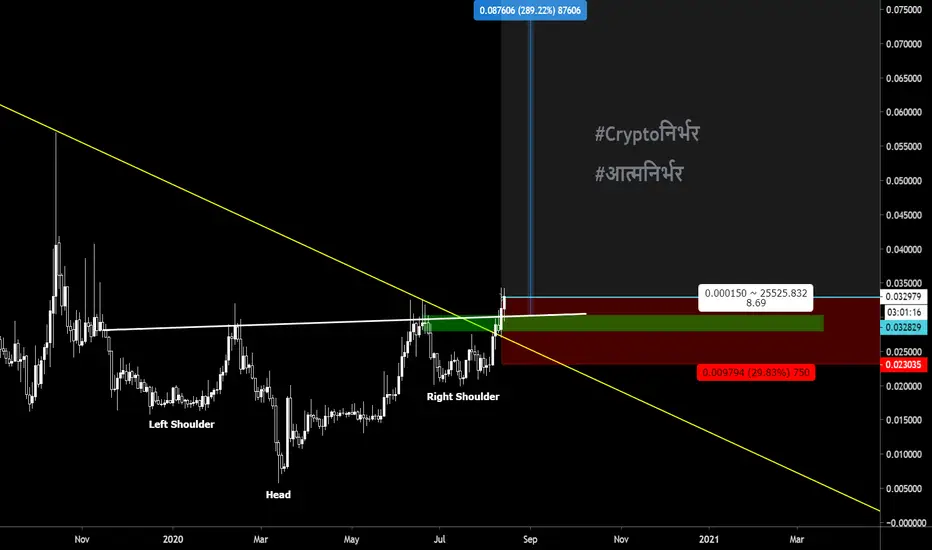
#NKN bought some!!! downtrend broken ✅
inverse Head & shoulder broken ✅
Ascending triangle broken ✅
Retest??? ✅ ✅ ✅ ✅ ✅ ✅
#notfinancialadvisor
#DoYourOwnResearch
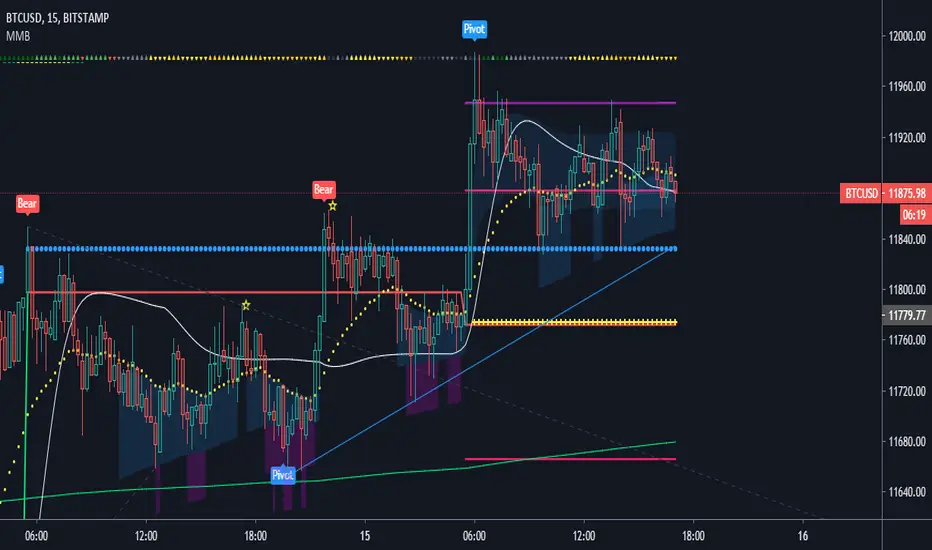
BTC forming nice ascending triangleBTC is forming a nice ascending triangle on 15 min TF, it should give breakout soon enough, will look for opportunities to go long :3
STMXBTC1D. Ascending Channel. STMXBTC 1D. Embarking its price action within the constraints of a neat ascending channel. Price has retraced to and closed at a reliable trade off Fibonacci level and within the bounds of the lower trend line. I have no idea what this coin does so I had best find out. Might get some rapid fluctuations with this coin...It's cheap! Buying here and setting a sell at the upper region of higher trend line.

LINKUSDT is growing 🦐LINKUSDT is growing! We are waiting for breakout and retest the previous resistance. According with Plancton's strategy we can set a long order.
–––––
Here is the Plancton0618 technical analysis, please comment below if you have any question.
The ENTRY in the market will be taken only if the condition of Plancton0618 strategy will trigger.
#ETHBTC - about to breakout Updated chart from may, targets are done time for next setup
Ethereum has already broken out of ascending triangle on daily on USDT pairs, expecting ETH/BTC to break soon as well.
#notfinancialadvisor
#DoYourOwnResearch
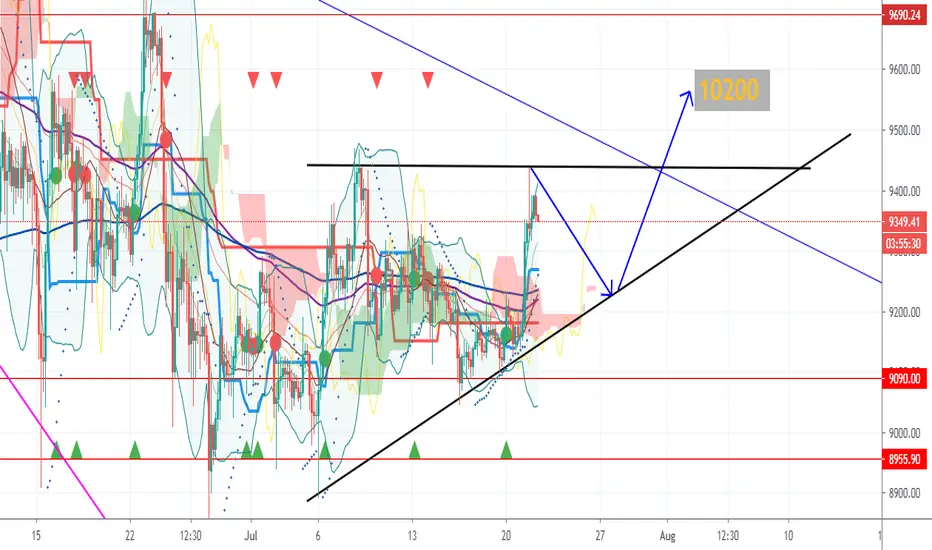
BTC in Ascending wedge BTC has broken the resistance line and now is Bulish!
Daily candle is above the EMA and BTCUSDT is in Ascending Wedge.When BTC in Bulish way can clear the Top Horizontal Line of wedge It can touch the 10.2.
Take more Profit
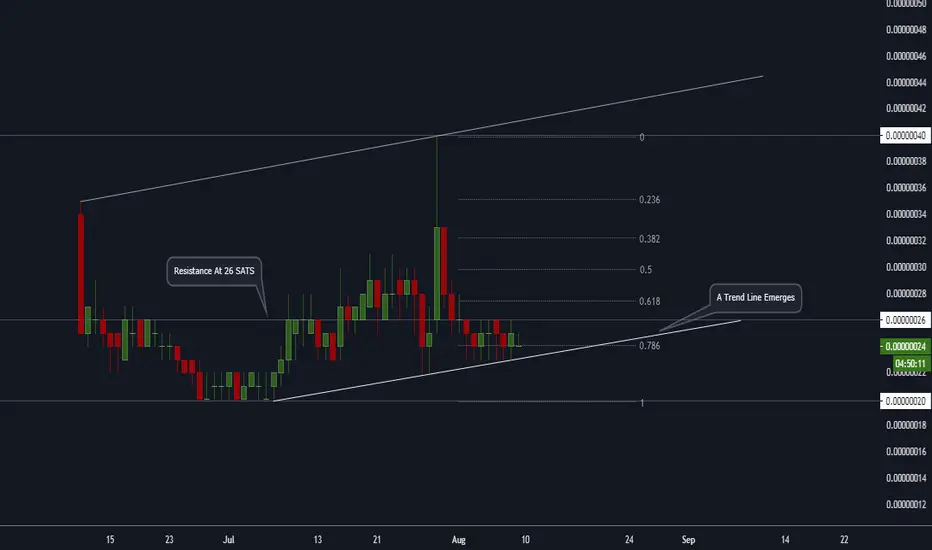
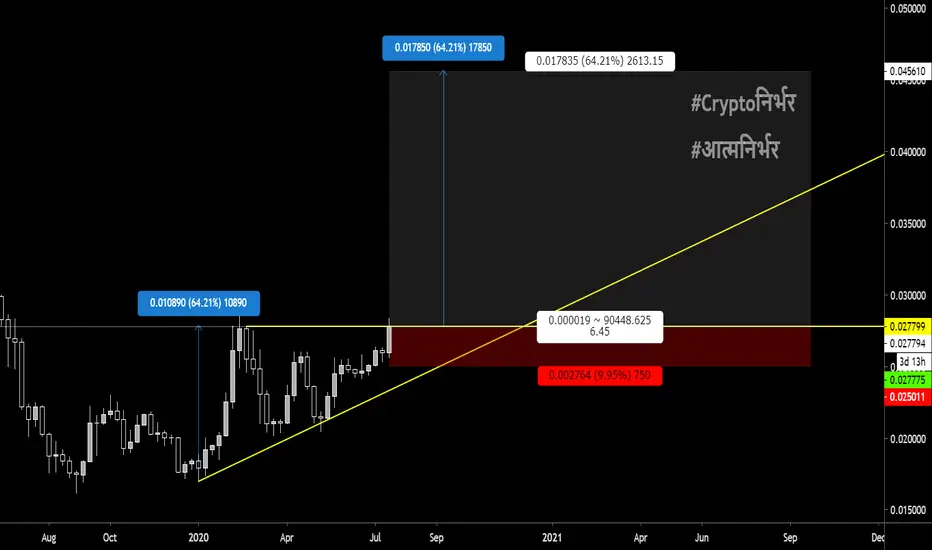
#ZEL inside an ascending triangle, once we break & close above 511 there is literaaly no resistance for us! so skys the limit!!
#notfinancialadvisor
#DoYourOwnResearch
EURUSD Ascending TriangleThis ascending triangle has formed on the EURUSD chart.
A break out through the resistance looks like it has happened.
Now just to wait for the retest.
SL will be just under the resistance and TP will be the length of the largest point of the triangle.
Although we may take some profit before that happens to to guaranty our self some pips.
Ignore the arrows, that was my previous plan if price acted differently.
Stay tuned.
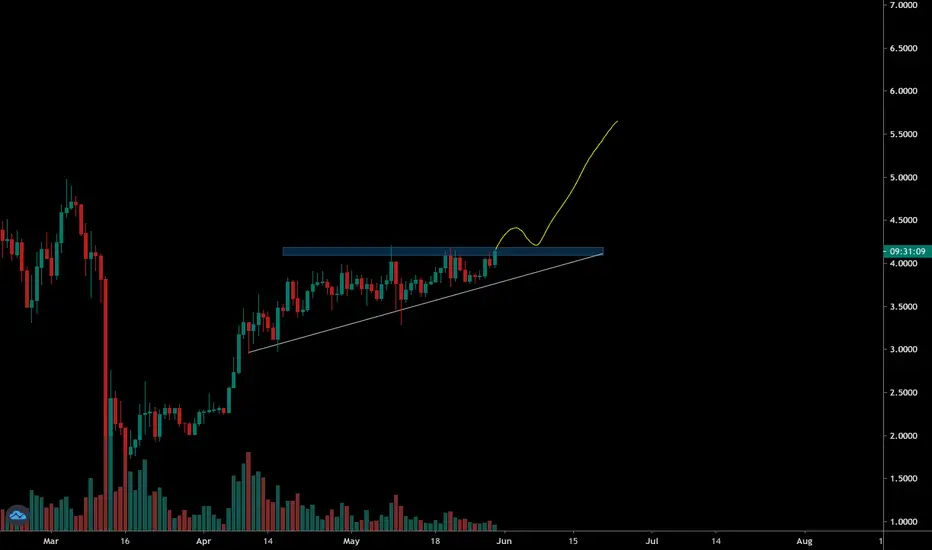
Forming a bullish Ascending TriangleCOINBASE:LINKUSD
I see a break of $9 by tomorrow or Monday. This has done many ascending triangles in the past and hasn't failed yet.
What you think?

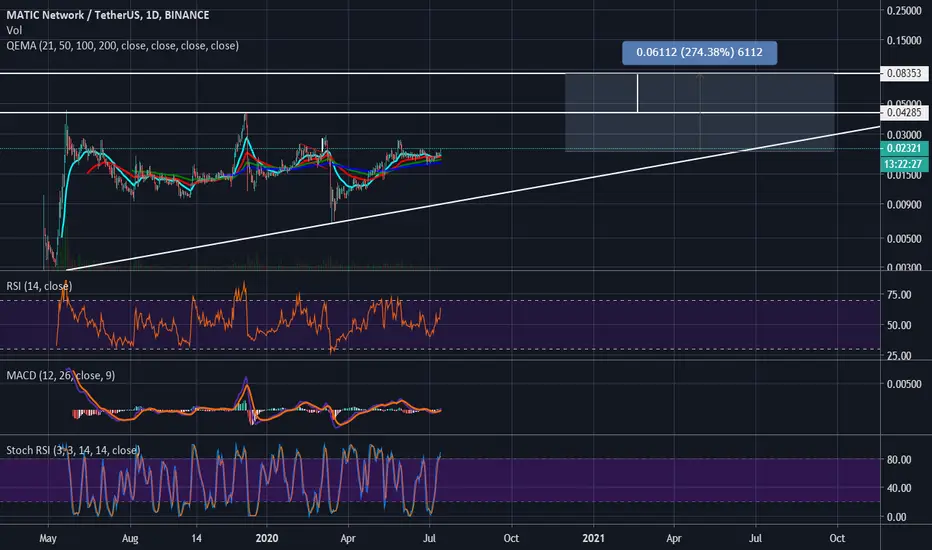
Matic Network the sleeping giant!Matic EMAs are bullish in fact the 21 just retested the 50 1D EMA, all the other indicators look just as amazing. Stoch RSI is erect, MACD has crossed over and is bullish, RSI is erect and pointing toward the moon. Matic printing a huge ascending bullish triangle.
Matic tokens have been moving into staking lock ups, less supply in the market to keep the price down. Matic has finished their Mainnet and Dapps are flooding over. Chandresh, head of marketing and Strategy has hinted that something big is coming for Matic holders. Ethereum needs Matic to enable mass adoption.
So much more to come. .04825 first major target .08350 major break out of the ascending bullish triangle.
Aztec the Eye
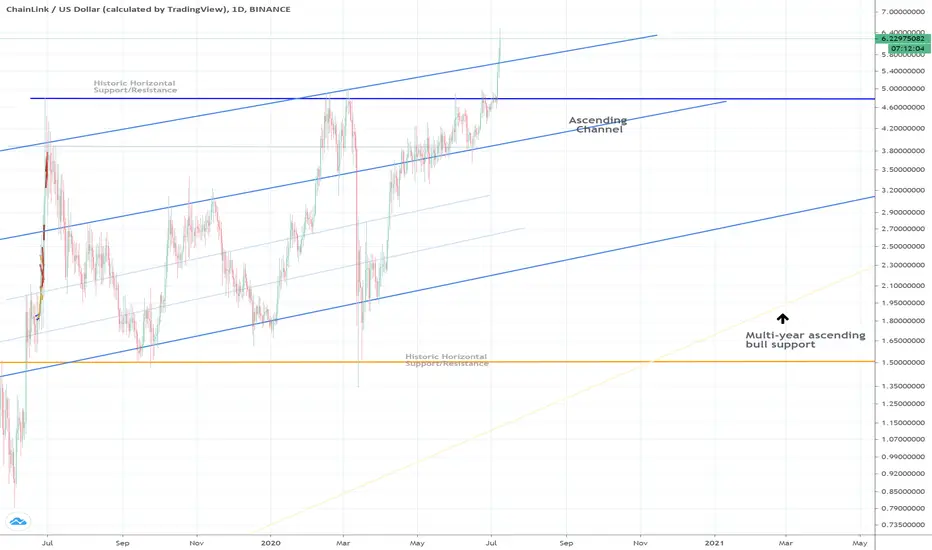
LINK breather with potential entry opportunity @ $5.60, $4.80Quick update, tremendous showing by LINK! We shattered through the previous all time high after numerous failed attempts to do so over this year. Things look extremely bullish for LINK, just keeps gaining momentum.
Order books seem to be dwindling some, suspect a pullback soon but still very bullish. (Captured on vcdepth.io)
While I don’t know how high it’s going to go, some strong support seems pretty clear. On pullback we have a strong chance of finding support in the $5.60 area based on emerging upper ascending channel trend line. We could pull back to establish the old ATH as support as a likely worst case, that of course is around the $4.80ish area.
It seems like we have a potential alt-season in the making but keep an eye on BTC which is struggling to reach above a 3 year descending trendline. Really the global order books are extremely healthy right now but until BTC shakes this resistance I worry BTC could pullback hard enough to make the whole market bleed pretty good. It would be this scenario that would lead me to believe LINK could test $4.80
I am setting limit buys @ $5.60 and larger add to my position at $4.80 should we see these prices come to fruition.
I really don’t have much to go on to identify a high, we are in uncharted territory and our trajectory keeps changing/progressing. This reminds me a lot of Ethereum action at the time when it was in this price range. I also feel the Chainlink project is just as big of deal as its host chain, Ethereum. That said, LINK with a $6B Marketcap and Ethereum with nearly $28B, its not a far stretch to see LINK catch up with nearly 5x gains from here. Presumable if LINK rises 5x, ETH will also see substantial increase in valuation but it would be interesting to see an Ethereum asset become more valuable than the Ethereum chain itself.
This is not investment advice, DYOR
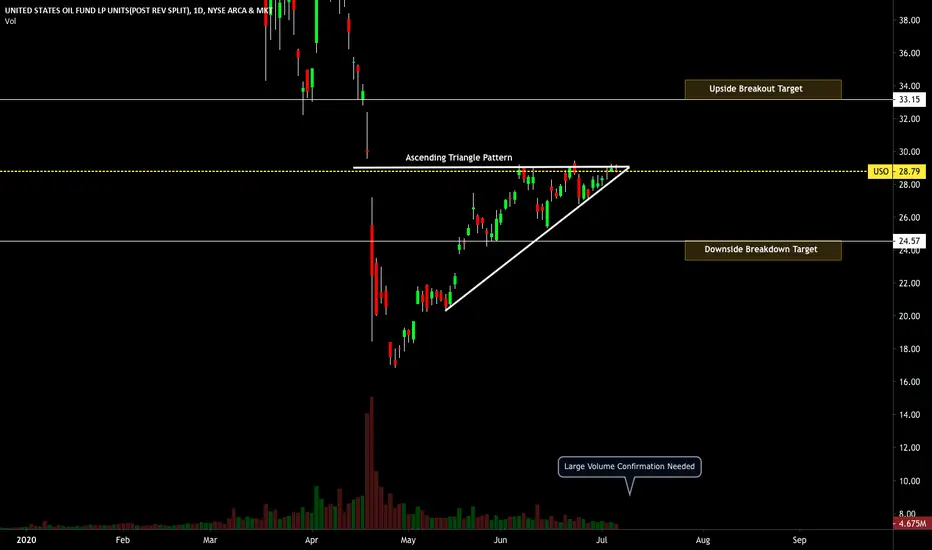
$USO ETF Ascending Triangle Pattern$USO (United States Oil ETF) is currently in a Ascending Triangle Pattern and is near a breakout/breakdown point.
Upside Breakout Target: $33 to $34.
Downside Breakdown Target: $24.50 to $23.50.
Large Volume is needed to confirm the breakout or breakdown.
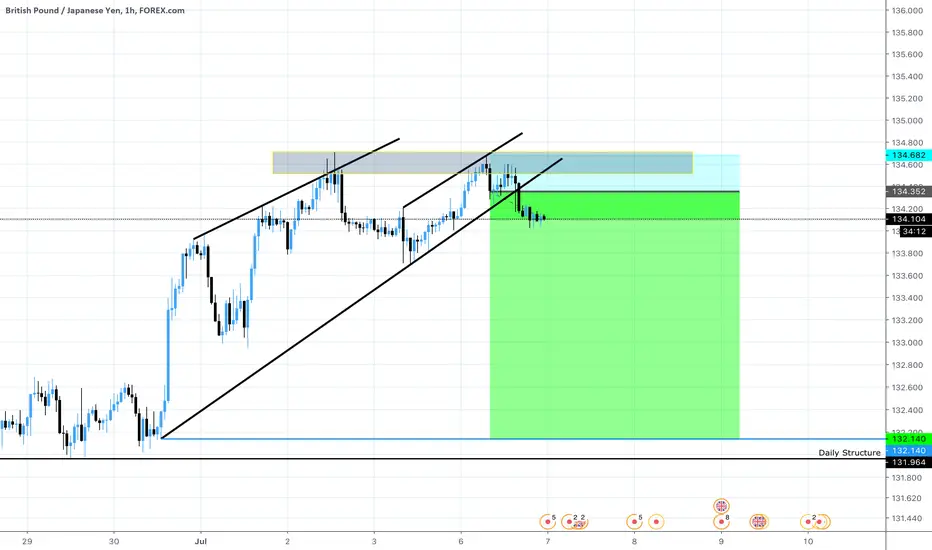
GBP/JPYGBP/JPY
-
Sell
-
Market execution
-
We have seen the creation of an ascending structure with three upper trend line touches
-
A move downwards from the upper structure has created another bearish flag at the channel lows
-
Price has creeped up to the first significant structure and is now rejecting the level on the H1 timeframe
-
This confluence is enough to enter with stoploss set above previous highs
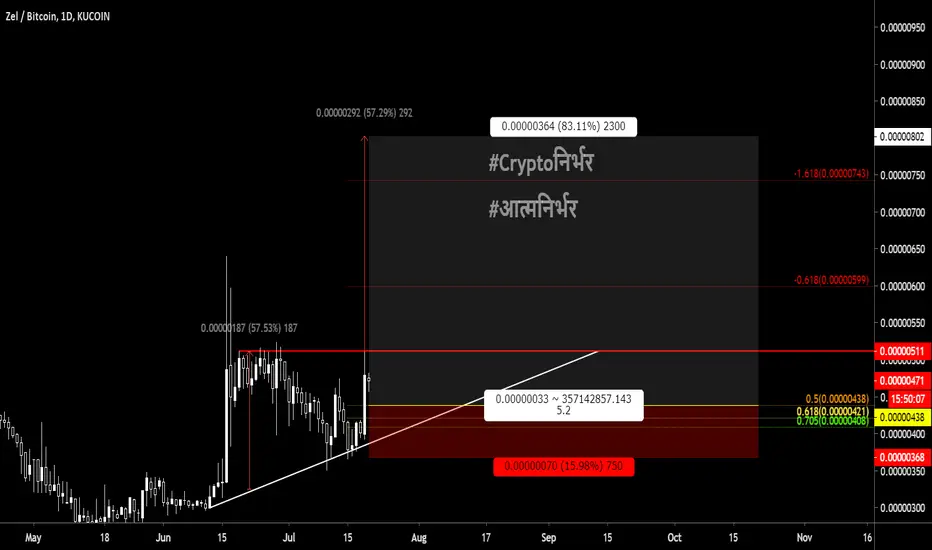
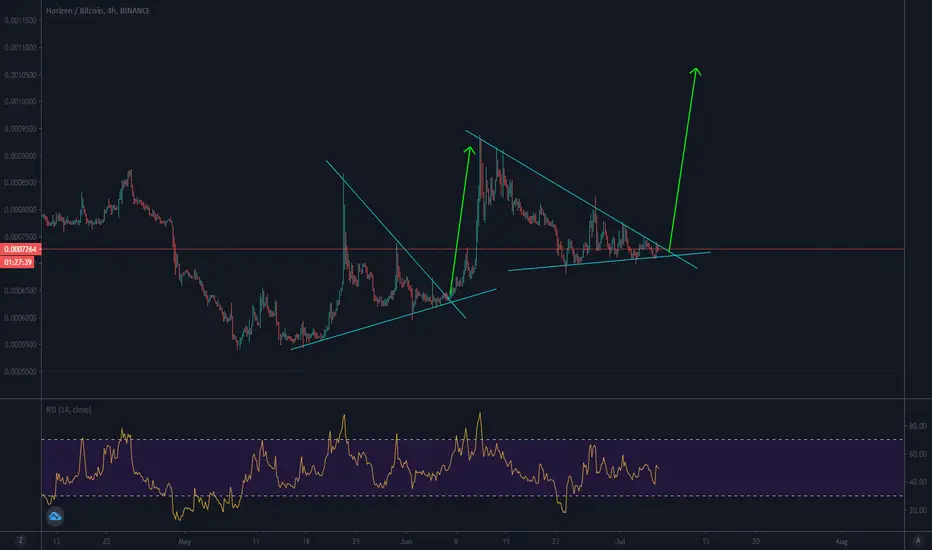
Another ascending triangle forming at ZEN/BTC (LONG)There is another ascending triangle forming at ZEN/BTC so its a safe bet at this price level.
Let me know if you've got feedback! Always eager to learn!
Thank you.
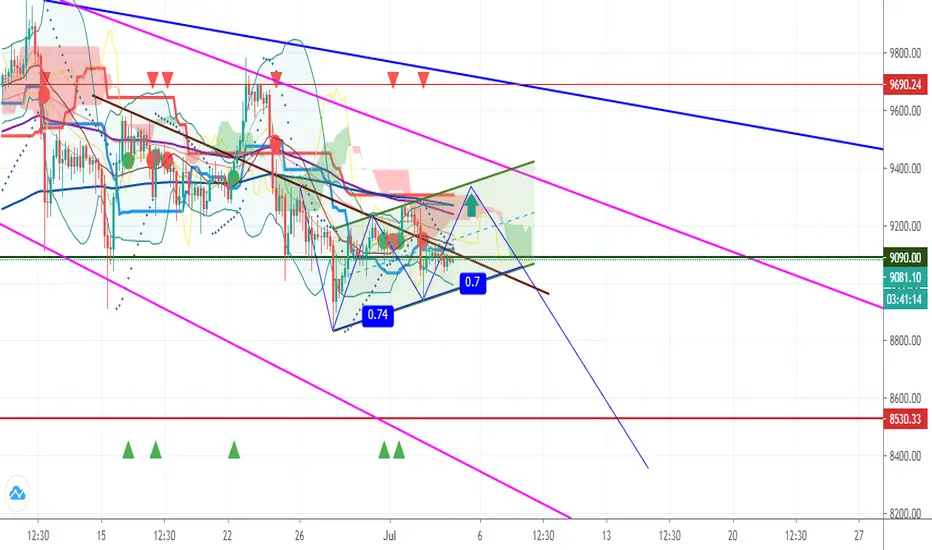
BTC Ascending channel in Short Term and Descending in midTermHello
BTC is in Ascending Channel in Short Term with very low capacity.
It might growing up in this channel and touch the 9.2-9.4 Area and again breaking down to major descending channel.
The first step in descending Channel might be in 8.2-8.5 area.
So be carefull in your traid.
ethusdtclearly there is a ton going on. for those that know, know whats going on. whats understood dose not need to be said.