GOLD → Consolidation. News. False breakdown. Growth?FX:XAUUSD and TVC:DXY in consolidation ahead of important news and Trump's speech. Economic risks are rising and the future outlook depends on fundamental data...
Trade tensions support gold demand. Trump may impose global tariffs of up to 20% which will increase risks to the economy. Investors are piling into gold in anticipation, pushing its price to a record $3,150
A key factor is the details of the tariffs. If tariffs are softer than expected, gold could fall to intermediate support zones. If the trade war escalates, the rise could continue beyond 3150
Economic risks are rising and gold may test 3107 - 3100 support before rising further. Technically, 3100 - 3107 is a zone of interest and liquidity. If bulls hold the support, gold will continue to rise. Otherwise, gold may form a correction towards 3075 - 3065
Resistance levels: 3126, 3135, 3147
Support levels: 3107, 3100, 3091
The price is correcting to consolidation support in the moment. A strong and sharp fall is fraught with the risk of a liquidity grab and a false breakdown. In this case, gold may strengthen to one of the key resistances. But the further and medium-term development of events depends on the evening news....
Regards R. Linda!
Ascending Channel

GOLD → The rally is intensifying. Growth after false breakdownFX:XAUUSD is breaking upwards and is trying to consolidate above the previous high of 3127 as part of a correction. This would be an ideal support for the bulls. The rally, on the background of political and geopolitical problems only intensifies
Tariff escalation pushes up gold demand. Trump rejected the idea of lowering tariffs and the Treasury Secretary named a list of 15 countries that fall under the new measures. This has caused the dollar to weaken and fears of stagflation to rise, boosting demand for gold as a protective asset.
Central banks and investors continue to build positions in gold, but corrections are possible before the tariffs announcement on April 2 and the release of U.S. economic data
Technically, we have a strong bullish trend, it is risky to sell, we are looking for strong areas or levels to buy. For example, if the price consolidates above 3127, or after a false breakdown of 3119 / 3111
Resistance levels: 3147, 3155, 3166
Support levels: 3127, 3119, 3111
Before the continuation of the growth there may be a correction to the key support areas to normalize the imbalance in the market as well as to capture the liquidity. Consolidation above the level after a false breakdown will be a good signal for growth.
But! News ahead and high volatility is possible!
Regards R. Linda!

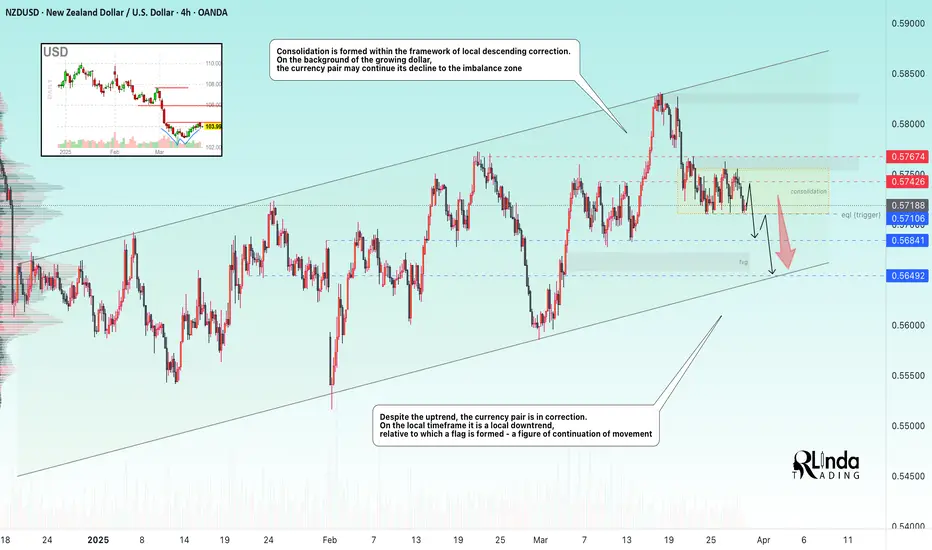
NZDUSD → Consolidation within the correctionFX:NZDUSD is forming a local correction on the background of the uptrend. The dollar has been consolidating and strengthening for the last week, which generally creates pressure on the forex market
NZDUSD after a false break of the trend resistance, which also coincided with the stopping of the strong decline of the dollar, entered the correction phase. Locally, it is a downtrend, followed by consolidation, which in general forms a flag - a figure of continuation of the movement.
The chart reveals strong levels that can be paid attention to. The dollar may continue its growth due to the US policy, which generally has a negative impact on the market.
The price exit from the current consolidation may be accompanied by a strong impulse. Emphasis on 0.575 - 0.571.
Resistance levels: 0.57426, 0.57674
Support levels: 0.571, 0.5684
After stopping at 0.571, the price is not pulling back, but forming consolidation on the background of the local downtrend. Most likely a big player lures the crowd to get to the imbalance zone or trend support at their expense.
Regards R. Linda!
GOLD → Growing economic risks increase interest ↑FX:XAUUSD rallied aggressively due to high interest driven by rapidly rising economic risks, mainly related to Trump's tariffs. For selling, the risk is very high, with the stock and cryptocurrency market declines only adding to the interest in the metal
Markets are taking refuge in defensive assets amid WSJ reports of Trump's possible tariff hike of up to 20% for most US trading partners. This could trigger inflationary pressures and stagflation, weakening the dollar and bond yields, which supports the gold price.
This week all eyes are on Trump's speech on Wednesday, PMI, NonFarm Payrolls and Powell's speech
Technically, it is not worth selling now as it is high risk, and for buying we should wait for a correction to key support levels
Resistance levels: 3127
Support levels: 3103, 3091, 3085
We are not talking about any trend reversal now. It is worth waiting for a local correction or consolidation, the market will mark important levels, liquidity zones or imbalances against which you can build a trading strategy. Gold will continue to grow because of the strongly increasing risks.
Regards R. Linda!

How low will it go? The S&P Bear MarketI don't believe the market has bottomed yet. There is more to come.
Trump's tariffs will continue to cause uncertainty and as economic figures confirm a US slowdown, stock markets could fall further.
From a technical perspective, I will be looking to buy between 4700 and 5200. This is based on evident weekly horizontal levels, bullish channel support, and 100 and 200 SMA's.
VANTAGE:SP500 PEPPERSTONE:US500 ICMARKETS:US500 OANDA:SPX500USD

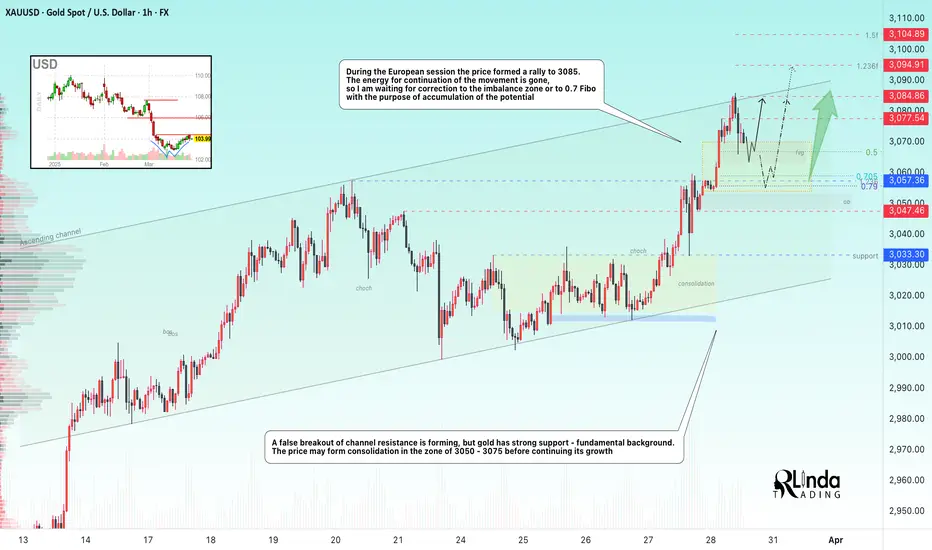
GOLD → Correction after a false breakout. A reversal?FX:XAUUSD is forming a false break of the channel resistance within the rally, we should wait for a correction, but not for a trend reversal. Let's see what we can expect from the price in the short and medium term.
Gold is reacting to market turmoil over Trump's tariff plans. Investors are looking for protection ahead of the possible imposition of new duties from April 2, boosting demand for the metal
Fears of a trade war and a slowing global economy are supporting gold despite positive US GDP data. PCE data and tariff updates will be key catalysts for further movement. Higher inflation could dampen the rally, while weak data will reinforce bets on a Fed rate cut, helping gold to rally further.
The energy to continue the move is gone, so I am waiting for a correction to the imbalance zone or to 0.7 Fibo to accumulate potential. The price may consolidate in the zone of 3050 - 3075 before it continues its growth
Resistance levels: 3075, 3085, 3095
Support levels: 3059, 3055
The correction after a strong rally can be quite deep. The imbalance zone 3066 - 3063 and liquidity zone 3057 play an important role. False breakdown of support may resume growth.
Regards R. Linda!
15-Min Bitcoin Setup – Quick Scalping Opportunity?First of all, I must say that this is a short-term analysis in a 15-minute time frame . Please be careful .
Let's take risks while respecting capital management. Be sure to respect capital management.
Bitcoin ( BINANCE:BTCUSDT ) is currently trading in the support zone($84,120_$81,500) , Potential Reversal Zone(PRZ) near the lower line of the ascending channel .
In terms of Elliott Wave theory , it seems that Bitcoin could complete its 5 bearish waves near the lower line of the ascending channel .
Also, we can see the Regular Divergence(RD+) between Consecutive Valleys .
I expect Bitcoin to be able to rise to at least $85,400.
Cumulative Short Liquidation Leverage: $86,397_$85,760
Cumulative Long Liquidation Leverage: $84,262_$83,336
Note: One of the reasons for Bitcoin's decline is the decline in US indices such as CME_MINI:NQ1! , SP:SPX , and TVC:DJI .
Note: If Bitcoin falls below $83,000, we can expect more dumps.
Please respect each other's ideas and express them politely if you agree or disagree.
Bitcoin Analyze (BTCUSDT), 15-minute time frame.
Be sure to follow the updated ideas.
Do not forget to put a Stop loss for your positions (For every position you want to open).
Please follow your strategy and updates; this is just my Idea, and I will gladly see your ideas in this post.
Please do not forget the ✅' like '✅ button 🙏😊 & Share it with your friends; thanks, and Trade safe.

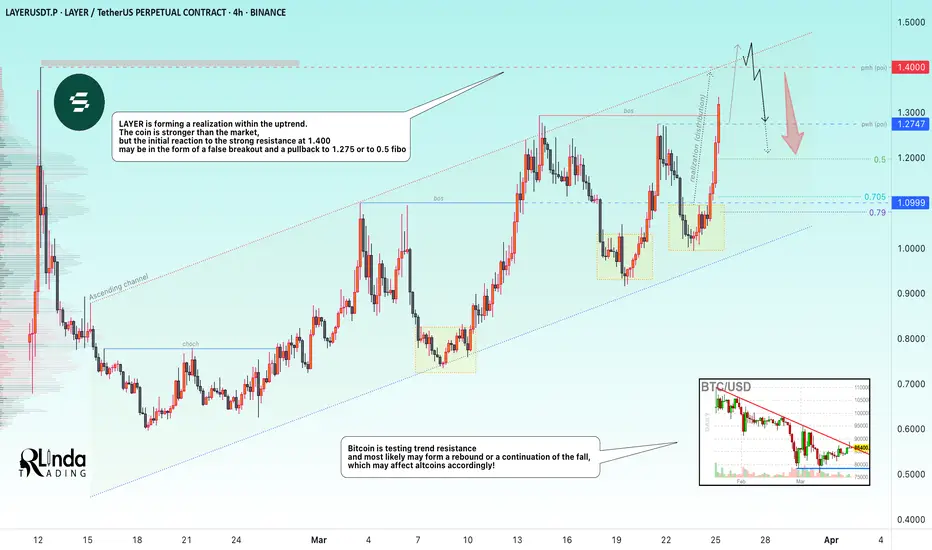
LAYERUSDT → Far retest of key resistance at 1.400BINANCE:LAYERUSDT.P is forming a realization within the uptrend. The coin is stronger than the market, but the initial reaction to the strong resistance at 1.400 may be in the form of a false breakout and a pullback to 1.275 or 0.5 fibo
Since the opening of the session, LAYERUSDT has passed the daily ATR, but after reaching the resistance, the coin may not have the potential to continue rising. Liquidity above the 1.400 level may hold this area and prevent the coin from breaking through this zone the first time around.
Bitcoin is testing trend resistance at this time and could likely form a rebound or a continuation of the decline, which could affect altcoins accordingly!
Resistance levels: 1.400
Support levels: 1.2932, 1.2747, 0.5 fibo
BUT ! Everything depends on the price reaction at 1.400. A sharp and distributive approach with 90% probability will end in a false breakout and correction to the mentioned targets.
But, if LAYER starts to slow down and consolidate in front of the level, an attempt of breakout and struggle above 1.400 is possible and further movement will depend on it.
Regards R. Linda!
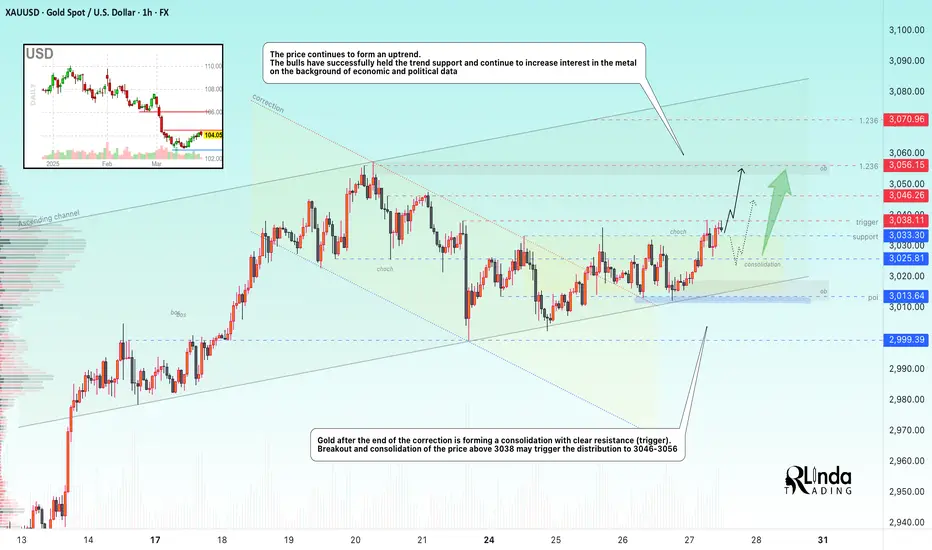
GOLD → Consolidation forms a trigger. Rally?FX:XAUUSD continues to rise amid weakening dollar demand due to Trump's imposition of new tariffs. GDP and Initial Jobless Claims ahead
Gold is further supported by renewed concerns about a slowdown in the US economy due to trade duties. However, growth beyond ATH remains questionable due to geopolitical nuances.
The market focus shifts to macroeconomic data: the final US GDP for the fourth quarter and jobless claims will be released today. Also the attention will be drawn to the speeches of the Fed representatives, who earlier made it clear that they are in no hurry to cut rates due to inflation risks caused by Trump's tariff policy
Resistance levels: 3038, 3046, 3056
Support levels: 3033, 3025
The strong resistance is 3038. Breakdown and price consolidation above this level will provoke continuation of growth (there is a chance of ATH retest). But, since there is news ahead, gold may test the zone of interest and liquidity 3030-3025 before further growth.
Regards R. Linda!
Bitcoin - Why is everyone wrong + Magic Moving AverageWe have so many warning signs that Bitcoin is going to crash significantly in 2025/2026. One of them is this magic 20-weekly moving average. As we can see, the price always respects this dynamic level, and if the price falls below it, it triggers a sell signal. On the other side, if the price rises above it, it triggers a buy signal. The price is currently below it, so this is a bearish signal.
The next bad signal is this Elliott Impulse wave. What we can see here is a perfect textbook impulse wave that has been completed. If you are an Elliott Wave trader, you already see that this is a big problem. After such a wave is complete, we are always looking for an ABC correction with a fibonacci retracement tool. Use only these 3 Fibo levels, others do not work properly! Specifically, 0.618 FIB, 0.500 and 0.382 FIB. Bitcoin loves the 0.618 FIB, so there is a pretty huge chance of going down to 32k. But expect a very strong bounce from the 0.382 FIB as well, which is at 52k. Set up your buy orders here, and thank me later!
What we can also see on the chart is an unfilled Fair Value Gap (FVG) between 34k and 28k. Often the price loves to come back and test these important price actions. This is a great buying confluence with the 0.618 FIB because the FVG is inside this Fibo level.
The last thing I want to talk about is this huge blue ascending channel on the weekly chart. This is a representation of this whole uptrend (bull market). You may say that Bitcoin is bullish until this channel holds, yeah, but what we do here is we predict future price action and give you technical analysis. I am giving you this information in advance so you can prepare for the future!
Write a comment with your altcoin + hit the like button, and I will make an analysis for you in response. Trading is not hard if you have a good coach! This is not a trade setup, as there is no stop-loss or profit target. I share my trades privately. Thank you, and I wish you successful trades!

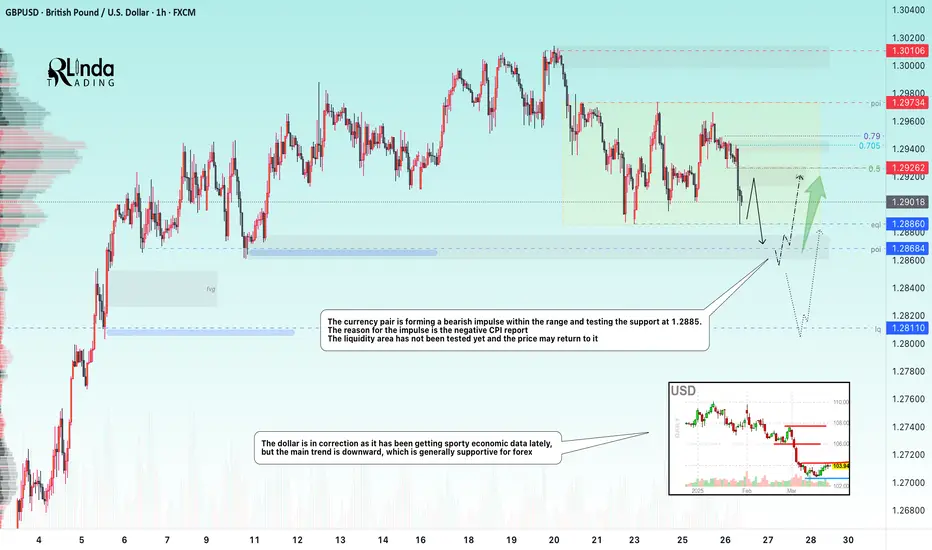
GBPUSD → Correction to the liquidity zone. Waiting for a FBFX:GBPUSD gets a negative CPI report in the early session and tests key support, but failing to reach the liquidity area a rebound is formed. The pair is in consolidation...
The CPI report provoked a small liquidation in the market, within the framework of which the price tested one of the key supports at 1.2886, but the price did not enter the liquidity area, i.e. technically the chances to return to this area are quite high.
A correction to the imbalance zone is being formed, from which the decline may continue. In the short term I am interested in 1.2868, which can still hold the market and form a bullish impulse.
Resistance levels: 1.2926
Support levels: 1.2886, 1.2868, 1.2811
False break of the global range support at 1.2868 may trigger a rebound to 1.2926. I do not exclude a deeper correction to the support from D1, for example to 1.2811 from which, against the background of the bull market, we can wait for an upward correction.
Regards R. Linda!
Bitcoin’s Next Challenge – Can BTC Break the Heavy Resistance?Bitcoin ( BINANCE:BTCUSDT ) started to rise from the Support zone($84,120_$81,500) as I expected in the previous post . The question is, can Bitcoin break the Heavy Resistance zone($93,300_$89,200) and Resistance lines ?
Please stay with me.
Bitcoin appears to have broken through the Resistance zone($87,100_$85,800) and is preparing for its first attack on the Heavy Resistance zone($93,300_$89,200) .
In terms of waves, Bitcoin appears to be completing microwave 4 of microwave C of the main wave Y . The waves structure inside the Ascending Channel appears to be of the Double Three Correction(WXY) .
I expect Bitcoin to prepare for its first attack on the Heavy Resistance zone($93,300_$89,200), the upper line of the ascending channel , the monthly pivot point , 50_SMA(Daily) , and the Resistance lines after completing the pullback to the Resistance zone($87,100_$85,800 ) and fill first CME Gap($86,640_$86,520) . I think the Potential Reversal Zone(PRZ) could be the zone to start a new decline for Bitcoin.
I chose the label of this analysis ''SHORT'' because I think Bitcoin is in a bit of a risky zone for a LONG position, what do you think?
Note: If Bitcoin goes over $91,000, we can expect more pumps.
Note: If Bitcoin falls below $85,200 before hitting the Heavy Resistance zone($93,300_$89,200), we can expect further declines.
Please respect each other's ideas and express them politely if you agree or disagree.
Bitcoin Analyze (BTCUSDT), 2-hour time frame.
Be sure to follow the updated ideas.
Do not forget to put a Stop loss for your positions (For every position you want to open).
Please follow your strategy and updates; this is just my Idea, and I will gladly see your ideas in this post.
Please do not forget the ✅' like '✅ button 🙏😊 & Share it with your friends; thanks, and Trade safe.

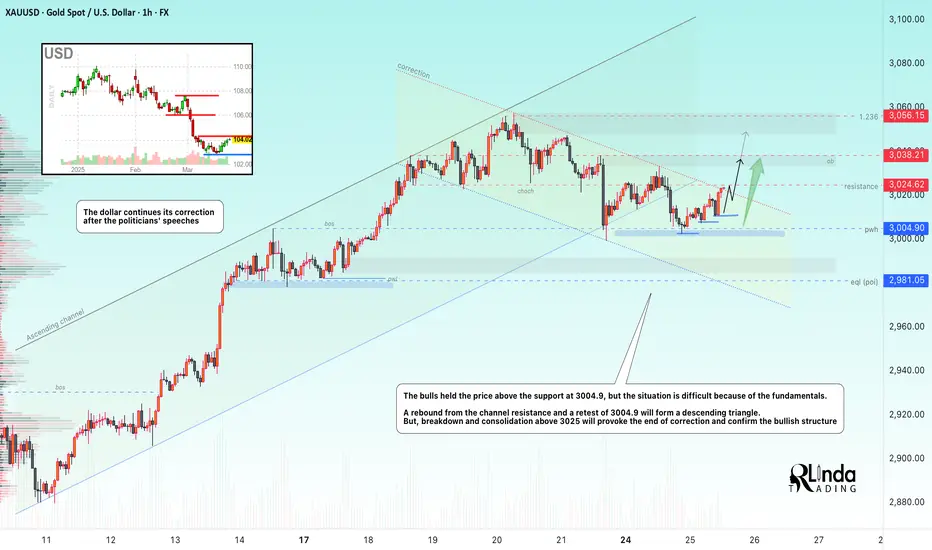
GOLD → Tense fundamental environment and retest of 3025FX:XAUUSD is forming a correction within the descending channel. The situation is becoming complex and confusing. The focus is on the channel resistance and on the support at 3004.9. Further price movement depends on the fundamental data...
The problem is the uncertainty around the US tariff policy and the outcome of talks between Russia and the US on ceasefire in Ukraine.
The market is focused on US consumer confidence data and comments from Fed officials. The rise in the dollar, supported by Bostic's hawkish statements and strong PMIs, is pressuring gold, but the lack of clarity on tariffs and geopolitical tensions are limiting its further decline
Technically, the situation is simple in that it all depends on the resistance of the current channel. A break and consolidation above 3025 will trigger growth. A false break of the channel resistance will provoke a continuation of the decline both to 3004 and to 2980.
Resistance levels: 3024.6, 3038, 3056
Support levels: 3004.9, 2987, 2981
Based on the difficult fundamental environment, which is far from any positive decisions, the tensions in the Middle East, and the tariff war, I can conclude that gold will try to strengthen once again, as we have technical support: a strong bullish trend, a strong 3004 level, and a cascade of locally rising lows.
A failed breakdown will be false and in this case, a price consolidation under 3017 will trigger a fall to 3004.
Regards R. Linda!
EURUSD → Price is in consolidation. Emphasis on false breakdownFX:EURUSD is forming a correction within the consolidation that was formed on the uptrend. The reason for the consolidation is the halt in the movement of the dollar index...
The dollar is forming a counter-trend correction due to political and econmoic data, but the general background is bearish. But, the fall of the dollar, to which the index may soon return, may strengthen the growth of the currency pair. EURUSD consolidation within the uptrend (against the background of the dollar index correction). The zone of interest is the support at 1.078 and the imbalance area
Resistance levels: 1.078, 1.074
Support levels: 1.0936.1.1009
The price has not tested the support and is forming a correction to the imbalance zone 1.087 - 1.09 from which the price may return to the downward movement to 1.078. The emphasis is on the range support from which we should wait for a false breakdown before further growth.
Regards R. Linda!

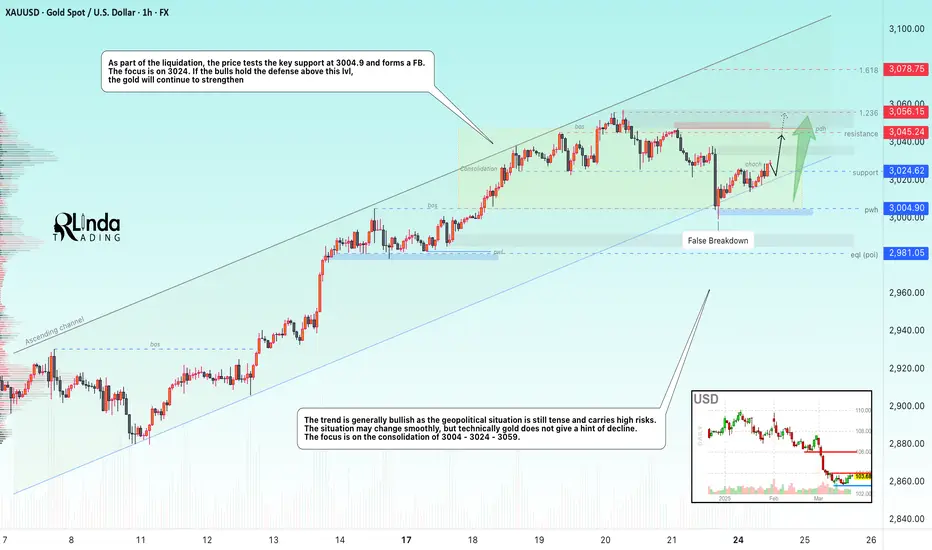
GOLD → Long squeeze (false break of uptrend support) FX:XAUUSD within the liquidation the price is testing the key support at 3004.9 and forms a false break of support. The trend is generally bullish as the geopolitical situation remains tense and carries high risks.
Friday saw a liquidation phase relative to the consolidation at 3024-3045. Reason: the White House is expected to revise tariff policy, easing measures against key trading partners. Negotiations over the conflict in eastern Europe, where the U.S. is a key link, also support the positive sentiment. On Monday, market attention will focus on Russia-US talks, as well as preliminary PMI data that could affect the global economic outlook.
The focus is on the current consolidation and the 3024 level. If the bulls hold their defenses above this level, gold will continue to strengthen.
Resistance levels: 3045 - 3056
Support levels: 3024, 3004
The growth within the bullish trend may continue. The price is forming a consolidation between trend support and resistance at 3024. The emphasis is on 3024, if the bulls hold the defense over this zone, gold may head for a retest of the high (the initial reaction to ATH may trigger a pullback down)
Regards R. Linda!
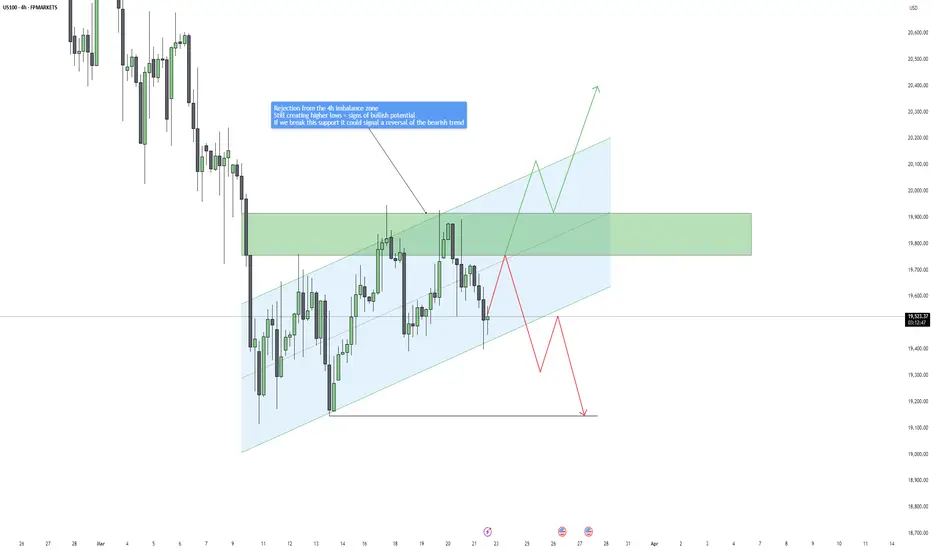
US100 - Testing Key Resistance: Will the 4H Trend Reverse?Market Structure & Trend Overview
The Nasdaq (US100) has been in a 4-hour uptrend, forming a series of higher lows and respecting an ascending channel after a prolonged bearish trend. This structure suggests that buyers are stepping in, and momentum may be shifting in favor of the bulls. However, the index remains at a critical decision point that could determine whether we see a confirmed bullish reversal or a continuation of the larger downtrend.
Key Zone: 4H Imbalance & Resistance Area
Currently, price action is testing a 4-hour imbalance zone, which has already acted as a strong resistance level twice. The market is struggling to break through this supply zone, which is crucial in determining the next major move. If price tests this area again and successfully breaks above it, it could confirm that buyers have gained control, signaling a potential trend reversal back into a bullish phase.
However, if price gets rejected from this level again, it could indicate that sellers are still dominant, increasing the probability of a breakdown from the ascending channel and a resumption of the bearish trend.
Bullish Scenario: Break & Hold Above Imbalance Zone
For a confirmed bullish reversal, Nasdaq must break above the imbalance zone with strong volume and sustain price action above it. A successful breakout could attract more buyers, leading to a push towards higher resistance levels, possibly targeting the $20,000 - $20,300 range in the short term.
Signs to look for in a bullish breakout:
✅ A decisive close above the imbalance zone with strong bullish momentum.
✅ Retesting the broken level as support, confirming it as a new demand zone.
✅ A continuation of higher highs and higher lows after the breakout.
Bearish Scenario: Breakdown of the Ascending Channel
If price fails to break through the imbalance zone and instead rejects for the third time, this could indicate a weakening bullish structure. The key support to watch is the lower boundary of the ascending channel. A confirmed break below this channel could invalidate the short-term uptrend, signaling a return to bearish price action.
If this occurs, Nasdaq could drop towards the key support level at $19,146, a previous liquidity zone where buyers may step in again.
Signs to watch for a bearish breakdown:
❌ A clear rejection from the imbalance zone.
❌ A break and close below the ascending channel.
❌ Increased selling pressure and a shift in market sentiment.
Final Thoughts: A Critical Inflection Point
Nasdaq is at a pivotal moment where the next move will determine the broader trend direction. If bulls can push price above the imbalance zone, we could see a confirmed bullish reversal with upside potential. However, if sellers regain control and force a breakdown of the channel, the downtrend is likely to continue, targeting the $19,146 level as a potential support zone.
Traders should closely monitor price action at the imbalance zone and the ascending channel boundaries, as these key areas will dictate the next major move. Whether we see a trend reversal or continuation, this setup presents significant trading opportunities in either direction.
Key Levels to Watch:
📍 Bullish Breakout Target: $19,900 - $20,000
📍 Bearish Breakdown Target: $19,146
__________________________________________
Thanks for your support!
If you found this idea helpful or learned something new, drop a like 👍 and leave a comment, I’d love to hear your thoughts! 🚀
Make sure to follow me for more price action insights, free indicators, and trading strategies. Let’s grow and trade smarter together! 📈
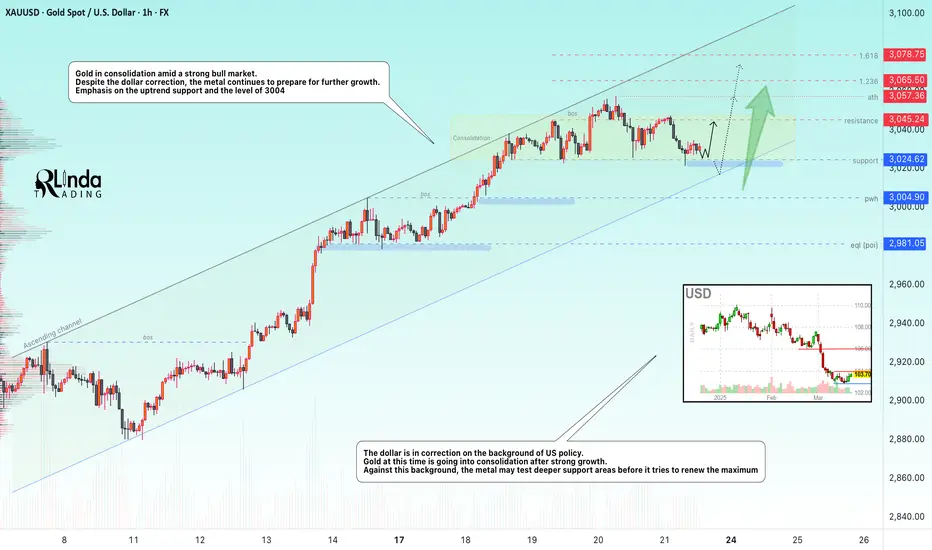
GOLD → Consolidation (correction) before growth to $3100FX:XAUUSD is going into consolidation after strong growth on the back of dollar correction. The metal may test deeper support areas before attempting a new high
Gold is correcting, but remains in an uptrend
The decline in quotations may be seen as a buying opportunity, given the economic uncertainty due to Trump's tariffs and expectations of Fed rate cuts.
The Fed reiterated its forecast of two rate cuts in 2025 despite Powell's cautious comments. Gold is further supported by rising inflation risks and geopolitical tensions in the Middle East.
Resistance levels: 3045, 3057
Support levels: 3024, trending, 3004
Reaction to support is weakening, even amid the uptrend. Gold may stay in this consolidation until the middle of next week, or it may try to break out of the consolidation to retest deeper support zones, such as the rising trend line or the 3004 imbalance zone, from which the growth may resume.
Regards R. Linda!
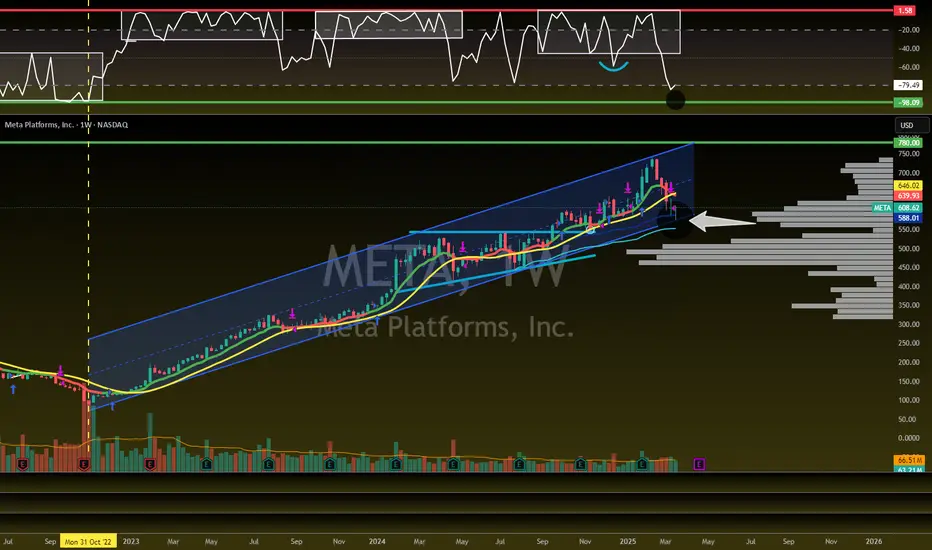
META is coming back to life!NASDAQ:META
As we discussed before a breakdown out of this Bullish Trend since 2022 would be very bearish and take META to the $400's.
Well, they said, hold my beer, and bounced hard exactly at the bottom of the channel and Anchored VWAP.
It's not over yet, as we need to follow through next week with a nice engulfing candle to make people into believers!
Not financial advice.
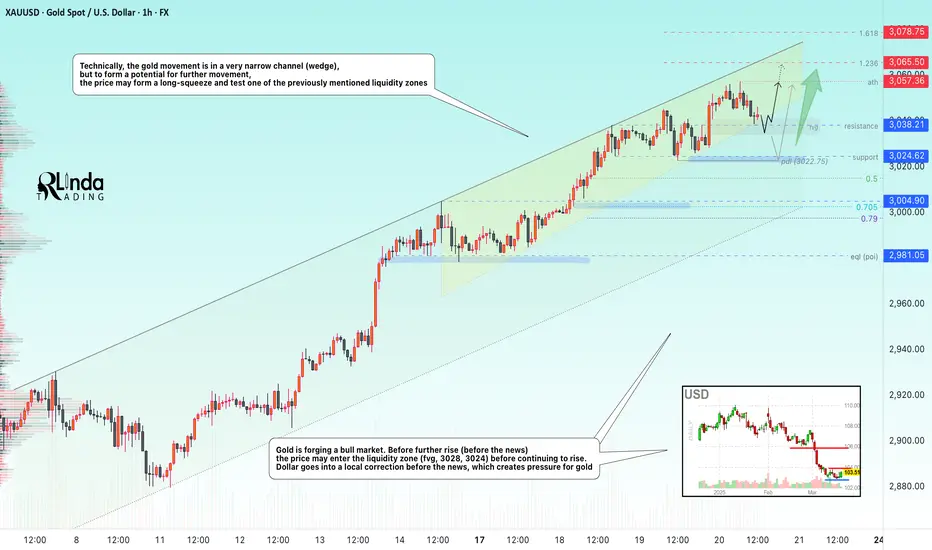
GOLD → Fading out before the news. Possible long-squeezeFX:XAUUSD continues its bullish trend, but locally, the movement is in a very narrow channel (wedge). To form a potential for further movement, the price may form a long-squeeze before or at the time of news...
Fundamentally, gold remains a bullish asset due to the Fed's rate cut forecasts and economic risks associated with Trump's tariff policy. Gold hit a new high on Wednesday after the Fed reiterated plans to cut rates twice this year, raised its inflation forecast and worsened growth and employment estimates.The price is further supported by escalating geopolitical tensions in the Middle East, with Israel announcing the resumption of ground operations in Gaza.
Gold is forming a bull market. Before further growth (before the news) the price may enter the liquidity zone (fvg, 3028, 3024), after which it will continue to grow. Dollar enters local correction before the news, which creates pressure on gold
Resistance levels: 3046, 3051, 3056
Support levels: 3038, 3030, 3024
Price is forming a retest of the wedge support, which increases the chances of a breakdown. If the support fails to hold, the price may go down to the above support before rising further.
But! If gold bounces from 3038 and consolidates above 3044, the growth will continue without a deep pullback
Regards R. Linda!
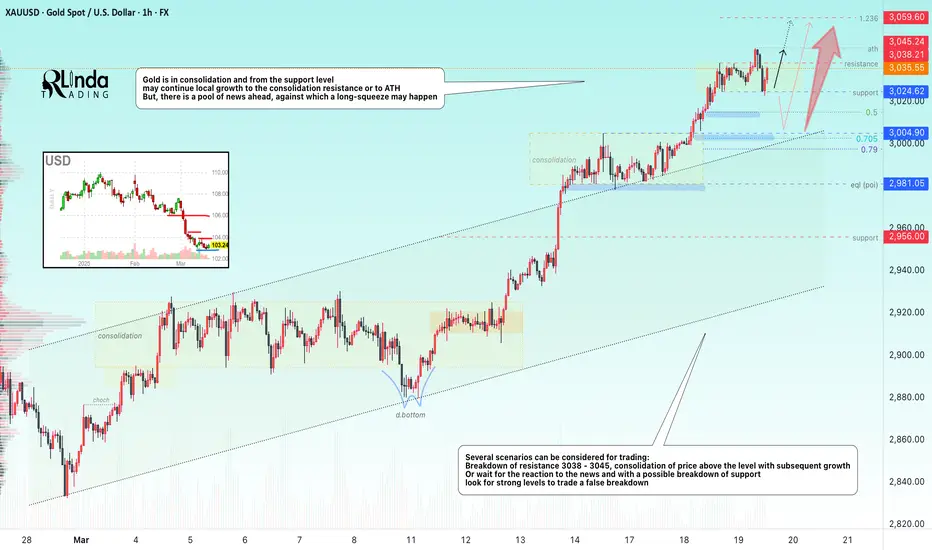
GOLD → Consolidation ahead of Fed rate meeting...FX:XAUUSD goes into consolidation 3038 - 3024 before the news - Fed rate meeting. The situation is generally predictable, but gold is reacting to rising geopolitical risks.
Gold is stabilizing before the Fed decision , markets are waiting for the data. The regulator is expected to keep rates, but Powell's forecasts will determine further dynamics.
“Hawkish” tone of the Fed may lead to the strengthening of the dollar and gold correction.
“Dovish” signals about economic risks will support the growth of metal prices.
Geopolitical tensions and Trump's tariffs continue to have an impact.The market is preparing for high volatility on the background of the Fed's decision and events in the world
Resistance levels: 2038, 2045
Support levels: 3024, 3015, 3004.9
Several scenarios can be considered for trading:
Breakdown of resistance 3038 - 3045, consolidation of the price above the level with subsequent growth to 3050 - 3060.
Or wait for the reaction to the news and with a possible breakdown of support to look for strong levels to trade a false breakdown, for example 3024, 3015, 3005.
Regards R. Linda!
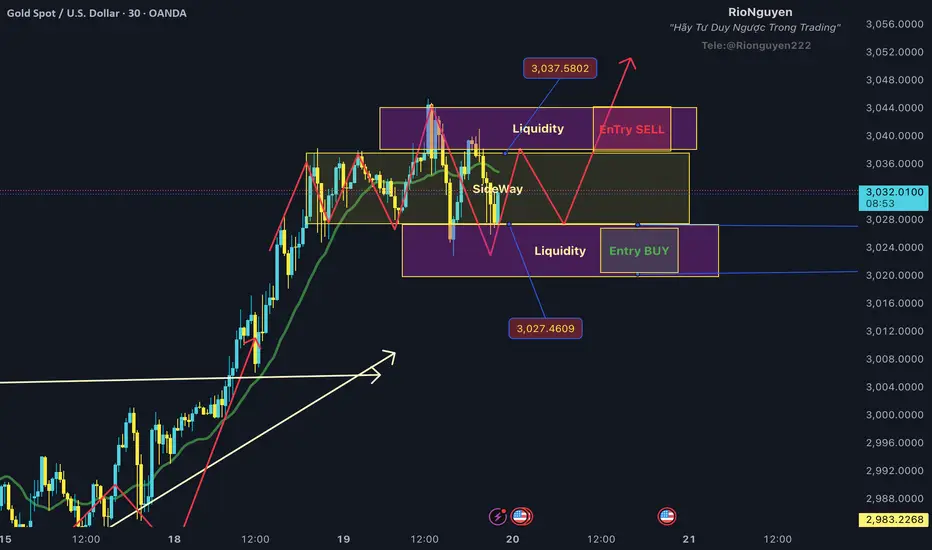
What is Gold Waiting For? Is This the ATH 3045? In our group, we secured profits in two rounds when gold hit an all-time high of $3045. Currently, we are still focusing on selling at $3040-$3045, as this is the liquidity grab zone for sellers.
I believe we can still trade within the sideway range, and be cautious of the two liquidity sweep zones as I have marked in the image.
Sell Liquidity 3040-3045: We can place Sell Limit orders in this area.
Buy Liquidity 3020-3025: We can place Buy Limit orders in this area.
The reason for this sideway phase of gold is that the market is awaiting the Fed meeting at 1:30 AM tomorrow, March 20th. After that, a strong trend will emerge. My plan is still leaning towards the Buy side, as the market is currently concerned about a potential economic recession in the US.
Therefore, we can focus on making small profits during this sideway period and wait for the next upward wave.
Thank you for your review, and I hope you'll stay longer by pressing Follow.
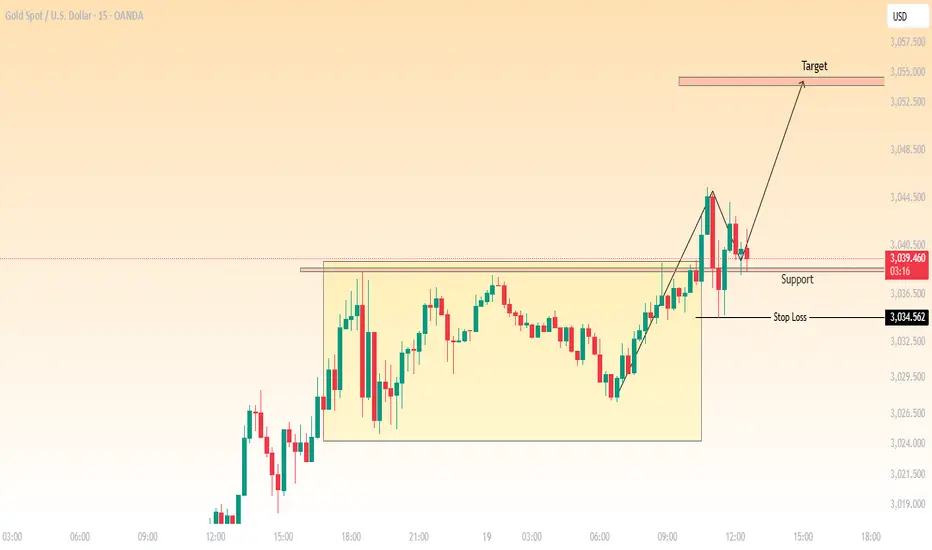
Gold (XAU/USD) Breakout & Retest Trade Setup - Bullish Move!Gold (XAU/USD) has successfully broken out of the consolidation zone after a strong rally. The price action recently tested the previous resistance level, which is now acting as new support.
Trade Setup:
Entry: Price has retested the breakout zone and is showing signs of bullish momentum.
Support: The previous resistance area (now turned support) is holding well.
Stop Loss: Placed just below the support at $3,034.562 to manage risk.
Target: A potential upside move towards the $3,055 zone, which aligns with the next key resistance level.
This setup follows a breakout-retest continuation pattern, a classic technical strategy where price revisits a breakout level before resuming the trend. If bullish momentum continues, we can expect a move towards the projected target.
📌 Key Levels to Watch:
Support: $3,034.562
Resistance/Target: $3,055
Current Price: $3,039.925
💡 Risk-to-Reward Ratio: Favorable, as the stop loss is placed strategically below support.
⚠️ Disclaimer : This is not financial advice. Always manage your risk and use proper risk management techniques.
What are your thoughts on this setup? Will Gold push higher or face rejection? Let me know in the comments! 🚀💬
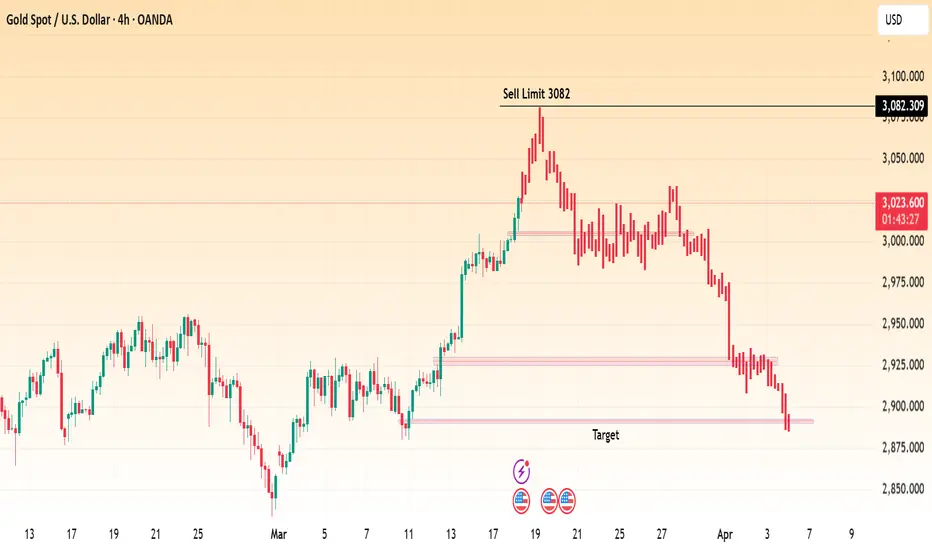
Gold (XAU/USD) Sell-Off Continues | Bearish Target insightGold Spot (XAU/USD) indicates a potential continuation of the current downtrend.
🔹 Sell Limit at 3082: A significant level where a sell order was placed, marking the start of the recent decline.
🔹 Strong Downtrend: After rejecting the 3082 level, gold has been making lower highs and lower lows, confirming bearish momentum.
🔹 Support & Target Zone: Price is approaching a key support area near 2880-2900, which aligns with the marked target level.
📉 Bearish Outlook:
If the price breaks below the current support, further downside is expected.
A potential bounce could occur at the target zone before a trend reversal.
💡 Key Levels to Watch:
Resistance: 3082
Support/Target: 2880-2900
Traders should monitor price action at support to determine if further downside is likely or if buyers step in for a potential reversal.
What’s your outlook on gold? Will the bearish trend continue? 📉💰