Case Study: Banking a +7 % Pop on OLLI’s VCP/ Ascending TriangleMomentum in discount retail has been stealth-strong all quarter, so when Ollie’s Bargain Outlet (OLLI) flashed a textbook volatility-contraction break I pulled the trigger. Below is the full play-by-play, numbers included, plus the process tweaks I’m carrying into the next trade.
1. The Setup
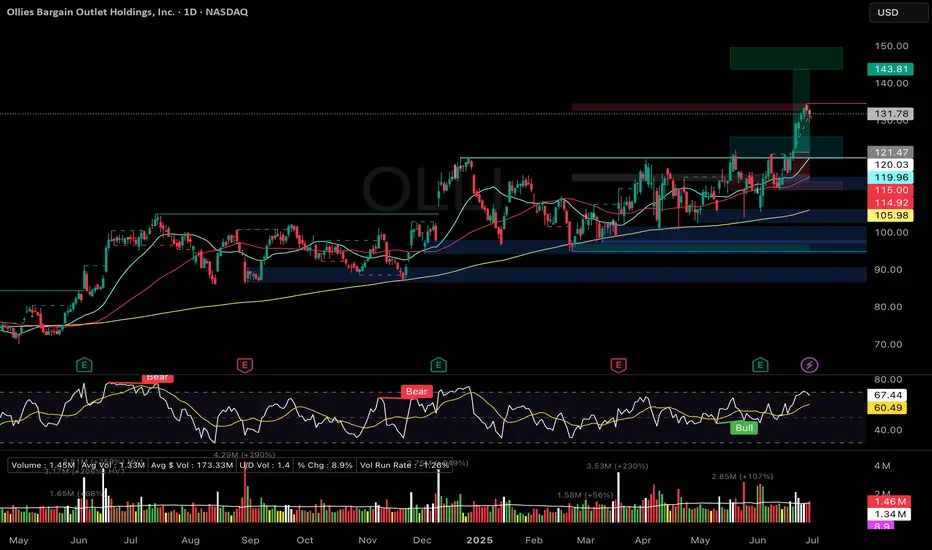
• Pattern: VCP-style ascending triangle under 121 resistance
• Context: Post-earnings drift sideways, volume drying up each contraction
• Catalysts: Strength across discounters (DG, WMT, DLTR) and bullish seasonality
• Risk: 1 % of account, stop pre-defined at 115
2. Execution
• 20 Jun – Stop-limit filled at 121.01 once intraday volume hit 2.6× ADV
• 24 Jun – Trimmed 3 sh at 129.13 (+6.7 %) to “feed the monster” and recycle BP
• 30 Jun – Trailing stop (ratcheted daily) closed remaining 7 sh at 129.94
3. Results
• Gross P&L: +86.89 USD, +7.18 % on position
• R-multiple: +1.45 R on initial risk
• Expectancy (TraderSync): +3.83 % — proof the process carries a positive edge
4. What Went Right
• Bought only after volume confirmed the breakout
• Stop never widened—only tightened
• Early partial locked in reward and removed emotional pressure
5. Improvement Plan
• Keep a 10 % “runner” until first close below 10-EMA or heavy distribution day
• Back-test a +25 % add on day-two follow-through (+2 % price, >1.5× volume)
• Simplify order flow by defaulting to single OCO brackets
NASDAQ:OLLI
Ascending Triangle
NZDUSD → Pre-breakout consolidation. One step away from a rallyFX:NZDUSD is consolidating, but the chart shows signs of readiness to shift to a distribution phase, which could lead to a rally.
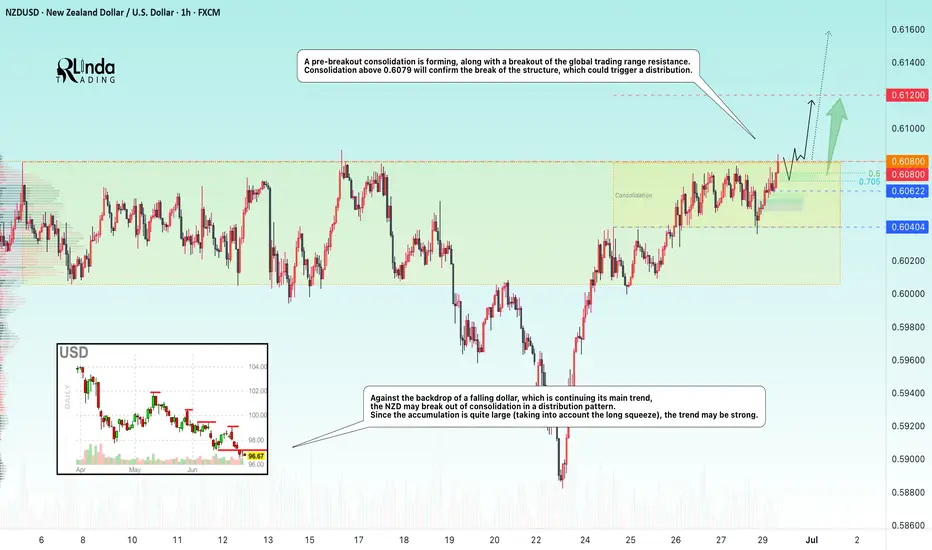
Against the backdrop of a falling dollar, which is continuing its main trend, the NZD may break out of consolidation in a distribution pattern. Since the accumulation is quite large (taking into account the long squeeze), the trend may be strong.
A pre-breakout consolidation is forming relative to 0.6080, followed by the price breaking through the resistance of the global trading range. Consolidation above 0.6080 will confirm the breakdown of the structure, which could trigger distribution
Resistance levels: 0.6080, 0.612
Support levels: 0.6062, 0.604
The price may be supported by a bullish trend and a decline in the dollar. A breakout from the 4-month consolidation may be accompanied by a continuation of the uptrend until the intermediate high of 0.6355 is reached in the medium term.
Best regards, R. Linda!
BITCOIN → Pause for consolidation before growth. 115K?BINANCE:BTCUSDT focus on the structure on D1. The market is forming local resistance and consolidation after growth. The fundamental background is positive. BTC is following the SP500
The market is recovering in line with the stock market (SP500, NQ) after the de-escalation of the situation in the Middle East. The fall in the DXY is also providing support.
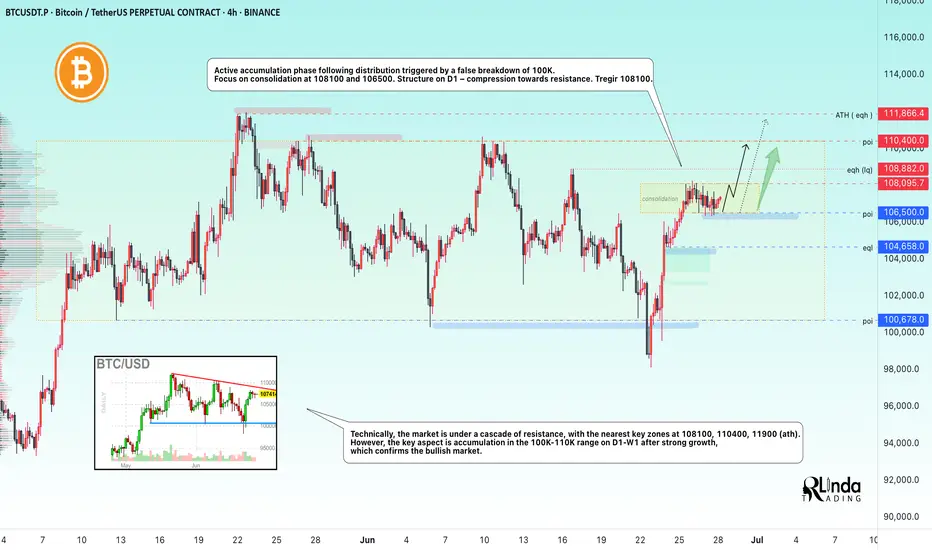
Technically, the focus is on the consolidation phase after the distribution triggered by a false breakout of 100K. The price stopped before the resistance at 108100 and rolled back to 106500, confirming the boundaries of the local trading range, the essence of which is a pause for a breather before a possible continuation of growth. The structure on D1 is compression towards resistance. The trigger is 108100, and a breakout of this level could trigger distribution towards 110500 and ATH.
Despite the fact that the market is under a cascade of resistance (resistance: 108100, 110400, 11900 (ATH)), an important nuance is that after strong growth, the price moved into accumulation in the 100K-110K range on D1-W1, and there are no reasons for a decline yet.
Resistance levels: 108100, 108900, 110400
Support levels: 106500, 104650
If the market structure within 106500 - 108100 remains unchanged and BTC continues to storm the consolidation resistance in the “compression to level” format and stick to the level, the chances of a breakout will increase. I do not rule out the possibility of a pullback to 106500, 105650 before a possible rise to ATH.
Best regards, R. Linda!
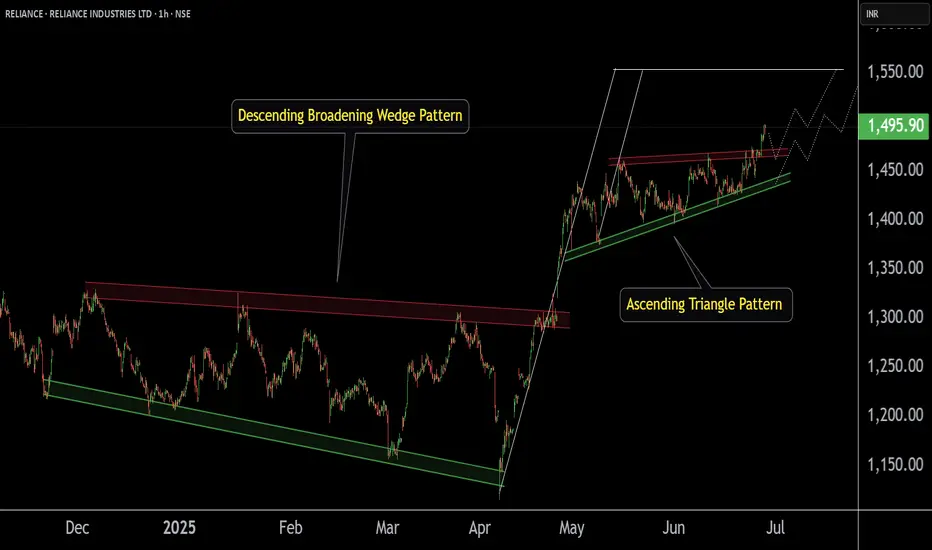
RELIANCE INDUSTRIES at Key Zone !!This is the 1 hour Chart of RELIANCE INDUSTRIES.
Stock has formed a large Broadening Wedge pattern, with a projected target around the 1560 range.
Stock has formed a ascending triangle patterrn with a projected target around the 1560 range.
stock has given a breakout at 1460 range. If it successfully retests and holds this level as support , then we may see higher prices in RELIANCE INDUSTRIES.
Thank you !!
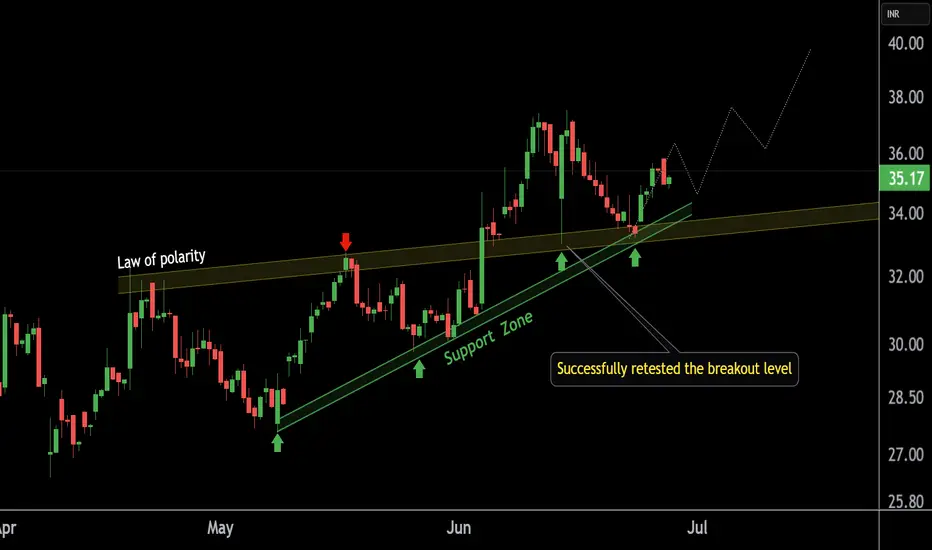
ALLCARGO LOGISTICS at Best Support !!This is the 4 hour Chart of ALLCARGO LOGISTICS.
ALLCARGO is having good law of polarity at 33 range .
Price action confirms a retest of the support zone at 33 range.
Price action indicates a bullish HH-HL formation.
If the support level sustains, the stock has the potential to make a new high.
Thank You !!
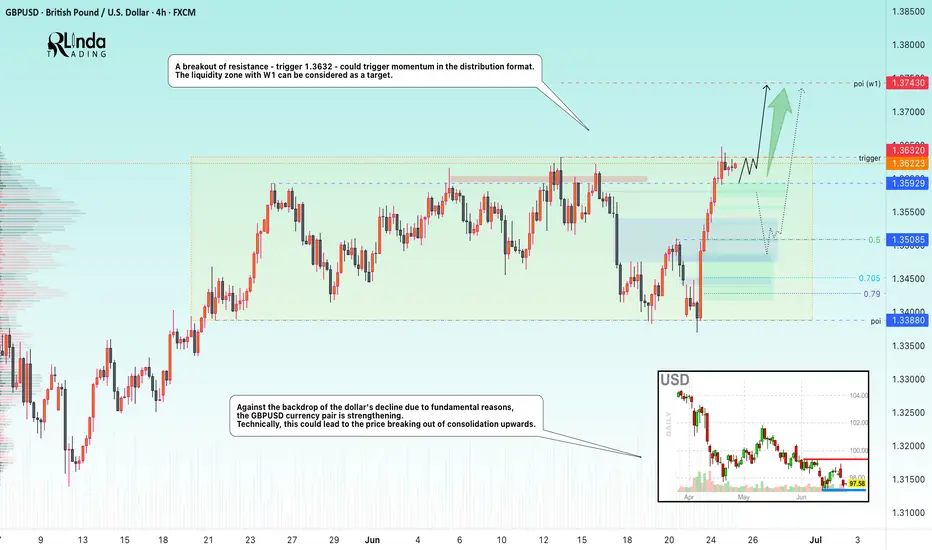
GBPUSD → Pre-breakout consolidation. One step away from a rallyFX:GBPUSD is trading in consolidation. Against the backdrop of the falling dollar index, the currency pair is testing resistance at 1.3632 but is not yet ready to bounce down.
Against the backdrop of the dollar's decline due to fundamental reasons, the GBPUSD currency pair is strengthening. Technically, this could lead to the price breaking out of consolidation upwards. A pre-breakout base is forming relative to the upper boundary of consolidation. The price is compressing towards the level, volatility is decreasing, which in general could lead to a breakout of resistance - trigger 1.3632. The exit from consolidation may be accompanied by distribution. The liquidity zone with W1 can be considered as a target.
Resistance levels: 1.3632, 1.3743
Support levels: 1.3593, 1.3508
The global and local trends are bullish. After growth, consolidation is forming. Against the backdrop of the falling dollar, GBPUSD is testing resistance. The reaction to the false breakout of resistance is weak. The chances of a breakout are quite high.
Best regards, R. Linda!
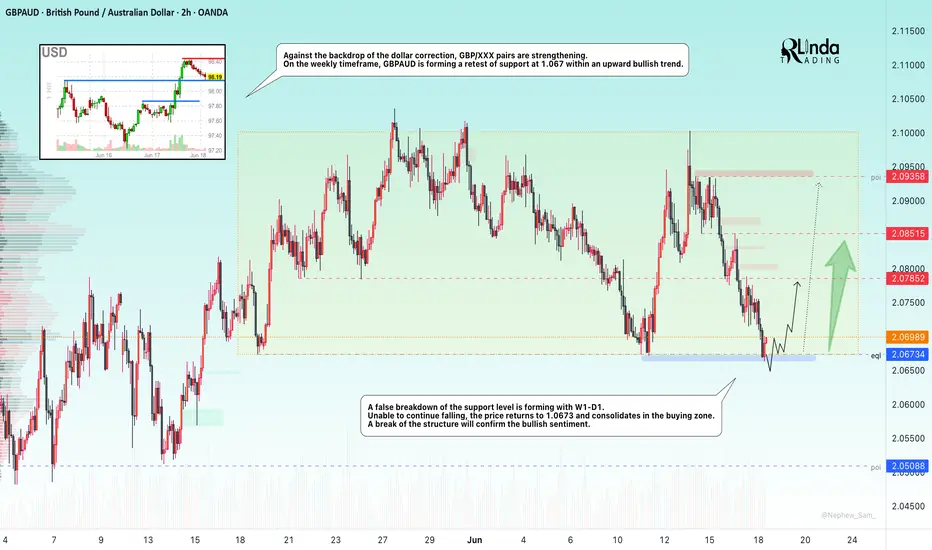
GBPAUD → Countertrend liquidity captureFX:GBPAUD is forming a countertrend correction within a global uptrend and testing the support level with W1-D1, forming a false breakdown...
Against the backdrop of the dollar's correction, GBP/XXX pairs are strengthening. On the weekly timeframe, GBPAUD is forming a retest of support at 1.067 (false breakdown) within an upward bullish trend.
Unable to continue falling, the price returns above 1.0673 and consolidates in the buying zone. A breakdown of the structure will confirm the bullish sentiment.
Support levels: 2.0673
Resistance levels: 2.0785, 2.0852
If the bulls manage to hold their ground above the 2.067 support level within the current structure, the currency pair will have a good chance of returning to the bullish trend.
Best regards, R. Linda!
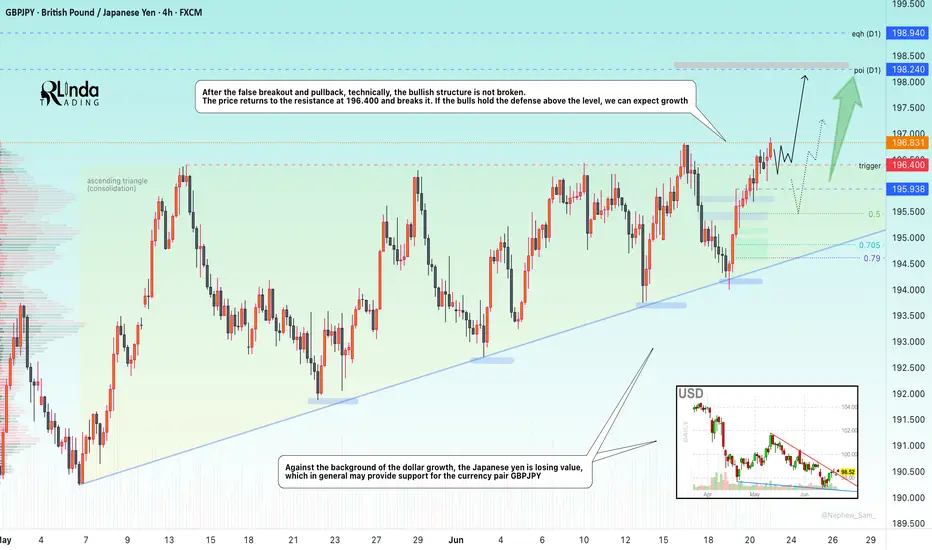
GBPJPY → Assault on the resistance 196.400FX:GBPJPY under the pressure of the bull market breaks through the resistance with the aim of possible continuation of growth and retest of the liquidity zone
Against the background of the dollar growth, the Japanese yen is losing value, which in general may provide support for the currency pair GBPJPY
The currency pair, after a false breakout of the key resistance and a small correction, technically, the bullish structure has not broken. The price returns to the resistance at 196.400 and breaks it. If the bulls hold their defenses above the level, we can expect a rise
Resistance levels: 196.400, 198.24
Support levels: 195.94, 195.45
Consolidation above 196.400, retest and break of 196.93 may trigger continuation of the growth. Zones of interest 198.24, 198.94
Regards R. Linda!
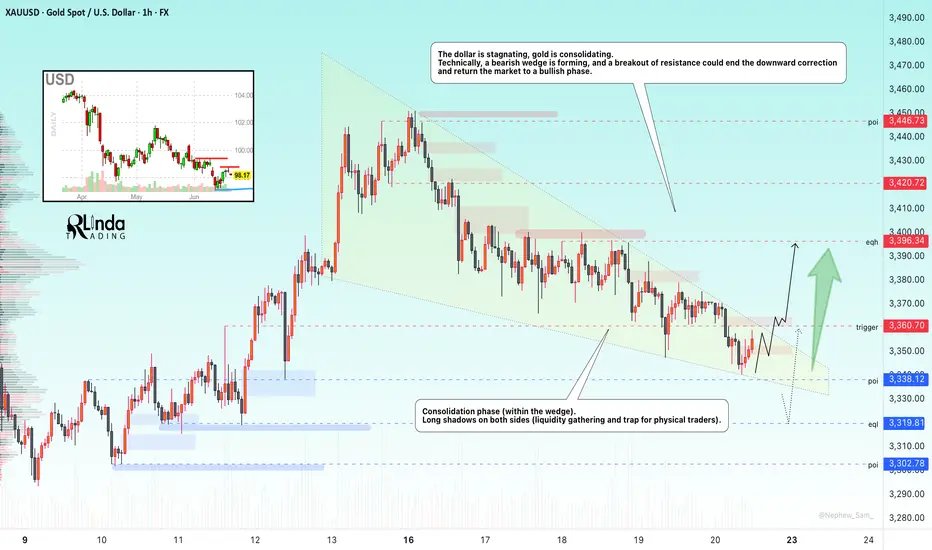
GOLD → Consolidation within a falling wedgeFX:XAUUSD is consolidating. A major player is gathering a trading position inside a wedge ahead of distribution. But the main question is: in which direction?
Gold lost ground again on Friday after mixed holiday trading on Thursday. Traders are waiting for new signals from the Fed and monitoring the situation in the Middle East. Interestingly, gold fell as the conflict escalated further (which is not logical overall). The dollar is in a global bearish trend, and traders are waiting for a decision from Powell (who is under pressure from Trump to cut rates).
Technically, if we look at the wedge, we can see how difficult it is for the market to move. The price is stuck inside the consolidation. The intraday movement is very short, with long tails and a very weak reaction to both false breakouts and level break. Large players are building up positions inside the current channel. This may only hint at the possibility of future implementation (distribution).
Resistance levels: 3360, 3396, 3420
Support levels: 3338, 3320, 3302
On D1 - H4, gold is in a countertrend (bullish trend) correction and is testing the trend support + 0.7 Fibo zone. Below, there are fairly strong areas of interest — 3320 and 3302 — which gold may test before rising. However, within the wedge, there is a fairly high probability of a breakout of resistance and the 3360 level, followed by a rally to the liquidity zone at 3396
Best regards, R. Linda!
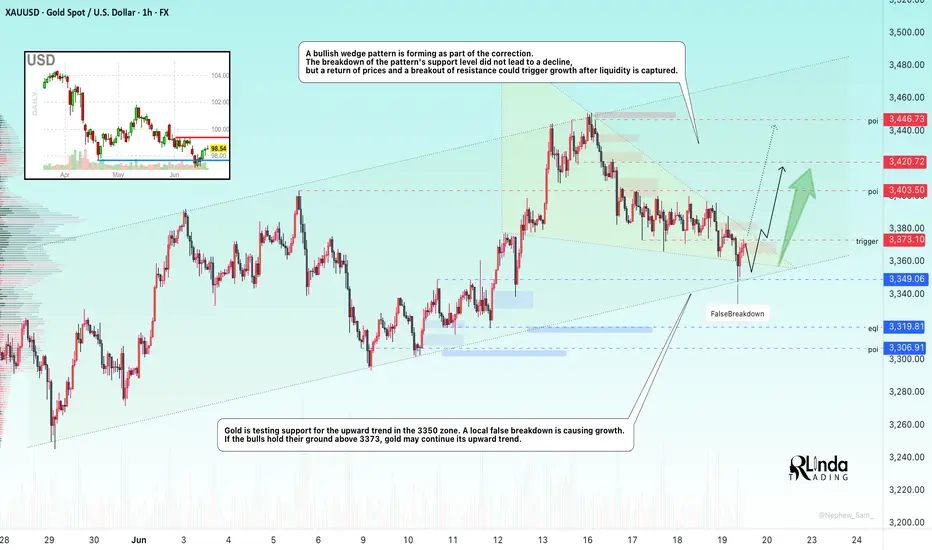
GOLD → Continuation of the global trend... To 3350?FX:XAUUSD is testing trend support within a correction. Against a complex fundamental backdrop (the Middle East, Fed comments, Trump's desire to lower rates), the price may continue to rise.
The price of gold rose from a weekly low of $3,363 on Thursday thanks to increased demand for safe-haven assets following reports of possible US strikes on Iran. Markets are ignoring the Fed's hawkish decision to maintain its tight policy and rate forecasts. Traders are waiting for new signals from the Middle East, given the risk of increased volatility due to low liquidity in connection with the US holiday.
Technically, a bullish wedge pattern is forming as part of the correction. The breakdown of the pattern's support did not lead to a decline, but a return of prices and a breakout of resistance could trigger growth after liquidity returns.
Resistance levels: 3373, 3403, 3420
Support levels: 3349, 3320
Before growth, a retest of the trend support or the 3350 zone is possible. However, if the price goes above 3375 and the bulls hold their ground above this level, then we can expect growth to continue within the trend.
Best regards, R. Linda!
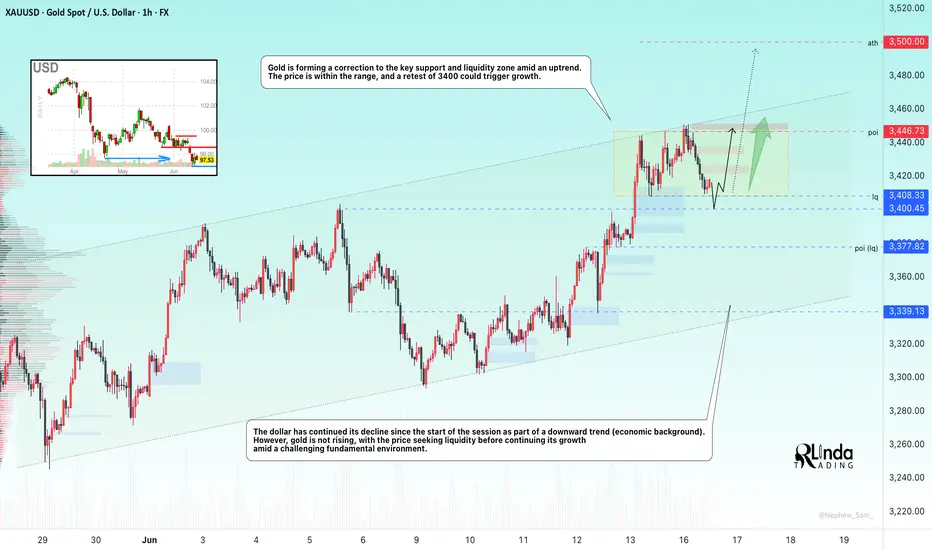
GOLD → Hunting for liquidity before continued growthFX:XAUUSD has been correcting since the start of the session. The fundamental background is complicated due to the escalation of the conflict in the Middle East.
The price of gold briefly retreated from a two-month high above $3,450 amid a recovery in the dollar and investor caution. Escalating tensions between Israel and Iran are dampening risk appetite, while markets await decisions from the Fed and the Bank of Japan. Expectations of a dovish Fed continue to support interest in gold, but fresh impetus is needed for further gains.
Technically, the market is bullish. Gold is forming a correction to the key support and liquidity zone amid an uptrend. The price is within the range, and a retest of 3400 could trigger growth.
Support levels: 3408, 3400
Resistance levels: 3446, 3500
A retest of support and liquidity capture amid the current challenging situation (high interest in the metal) and a bullish trend could support the price, allowing gold to continue its growth.
Best regards, R. Linda!
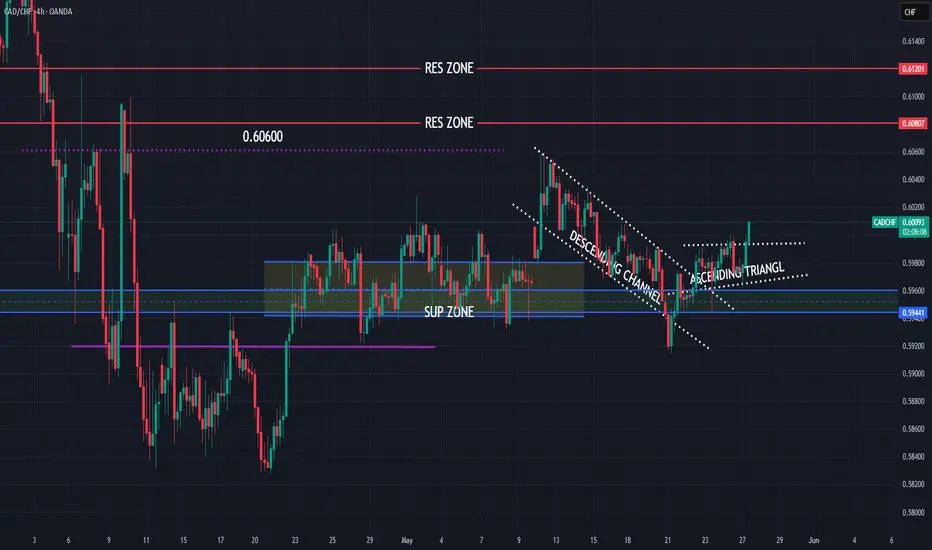
CADCHF new view, still bullish expectations
OANDA:CADCHF first analysis till TP1 (attached), having thoughts we are not see to much here and expecting higher bullish push than in previous analysis.
We are have break of zone, price is start pushing, at end its revers on first res zone (0.60600), in meantime DESCENDING CHANNEL is be created, on 22.Jun is be breaked, currently price is break and ASCENDING TRIANGL.
SUP zone: 0.59600
RES zone: 0.60800, 0.61200
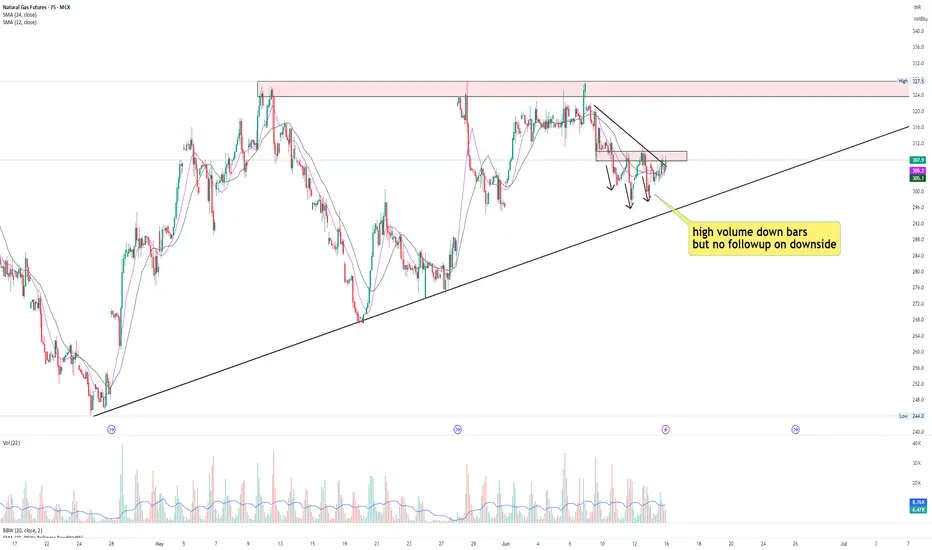
Naturalgas long tradeNaturalgas is resisting downside movement as witnessed on chart.
If you see the downward movement of Naturalgas, it is with relatively high volume but it is not coming down as expected from sellers and bouncing back up again as seen 3 times.
Now naturalgas has reached short term resistance zone of 307-310 from which it took support on 9th June, broke it on 10th June, took resistance on 11th and 12th June.
This might be a Change of Character zone for Naturalgas.
And now that Naturalgas is resisting downward movement, we might see breakout of this zone and probable upside movement.
Lastly it is also forming Ascending triangle which is still premature but just for reader's consideration.
Let's watch it on coming days.
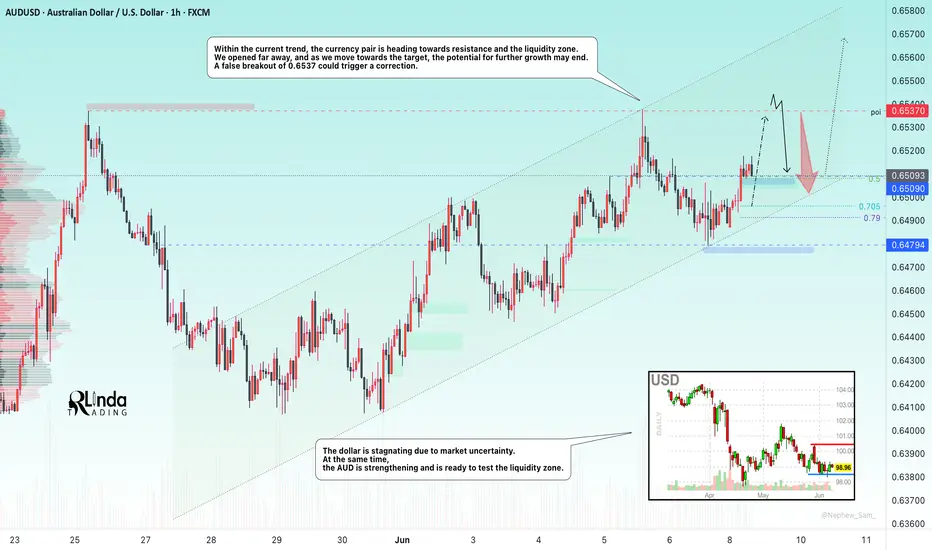
AUDUSD → Correction after a false breakout before growthFX:XAUUSD continues to rise amid uncertainty surrounding the dollar, which continues to consolidate. The currency pair is preparing to test resistance at 0.6537
The dollar is stuck in place due to market uncertainty. At the same time, the Australian dollar is strengthening and is ready to test the liquidity zone
Within the current trend, the currency pair is heading towards resistance and the liquidity zone. We opened far away, and as we move towards the target, the potential for further growth may end. A false breakout of 0.6537 could trigger a correction
Resistance levels: 0.6537
Support levels: 0.6509, 0.6479
A sharp move towards resistance without the possibility of further growth could cause a false breakout of 0.6537. Price consolidation below this level could trigger a correction before growth.
Best regards, R. Linda!
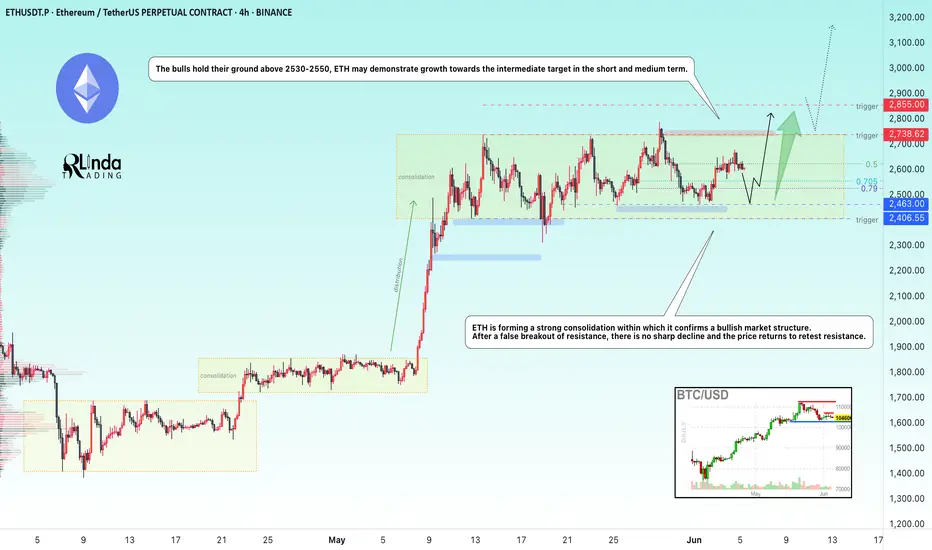
ETHEREUM → Consolidation amid a bull marketBINANCE:ETHUSD is consolidating in the range of 2400-2750, and locally, the coin looks quite promising even against the backdrop of Bitcoin forming a correction...
ETH is forming a strong consolidation within which it confirms a bullish market structure. After a false breakout of resistance, there is no sharp decline and the price returns to retest resistance.
If the bulls hold their defense above 2530-2550, then in the short and medium term, ETH may demonstrate growth towards the intermediate target.
Resistance levels: 2738, 2855
Support levels: 2525, 2470, 2400
A retest of support at 2525 - 2470 is possible, and if the price holds above this support zone, ETH may try to surprise us. There are good chances for growth.
Best regards, R. Linda!
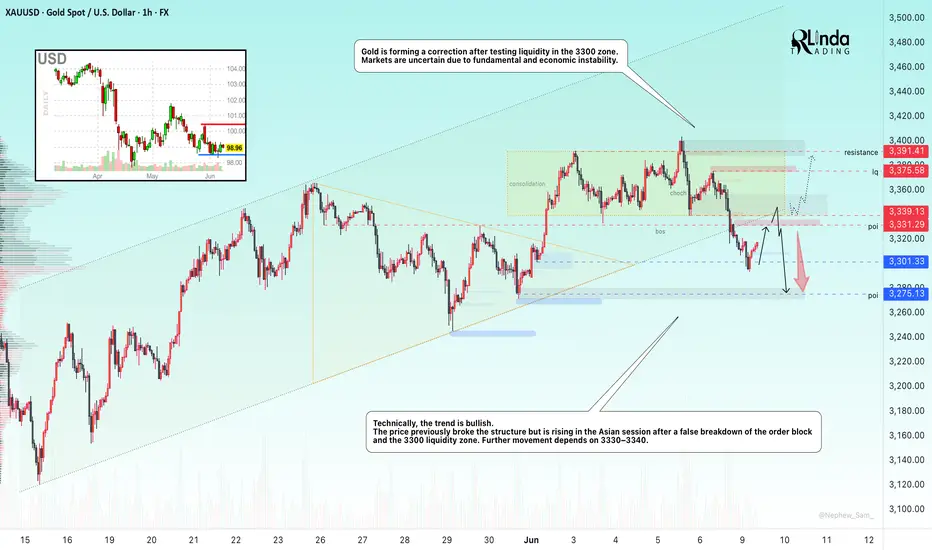
GOLD → Correction before a decline or continuation of the trend?FX:XAUUSD is testing the liquidity zone during the Asian session and forming a false breakout. The metal is recovering, but the fundamental background remains unstable...
On Monday, gold is holding steady at around $3,300 amid a weaker dollar and caution among traders ahead of US-China talks and the release of US inflation data (CPI) on Wednesday. Strong NFP data for May strengthened the dollar and lowered expectations for a Fed rate cut. However, domestic problems in the US are putting pressure on the currency... Markets are adjusting positions ahead of CPI. Geopolitics and domestic unrest in the US are holding back gold's decline, despite possible optimism about a trade deal.
Technically, the trend is bullish, with the price previously breaking the structure but rising in the Asian session after a false breakdown of the order block and the 3300 liquidity zone. Further movement depends on 3330 - 3340
Resistance levels: 33301, 3339, 3375
Support levels: 3301, 3275
The price is heading towards 3330-3340 for a retest. If the dollar continues to decline and gold manages to consolidate above 3340, the bullish trend may continue. BUT! A false breakout of the 3330-3340 zone could trigger a further decline after the bullish structure breaks down.
Best regards, R. Linda!
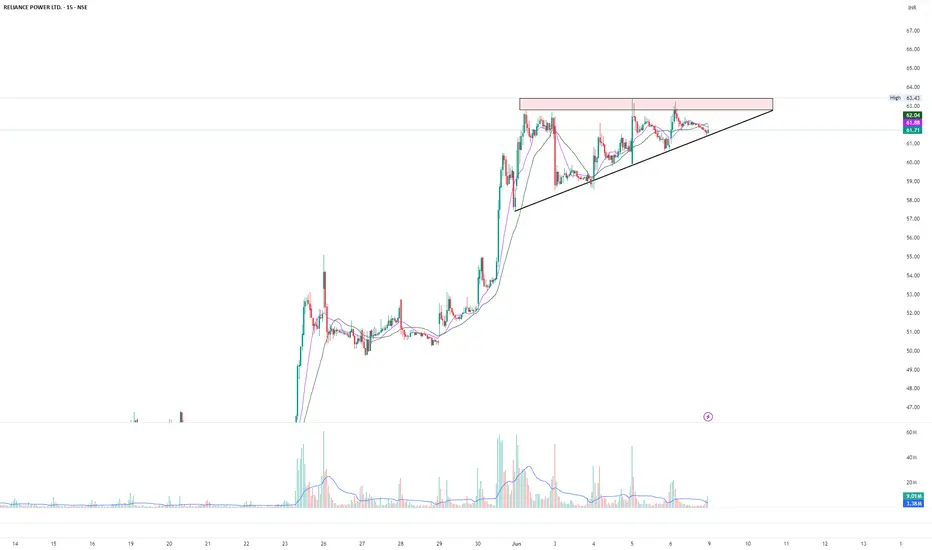
Ascending triangle in RPOWEROn short term chart, Rpower has created ascending triangle. This is after stock has moved up with a higher relative volume. This triangle suggests consolidation of upmove and further movement is highly probable.
As you can see, volume on up bars is huge as compared to down bars. This suggests higher interest in stock.
Breakout of 63.43 can give further upside.
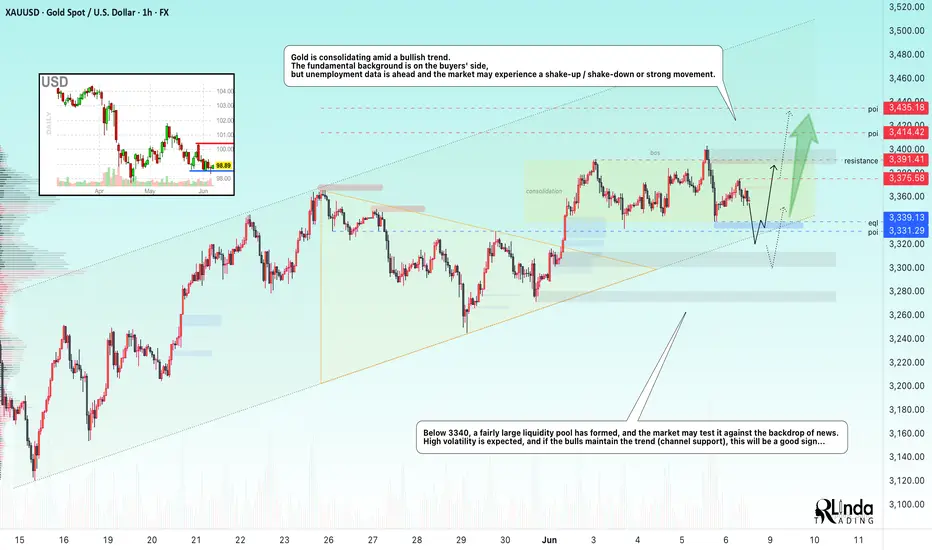
GOLD → Intra-range strategy. Waiting for NFPFX:XAUUSD remains consolidated in the 3340-3391 range. The price is stuck in the middle of the range due to the uncertainty created by upcoming unemployment news...
On Friday, gold rose slightly, remaining within the range ahead of important US employment data (NFP), which could set the direction for the market. Optimism over the US-China deal and profit-taking on the dollar are supporting the USD, holding back gold's rise. A weak NFP (less than 100,000) will reinforce expectations of a Fed rate cut and support gold. A strong report (above 200,000) will have the opposite effect. The probability of a rate cut in September is 54%.
Technically, on the daily timeframe, the market structure is bullish. After a sharp breakout of resistance and a new high, the price is consolidating above the upward trend line, forming a plateau in the 3300-3340 zone. Another shakeout from support is possible before the trend resumes
Resistance levels: 3375, 3391, 3414
Support levels: 3339, 3331
Forming a price forecast ahead of news, especially ahead of NFP, is a thankless task. Therefore, it is advisable to wait for the news and monitor the price reaction. A retest of the consolidation boundary and a rebound are possible. There is a chance that the price will remain in consolidation until next week, but again, it all depends on the fundamental background...
Best regards, R. Linda!
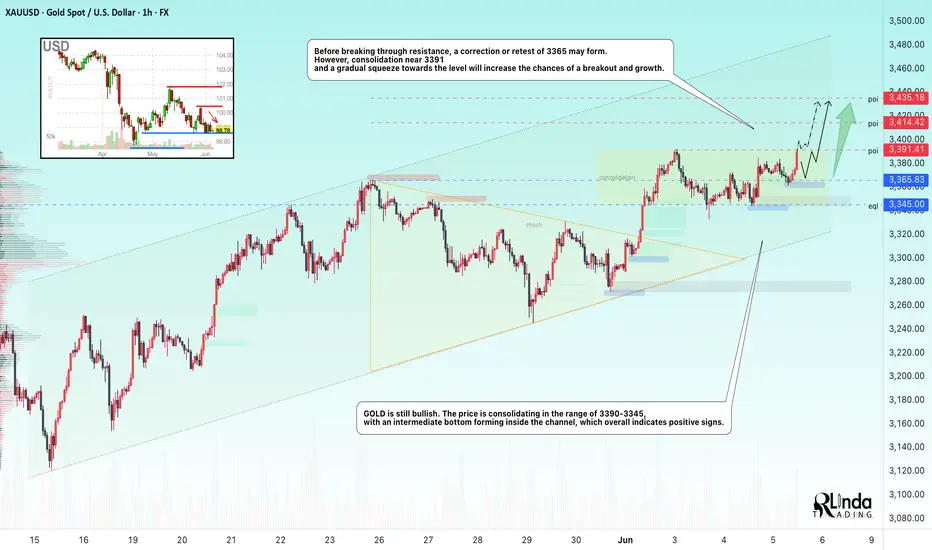
GOLD → Retesting resistance may lead to a breakoutFX:XAUUSD is still bullish. The price is consolidating in the range of 3390-3345, with an intermediate bottom forming inside the channel, which overall indicates positive signs.
On Thursday, gold is consolidating ahead of $3390. Consolidation after growth, within a bullish trend, is a good sign. But, on the one hand, the price is supported by growing tensions between Russia and Ukraine. On the other hand, optimism about US trade negotiations with Canada, the EU, and China is strengthening the dollar and holding back demand for gold.
Additional pressure on the dollar is coming from weak US macro statistics, especially ADP data and the decline in the ISM Services PMI, which have reinforced expectations of Fed policy easing. Traders are waiting for further signals from the regulator.
Resistance levels: 3391.4, 3414, 3435
Support levels: 3365, 3345
Technically, gold is rising and forming a retest of consolidation resistance. If the 3391 level is broken, the price may head towards 3435. Before breaking through resistance, a correction or retest of 3365 may form. However, consolidation near 3391 and a gradual squeeze towards the level will increase the chances of a breakout and growth.
Best regards, R. Linda!
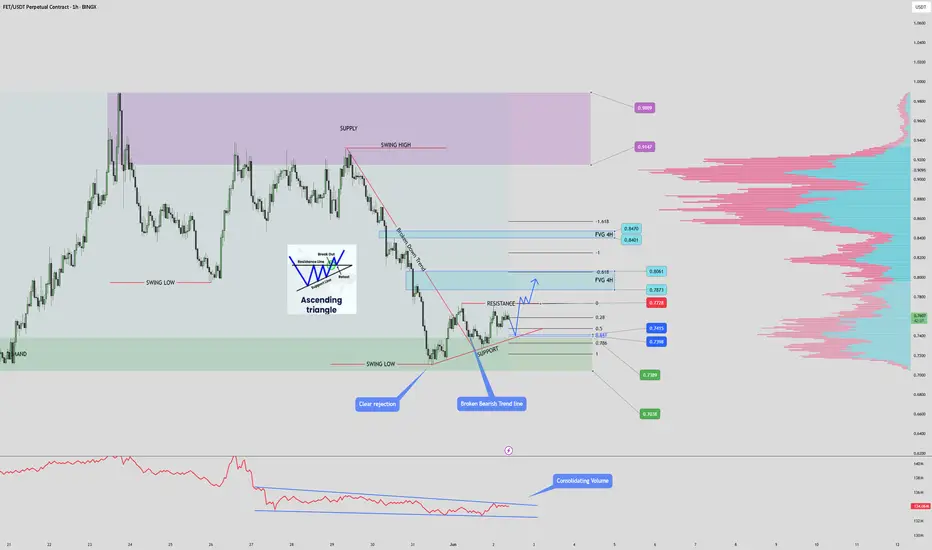
$FET Ascending Triangle Incoming PUMP? 1 Hour Time FraNYSE:FET 1Hr Time Frame
📝 Technical Analysis:
FET is currently forming an ascending triangle pattern, a typically bullish continuation structure. This pattern is developing after a clear retest of the demand zone between $0.7038 and $0.7390, which previously acted as a strong support area.
✅ Key confirmations:
- Two clear rejections from the lower boundary of the ascending triangle, suggesting strong buying interest.
-A break of the previous bearish trendline, shifting market sentiment from bearish to neutral/bullish.
-Volume consolidation seen in the lower portion of the chart aligns with the tightening price action – often a precursor to breakout.
📊 Price Action Insights:
- The next potential retracement is expected around the Golden Pocket (0.618–0.65 Fib zone), which aligns with both the ascending triangle support line and demand zone – this confluence adds strength to the level.
- A breakout above the triangle's resistance, with confirmation, would present a long opportunity.
- Fair Value Gaps (FVGs) on the 4H timeframe are visible overhead at:
$0.7873 – $0.8061
$0.8401 – $0.8470
These serve as profit-taking targets for any bullish breakout trades.
📊 Volume Profile:
Using the anchored Volume Profile:
- High volume node is seen around $0.9141–$0.9889 – indicating historical resistance where price may slow down.
- Low volume node (volume gap) exists in the mid-region, implying a potential fast move through this zone if the triangle breaks upward.
❌ Invalidation Criteria:
This bullish setup is invalidated if:
- Price breaks below the ascending triangle support, followed by a loss of the swing low and demand zone below $0.7038.
This would likely lead to a continuation of the prior downtrend.
🧠 Conclusion:
The setup currently favors bulls, provided the ascending triangle holds. A confirmed breakout above resistance opens the path toward the identified FVG zones. However, risk management is crucial around the support area as a breakdown would negate the bullish structure.
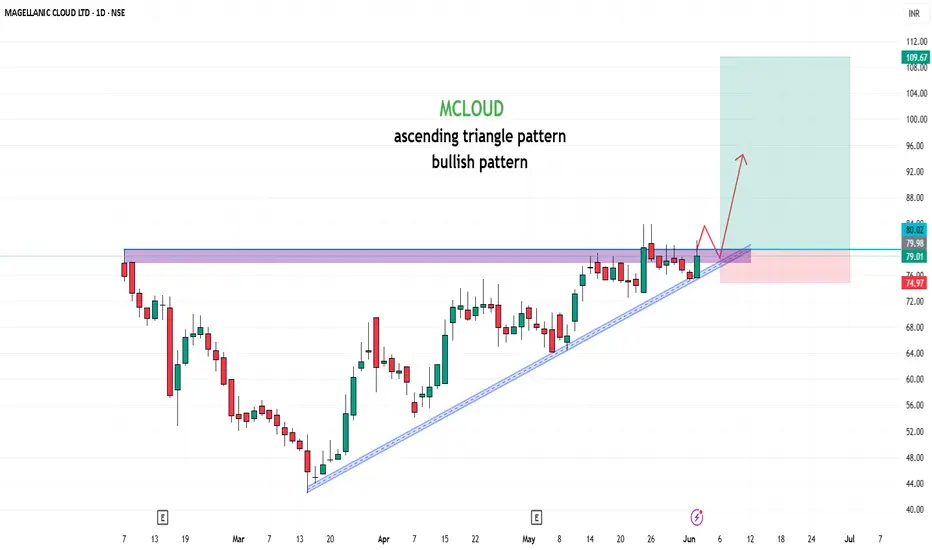
MCLOUD📊 Stock Analysis: MCLOUD
The stock has been consolidating within a ascending triangle pattern and is nearing a critical Buy Above level at ₹80 , signaling a potential breakout. The target is set at ₹179, offering a potential gain of 123.75%. Key insights:
Trend: A breakout above the wedge could indicate renewed bullish momentum.
Support Levels: Strong support around ₹75 , making this a low-risk entry point.
Volume Buzz: The recent increase in volume shows rising investor interest.
🔔 Keep an eye on this setup! Always analyze your risk tolerance before making any decisions.
📢 Disclaimer: This post is for educational purposes and not financial advice. Conduct your research or consult a financial advisor before investing.
What are your thoughts? Share them below! 📝
#StockTrading #TechnicalAnalysis #BreakoutTrading #MCLOUD
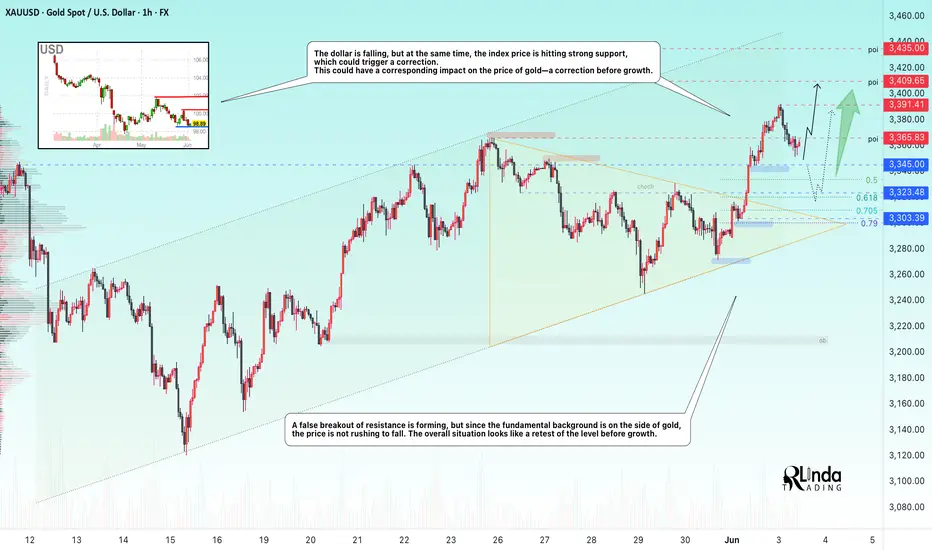
GOLD → Correction to liquidity before growthFX:XAUUSD is in the realization phase after exiting the “symmetrical triangle” consolidation. The price is supported by the trend and a complex fundamental background.
Gold is retreating from its peak, remaining below risk support. The price of gold is falling moderately from $3,392, awaiting data on JOLTS job openings in the US.
Gold is supported by trade and geopolitical risks: Trump doubled tariffs on metals, increasing pressure on the dollar. The conflict with China has escalated due to allegations of violations of agreements.
Focus on US employment: Strong data could support the dollar and limit gold's gains, but the technical picture remains bullish.
Resistance levels: 3365, 3391, 3409
Support levels: 3345, 3323
Against the backdrop of a rising dollar, gold may test deeper liquidity zones, such as 3345 and 3330. However, if trading forms between 3365 and 3345, followed by a retest of resistance and consolidation above 3365, this could trigger an early rise to 3391-3409.
Best regards, R. Linda!
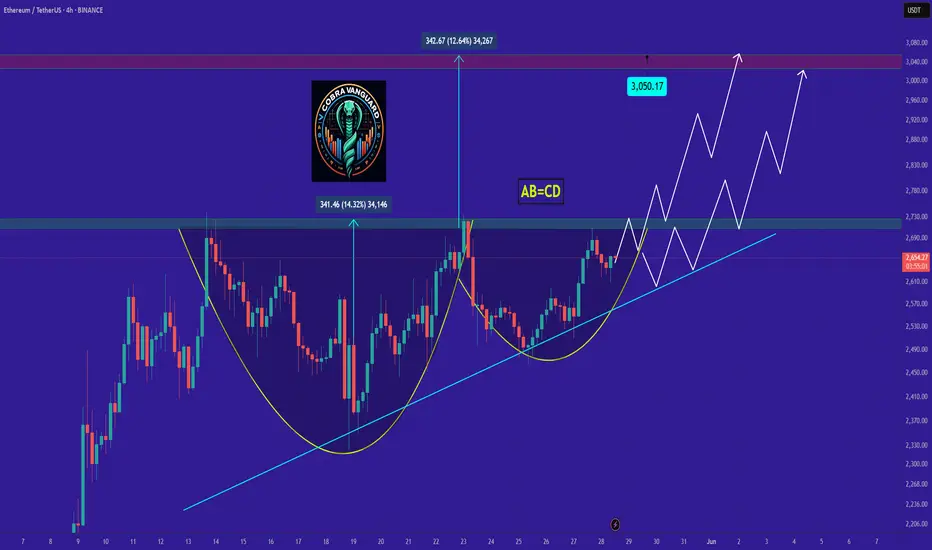
ETH's situation+ Target PredictionCurrently, ETH is forming an ascending triangle and cup and handle, indicating a potential price increase. It is anticipated that the price could rise, aligning with the projected price movement (AB=CD).
Continued strength could lead to upward movement toward targets at $2700, $2900, and $3.100
However, it is crucial to wait for the triangle to break before taking any action.
Give me some energy !!
✨We spend hours finding potential opportunities and writing useful ideas, we would be happy if you support us.
Best regards CobraVanguard.💚
_ _ _ _ __ _ _ _ _ _ _ _ _ _ _ _ _ _ _ _ _ _ _ _ _ _ _ _ _ _ _ _
✅Thank you, and for more ideas, hit ❤️Like❤️ and 🌟Follow🌟!
⚠️Things can change...
The markets are always changing and even with all these signals, the market changes tend to be strong and fast!!