US10Y: Bullish- Ascending triangle US10Y: Bullish- Ascending triangle
Ascending triangle detected on US10Y
The exponential moving averages remain possible targets
Monitor Ichimoku levels
The ROC ( Rate of Change) is in a positif territory.
Bonds can rise to a double top
Stay careful
Good trades to all
Ascending Triangle

GOLD → Could NFP cause a counter-trend correction?FX:XAUUSD within a strong rally stops and forms a flat before the publication of NFP. Relative to 2288 a false breakout is formed, bringing sellers into the market.
The dollar is in a correction phase, as is gold. The price is testing the local low of 2267.67 but still does not reach the strong liquidity zones of 2265, 2228, 2222. There is still a strong buyer in the market, but after the correction and the false breakdown of 2288 a seller appears. NFP is ahead, a rather important news, which can both turn the market and strengthen the current movement. It is worth paying attention to the resistance at 2288 and 2305. There is a chance to see the continuation of counter-trend correction, but before that there is a chance that a big player will drive the price to ATH before further decline to the specified liquidity areas: 2265, 2228 or to the support of the formal channel.
Resistance levels: 2288, 2305
Support levels: 2265, 2228, 2222
Technical factors are not enough now to specify the key areas for opening sales or purchases, so it is worth to base on the fundamental reasons and strong resistance and support areas.
TVC:DXY COMEX:GC1! COMEX_MINI:MGC1!
Regards R. Linda!

ascending triangle breakout for STZ. Multiple bullish crosses on the KST indicate bullish momentum.
An ascending triangle appears to be playing out, $420.00 price target by 2025.
Inverted H&S pattern is noticeable as well.

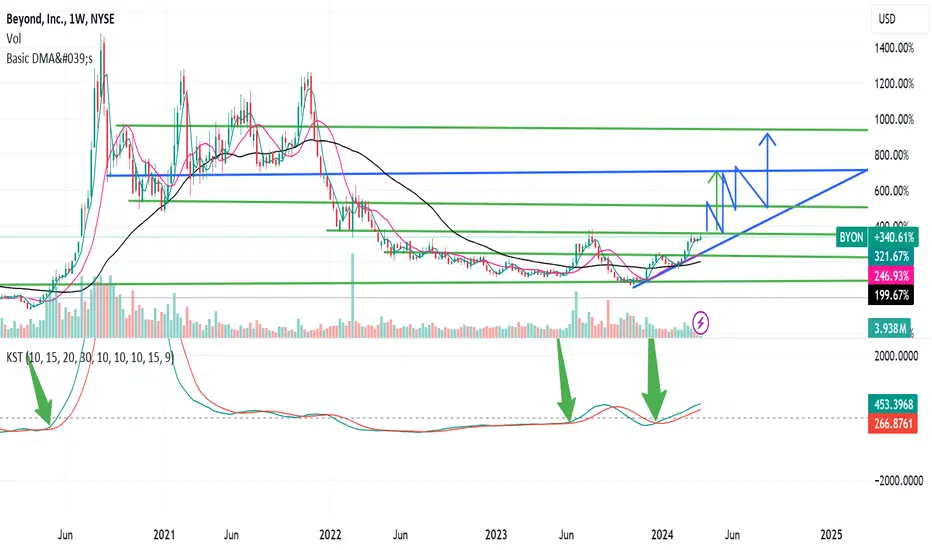
Ascending Triangle breakout for BYON...It appears as though BYON is trading in an ascending triangle.
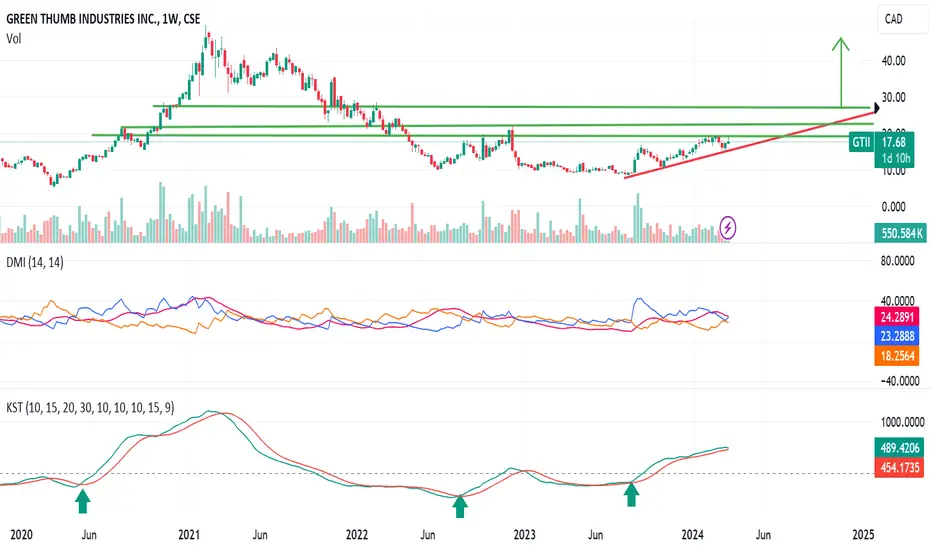
On the KST there has been a bullish cross.
The stock is finding support at the DMI, and has broken above the 200 DMA for the second time in two years since the downtrend from ATHs.
BTCUSDT -1h- Ascending Triangle - long positonIn this chart we have figure out a Ascending triangle with a possibility to breakout at upside. so place entry, sl & TP positions accordingly.
No Divergence spotted so far.

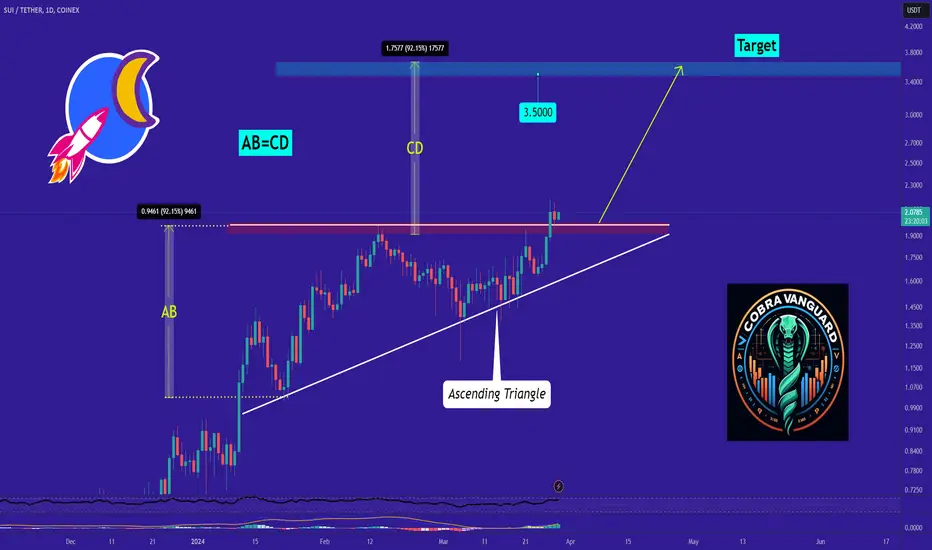
Honestly, I don't feel like explaining, the chart says it all !!Hi.
COINEX:SUIUSDT
Honestly, I don't feel like explaining because the chart says it all.
Stay awesome my friends.
_ _ _ _ _ _ _ _ _ _ _ _ _ _ _ _ _ _ _ _ _ _ _ _ _ _ _ _ _ _ _ _ _
✅Thank you, and for more ideas, hit ❤️Like❤️ and 🌟Follow🌟!
⚠️Things can change...
The markets are always changing and even with all these signals, the market changes tend to be strong and fast!!
USDJPY → Rate hike negatively affects JPY USDJPY is preparing to continue its bullish trend amid strong sell-offs of the Japanese national currency. Medium-term target could be 155.0
Amid the change of tactics of the Japanese central bank, traders are still negative towards the JPY and are still very much increasing short positions. On D1 the market still has a strong buyer in the currency pair, this can also be interpreted as the absence of a seller.
Previous: The central bank broke out of the negative rate trend by raising the interest rate for the first time in 17 years.
Resistance levels: 151.786
Support levels: 150.800
Technically and fundamentally, the currency pair is preparing for the continuation of the bullish trend. A breakout of the nearest resistance will signal a continuation of the upward trend
Regards R. Linda!

BITCOIN can ascend further ! What Shall we Expect ?Hi.
COINEX:BTCUSDT
✅Today, I want to analyze BTC for you in a 4H time frame so that we can have a Short-term view of BTC regarding the technical analysis. (Please ✌️respectfully✌️share if you have a different opinion from me or other analysts).
As you can see, BITCOIN is in an ascending channel and also recently managed to break the ascending triangle, if the price follows this pattern AB=CD will happen and the price will grow to top of the channel.
✅ Due to the Ascending structure of the chart...
🟢 High potential areas are clear in the chart.
🟢 Ascending Triangle
🟢 bullish channel
➡️ Note if the PRZ is broken downwards with the strength of Bearish candles or , this analysis of ours will be failed.
Stay awesome my friends.
_ _ _ _ _ _ _ _ _ _ _ _ _ _ _ _ _ _ _ _ _ _ _ _ _ _ _ _ _ _ _ _ _
✅Thank you, and for more ideas, hit ❤️Like❤️ and 🌟Follow🌟!
⚠️Things can change...
The markets are always changing and even with all these signals, the market changes tend to be strong and fast!!

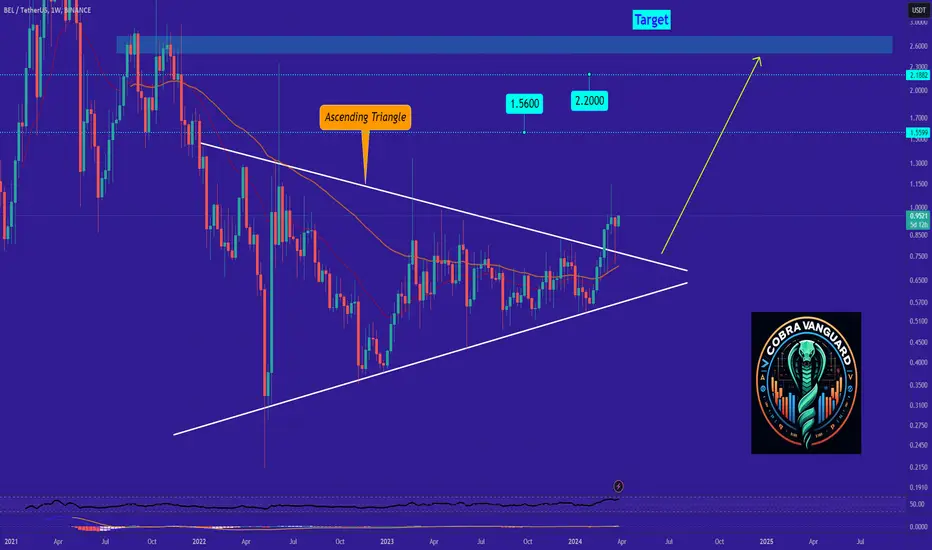
⚠️Again, this lovely triangle!!!Hi.
BINANCE:BELUSDT
Honestly, I don't feel like explaining because the chart says it all.
Stay awesome my friends.
_ _ _ _ _ _ _ _ _ _ _ _ _ _ _ _ _ _ _ _ _ _ _ _ _ _ _ _ _ _ _ _ _
✅Thank you, and for more ideas, hit ❤️Like❤️ and 🌟Follow🌟!
⚠️Things can change...
The markets are always changing and even with all these signals, the market changes tend to be strong and fast!!
Ascending Triangle breakout for GTII GTII appears to be one of the cannabis companies in America holding their market cap relatively intact.
There is an ascending triangle pattern on the verge of breaking out, and like clockwork cannabis reform in America is a hot topic to capture voters of all ages.
“There’s no excuse for our not being in the forefront for something that is now legal for 97 percent of the American public and, where people have a chance to vote, they vote to change the policies,” Blumenauer said. “I am hopeful that we can see some action following through on the legislation I passed—but, more importantly, on the things that the American people want.”
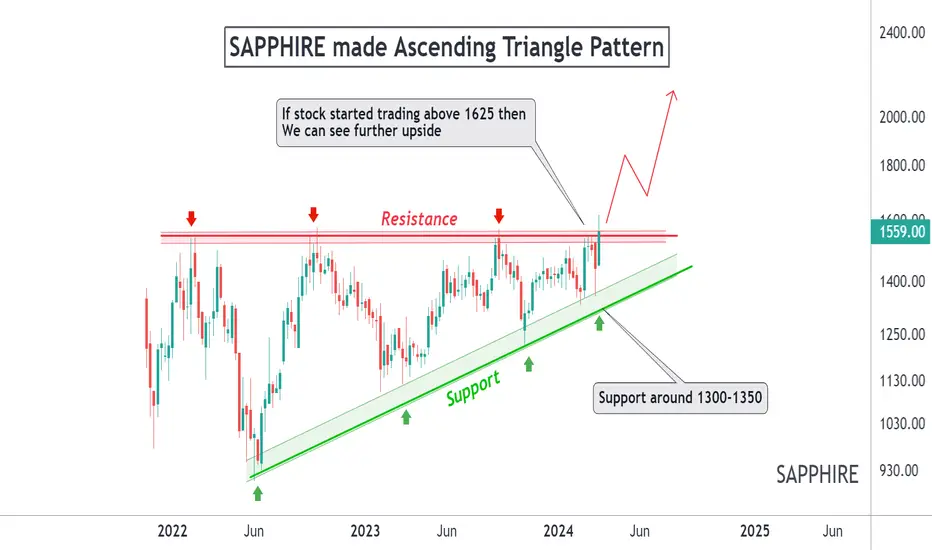
Multi year Breakout in SAPPHIRE foodsSAPPHIRE Food has given zero returns from last 2 years
Currently stock is trading near resistance
Stock has formed Ascending Triangle pattern which is Bullish pattern !!
If stock comes down then it may take support around 1300 levels.
Stock will give huge upside of 70-80% if it sustained above 1625 levels.
Thanks You !!
Disclaimer : We are not SEBI registered analyst. Do your own research before taking any investment decision.
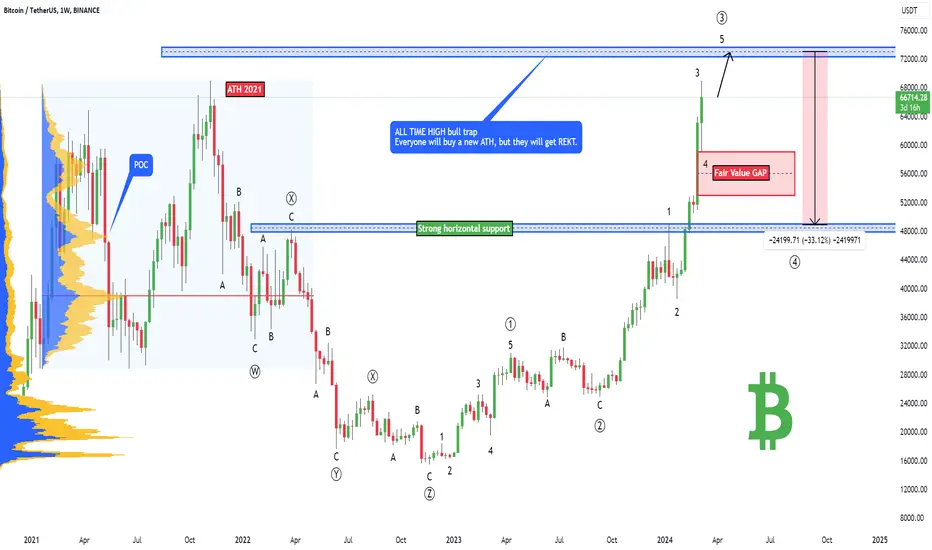
Bitcoin - All time high TRAP - 33% CRASH soon!Bitcoin almost reached an all-time high, but not yet. Wait for it; it will go above the previous ATH from 2021 pretty soon! And what happens after that? A lot of people will start buying the new all-time high, the news will be full of articles, and retail trades will buy the peak. Whales need liquidity, especially on BTC, so they will trigger a massive crash after that. I am expecting a 33% crash back to 50,000 - 47,000. But first, Bitcoin should hit 72,000 - 73,000.
From the Elliott Wave perspective, we have almost completed wave (3) of the entire bull market, and we are going to experience wave (4) soon. Then I am expecting wave (5) to finish the bull market; sometimes wave (5) can be super-extended and stronger than wave (3).
What's more, we have a huge unfilled fair value GAP below the current price, as you can see on my chart. These gaps tend to be filled sooner rather than later.
My suggestion for you is to wait for much lower prices. Buy Bitcoin at around 48,000 - 50,000. Do not FOMO in!
Let me know what you think about my analysis, and please hit boost and follow for more ideas. Trading is not hard if you have a good coach! Thank you, and I wish you successful trades.
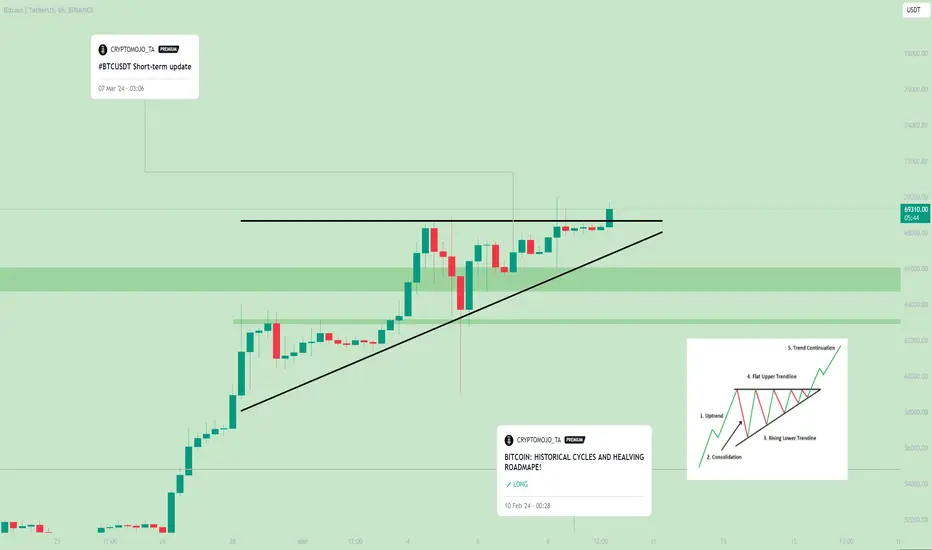
#BTC is breaking out of this ascending triangle!Bitcoin (BTC) is showing signs of a potential bullish rally of around 15–17%.
BTC currently breaking out of this ascending triangle, with an attempt to surpass the crucial resistance level of 69k.
Expecting a 15% to 17% rally after the breakout and retest of this pattern.
In the event of a worst-case scenario, where the bulls fail to hold the support at 66k, Bitcoin may test the support area of 60k.
Stay tuned I will keep updating.
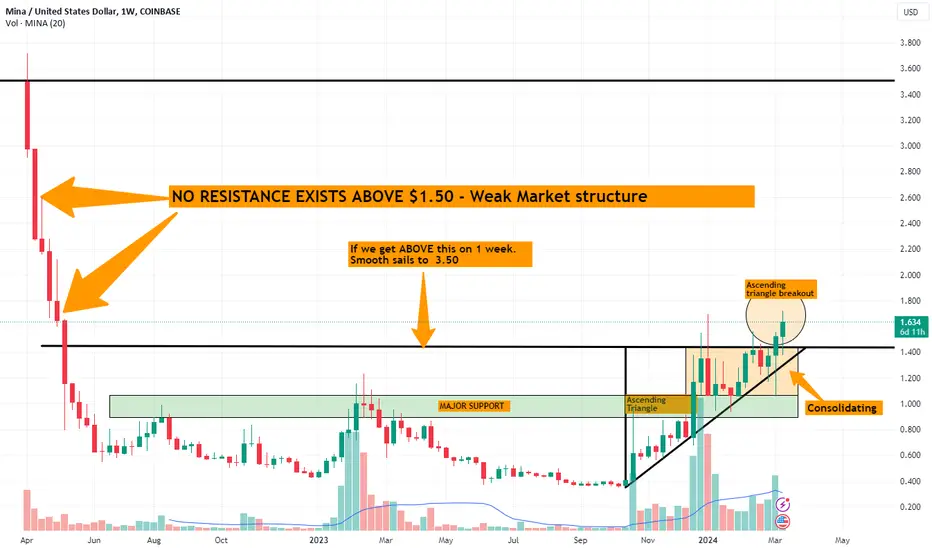
MINUSD CLear technical findings show an extreme bullish caseHi guys. I am always on the lookout for assets with clear signs of macrotrends. One that caught my attention was a crypto altcoin called MINAUSD.
This analysis is on 1 week timeframe. Signs found on macro timeframes can have powerful moves to upside or downside.
Notice firstly the horizontal black trendline around 1.40-1.50$.
This was an area for last couple weels we've been battling with as resistance.
It also coincides with a potential Ascending triangle pattern.
This battle is highlighted by the orange rectangle. This can be identified as a consolidation zone.
We are currently breaking out of both the consolidation zone, as well as the ascending triangle pattern.
Important to wait for confirmation which would be a candle close showing support on 1.40$ lvl.
We do have a lower wick on our current candle (showcasing demand and support) BUT remember this weeks candle just begun. We must wait till sunday for the weekly candle close. If we continue this current trajectory, we will see confirmation. However, there is always potential for a fakeout so this week is crucial.
Notice how right above us. There is really no price action acting as support. Just 6 total candles.
My opinion is that we will quickly move up to the 3.50$ area. Once bitcoin stalls and altcoins get liquidity injected into them. AND Support is confirmed.
Keep an eye on updates with other signs and indicator signals in near future to support my claims.
__________________________________________________________________________________
Thank you for taking the time to read my analysis. Hope it helped keep you informed. Please do support my ideas by boosting, following me and commenting. Thanks again.
Stay tuned for more updates on MINAUSD in the near future.
If you have any questions, do reach out. Thank you again.
DISCLAIMER: This is not financial advice, i am not a financial advisor. The thoughts expressed in the posts are my opinion and for educational purposes. Do not use my ideas for the basis of your trading strategy, make sure to work out your own strategy and when trading always spend majority of your time on risk management strategy.
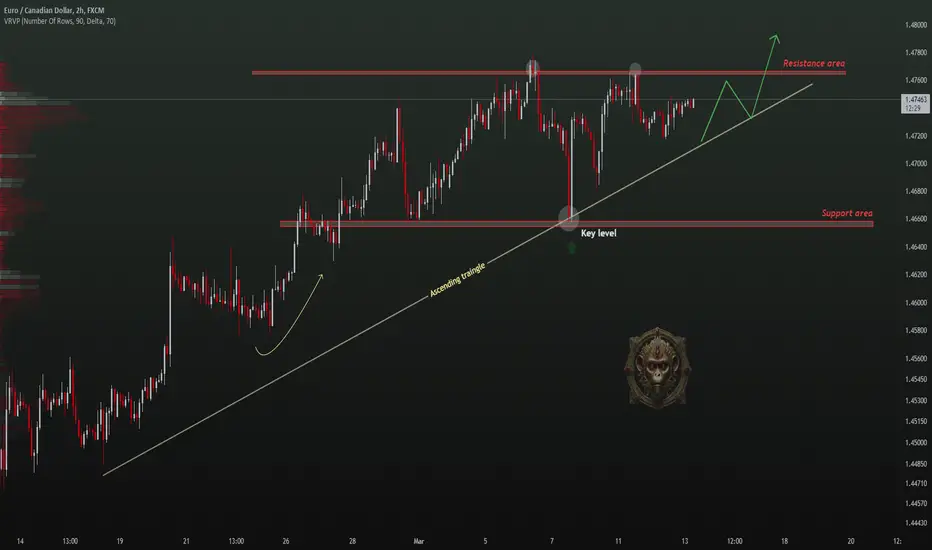
EURCAD → Day Analysis | BUY SetupHello Traders, here is the full analysis.
Price reversal going up, levels for BUY . EURCAD long
! Great BUY opportunity EURCAD
I still did my best and this is the most likely count for me at the moment.
Support the idea with like and follow my profile TO SEE MORE.
Traders, if you liked this idea or if you have your own opinion about it, write in the comments. I will be glad 🤝
Patience is the If You Have Any Question, Feel Free To Ask 🤗
Just follow chart with idea and analysis and when you are ready come in THE GROVE | VIP GROUP, earn more and safe, wait for the signal at the right moment and make money with us💰
JOE's situation+next targets and expected movements.Hi.
BINANCE:JOEUSDT
😊Today, I want to analyze JOE for you in a WEEKLY time frame so that we can have a Mid-term view of JOE regarding the technical analysis. (Please ✌️respectfully✌️share if you have a different opinion from me or other analysts).
The JOEUSDT is in a Bullish phase by Ascending Triangle & Cup & Handle.
- You can look for reasons to enter according to your own personal strategy after approval .
✅ Due to the Ascending structure of the chart...
- High potential areas are clear in the chart.
- Cup&Handle
- Ascending Triangle
Stay awesome my friends.
_ _ _ _ _ _ _ _ _ _ _ _ _ _ _ _ _ _ _ _ _ _ _ _ _ _ _ _ _ _ _ _ _
✅Thank you, and for more ideas, hit ❤️Like❤️ and 🌟Follow🌟!
⚠️Things can change...
The markets are always changing and even with all these signals, the market changes tend to be strong and fast!!

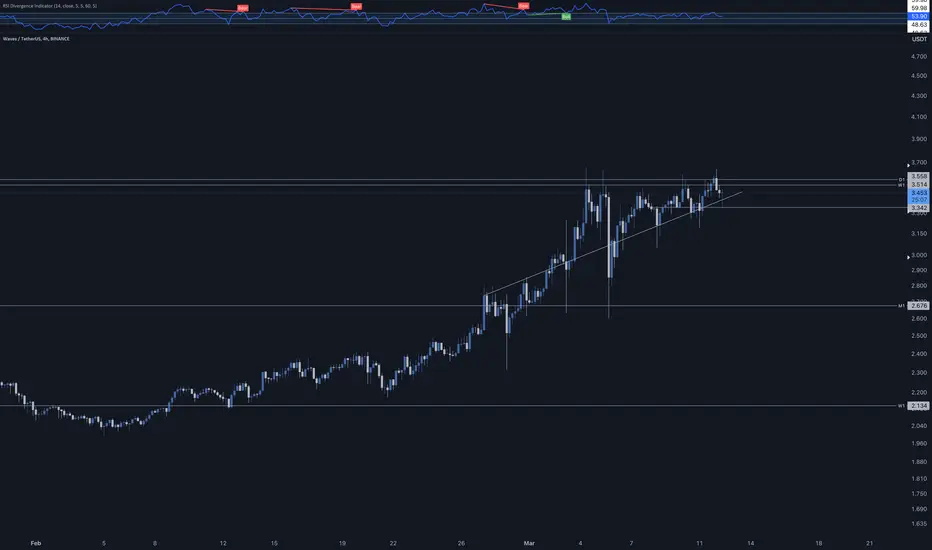
WAVES OMG!!!Hello Birdies,
Waves presenting a hug opportunity for long.
- Price is squeezing in an ascending triangle.
- Either price fall fakeout till 2.6-2.8 and than pump
- Or wait for a breakout from the range and enter on any retracement
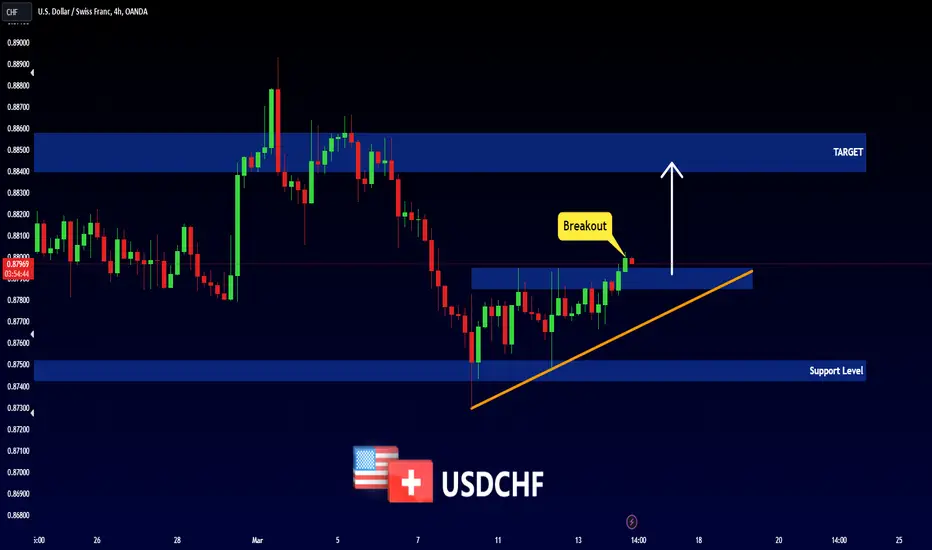
USDCHF - Ascending Triangle 📈Hello Traders !
On Friday 8 March, The USDCHF Reached The Support Level (0.87519 - 0.87426).
The Price Formed an Ascending Triangle.
Currently, The Resistance Level is Broken !
So, I Predict a Bullish Move📈
---------
TARGET: 0.88400🎯
ADAUSDT → Breakthrough readiness. Target 1.25.BINANCE:ADAUSDT is forming an interesting potential that may allow the price to break out of the current range and head towards $1.25.
There is an interesting situation on W1. A breakout of 0.746 level is formed and price consolidation above the level (On D1), which allows the bulls to cfrm an intermediate bottom. If we pay attention to bitcoin, on H1 the coin is preparing to continue its growth, Cardano may respond to this by breaking through resistance and then rallying to the mentioned targets.
Strong support is forming on the chart, based on the local double bottom, liquidation on March 6, as well as the liquidity zone below 0.6850. This allows to form a potential for further growth.
Resistance levels: 0.7882, trend resistance.
Support levels: 0.730, 0.6850
I expect a breakout of the range resistance, which may give a new breath for the coin. The intermediate target in our case is the end point of the correction at the bear market 0.8992, as well as the psychological level of 1.00
CME:BTC1! BINANCE:BTCUSD CRYPTOCAP:TOTAL CRYPTOCAP:TOTAL2
Regards R. Linda!

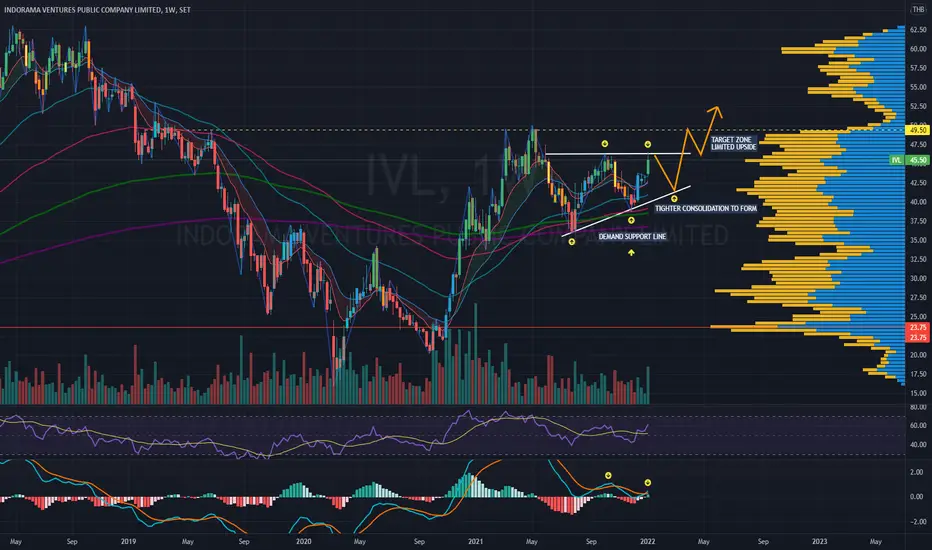
IVL | Ascending Triangle | Bull Trap - Limited UpsideIVL | Thailand SET Index | Petro Sector | Chart Pattern Trading
> Ascending Triangle continuation pattern - Bullish Trap with limited upside
> Price Action: Wait for tighter candlestick consolidation - Entry @ Demand Support Line Zone only
> RSI - bullish trap signal
> MACD - Bearish Divergence
DP
#ACEUSDT LONG#ACE
The price has been moving in a downward channel since December 20, 2023
The price is expected to bounce up again and break the pattern upward
In successive upward waves
Current price 9.10
First goal 9.54
Second goal 10.54
Third goal 11.88

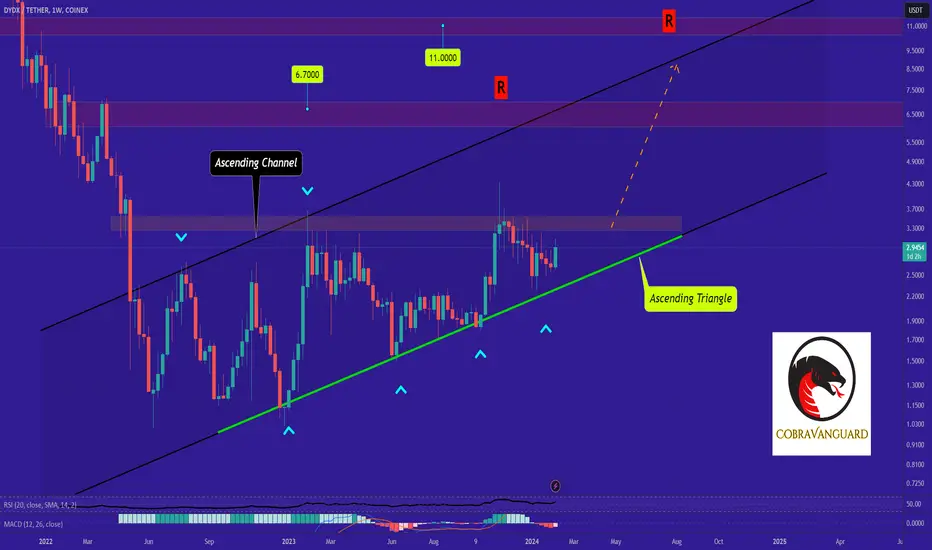
✅Price is in al bullish rising channel...✌️Hi.
COINEX:DYDXUSDT
Price is in al bullish rising channel and recently bounced from the lower border of it👀
Now CRYPTOCAP:DYDX is testing a resistance zone, breaking through which the price will rush upward to the upper border of this channel🔺
✅ Due to the ascending structure of the chart...
- High potential areas are clear in the chart
-AB=CD
-Ascending Triangle
-trend line
- Ascending Channel
Stay awesome my friends.
_ _ _ _ _ _ _ _ _ _ _ _ _ _ _ _ _ _ _ _ _ _ _ _ _ _ _ _ _ _ _ _ _
✅Thank you, and for more ideas, hit ❤️ Like ❤️ and 🌟 Follow 🌟!
⚠️Things can change...
The markets are always changing and even with all these signals, the market changes tend to be strong and fast!!
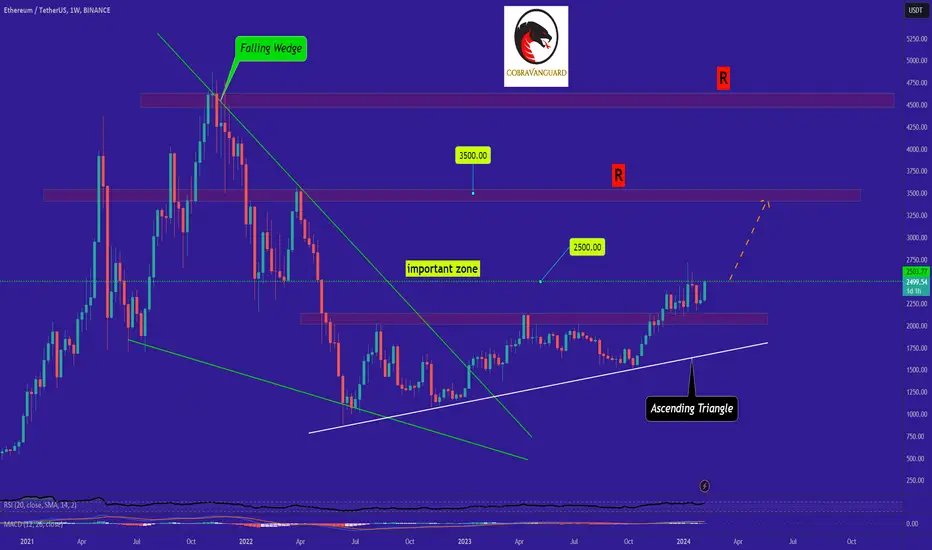
🚧Ethereum is Bullish now🚧 & many Traders don't see it 👀!!!Hi-
COINEX:ETHUSDT
Ethereum is consolidating above the broken upper border of the rising wedge🧐
Wait for the price to trade at least above $2,500 to confirm the continuation of the uptrend with a possible target around $3,500🎯
✅ Due to the ascending structure of the chart...
- High potential areas are clear in the chart
-AB=CD
-Ascending Triangle
Stay awesome my friends.
_ _ _ _ _ _ _ _ _ _ _ _ _ _ _ _ _ _ _ _ _ _ _ _ _ _ _ _ _ _ _ _ _
✅Thank you, and for more ideas, hit ❤️ Like ❤️ and 🌟 Follow 🌟!
⚠️Things can change...
The markets are always changing and even with all these signals, the market changes tend to be strong and fast t!!