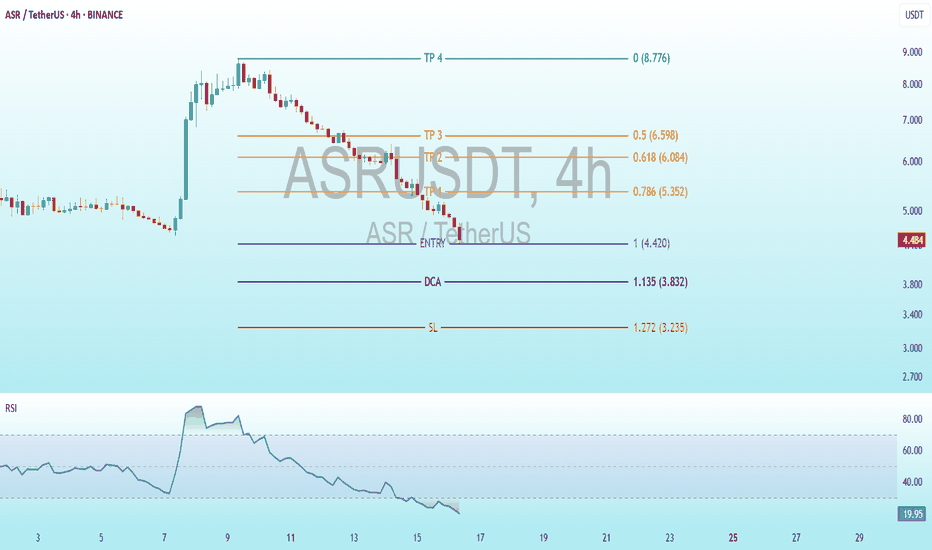
$ASR Bottom Bounce: 4H Trading Plan with Oversold RSIBINANCE:ASRUSDT
Trading Levels:
Entry: 1.00 (4.420 USDT) - The level where the initial purchase is planned.
DCA (Dollar-Cost Averaging): 1.135 (3.832 USDT) - An additional buying point if the price declines.
SL (Stop Loss): 1.272 (3.235 USDT) - The level where the loss would be limited.
TP (Take Profit):TP1: 0.786 (5.352 USDT)
TP2: 0.618 (6.084 USDT)
TP3: 0.5 (6.598 USDT)
TP4: 0 (8.776 USDT) - A significantly lower target, likely an error or long-term goal.
RSI (Relative Strength Index) Indicator:
The current RSI value is 19.55, which is in the oversold territory (below 30). This suggests the price may be undervalued, potentially indicating a buying opportunity or an upcoming rebound.
Analysis and Interpretation:
Strategy: The chart uses Fibonacci levels to determine entry, exit, and loss points. The entry is set at 4.420 USDT, with a DCA at 3.832 USDT if the price drops further, and a stop loss at 4.735 USDT to protect capital.
Profit Targets: TP1 to TP3 are based on Fibonacci extension levels (0.786, 0.618, 0.5), indicating a technical approach to taking profits as the price rises. TP4 at 0.776 USDT seems unrealistically low and is likely a mistake.
RSI: The low RSI value (19.55) indicates an oversold condition. This could suggest a potential reversal or upward movement, especially if buying pressure increases following the recent decline.
Recommendation:
Monitor the price closely around the entry level (4.420 USDT) and DCA (3.832 USDT). The oversold RSI suggests a possible buying opportunity, but caution is advised due to the recent sharp drop.
