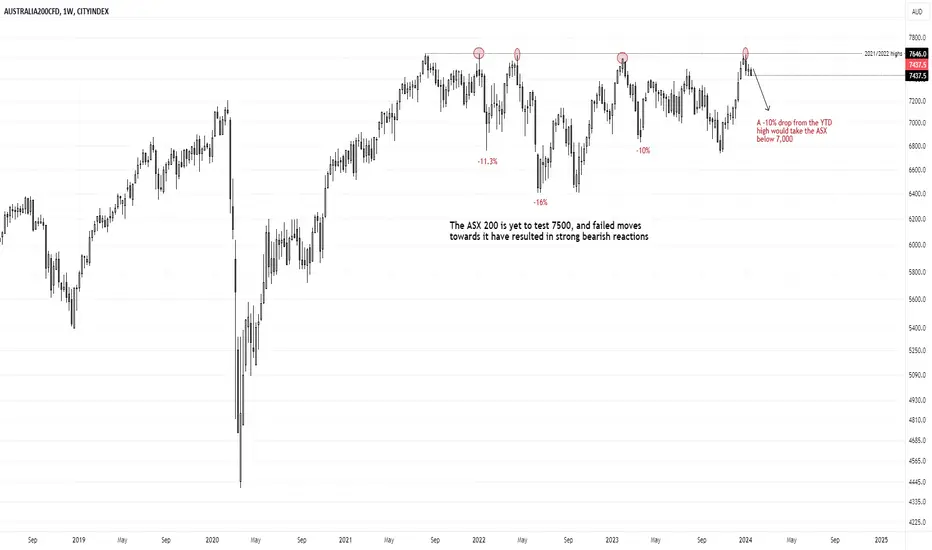
Is the ASX 200 about to roll over?Looking at the weekly chart, bulls may have something to worry about. The market is yet to even test 7500 let alone break above it, and each time it has tried (and failed) to do so, the ASX has fallen by double digits in percentage terms.
A bearish engulfing candle formed in the first week of the year after once again faltering at those cycle highs. And if we're to see even just a 10% drop from the 2024 high it could, the index will find itself back beneath 7000. But if bears really get their way for another -16% drop, the ASX will be back around 6400.
What could make that happen? Well, markets have been aggressively pricing in 5 - 7 Fed cuts this year which may not arrive. And if the wheels fall off the global economy to justify said cuts, that could also be bad for the stock market. So bulls may want to ask themselves if they want to be along at these levels, where the market is yet to every trade above it. As we could be in for a deeper pullback at the very least.
Asx200short
ASX Rising wedge On the chart we can see a rising wedge formation.
The price is still moving inside the pattern. Once is breaks the support line it would be a good time to enter the short position.
Target is showing on the chart.

AU200 Short-Med Term OutlookAnticipating short-term bounce to fill gaps, re-test 23.6% Fib zone & create opportunities for Short positions.
Selling 'should' re-commence in September to test lower range re: parallel channel, in-line with Market Seasonality.
Over-extension into Golden Fib Range could signal warning of more extreme market capitulation (~6400).
Depends on break-outs either side of current indecision candle/price action, TBC.

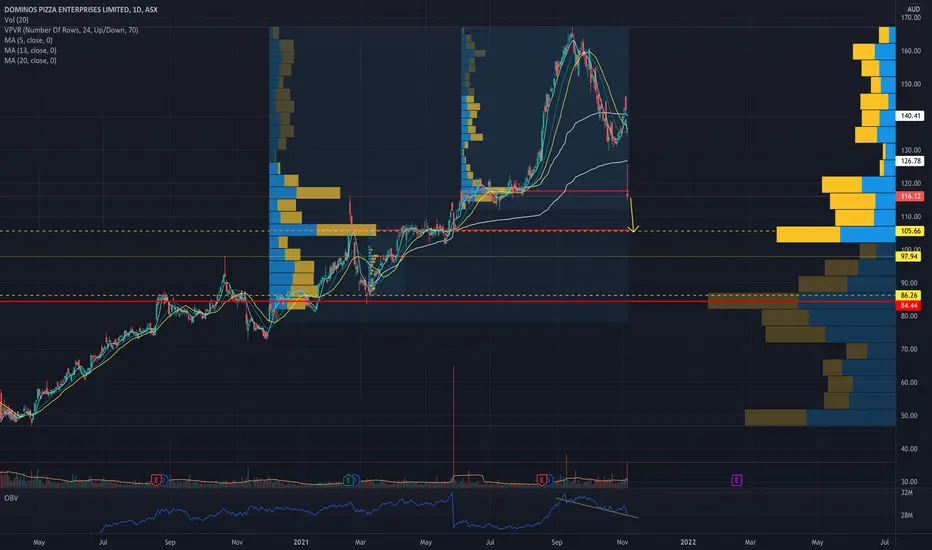
What goes up comes downI am just not sure what has caused this extraordinary price drop, when apparently it was looking like it was just recovering from down trend - if anyone knows please comment .
May be it’s just natural price correction in market, looking at today’s price action, buyers were able to take it up in first two hours up to $125.84, till that time it’s was all buyers hardly any sellers but later it’s was all sellers and price couldn’t hold and closed below opening price altogether 18.40% down.
If this is just some weird correction without any fundamentals changing, then I think price should come down to round $105 range.
Keeping a watch on this stock, leaving my notes here for community discussion.
Please note it’s not a trading advise by any means, please do your own research.
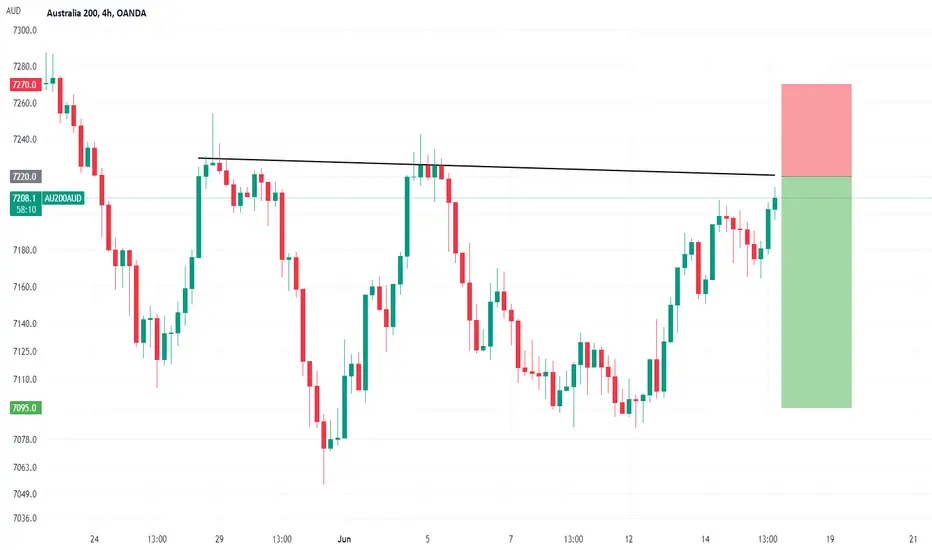
ASX to find sellers at trend line?ASX200 - 24h expiry
Although the bulls are in control, the stalling positive momentum indicates a turnaround is possible.
We are trading at overbought extremes.
This is negative for short term sentiment and we look to set shorts at good risk/reward levels for a further correction lower.
The hourly chart technicals suggests further upside before the downtrend returns.
We look to sell rallies.
We look to Sell at 7220 (stop at 7270)
Our profit targets will be 7095 and 7065
Resistance: 7305 / 7435 / 7600
Support: 7120 / 7010 / 6825
Risk Disclaimer
The trade ideas beyond this page are for informational purposes only and do not constitute investment advice or a solicitation to trade. This information is provided by Signal Centre, a third-party unaffiliated with OANDA, and is intended for general circulation only. OANDA does not guarantee the accuracy of this information and assumes no responsibilities for the information provided by the third party. The information does not take into account the specific investment objectives, financial situation, or particular needs of any particular person. You should take into account your specific investment objectives, financial situation, and particular needs before making a commitment to trade, including seeking advice from an independent financial adviser regarding the suitability of the investment, under a separate engagement, as you deem fit.
You accept that you assume all risks in independently viewing the contents and selecting a chosen strategy.
Where the research is distributed in Singapore to a person who is not an Accredited Investor, Expert Investor or an Institutional Investor, Oanda Asia Pacific Pte Ltd (“OAP“) accepts legal responsibility for the contents of the report to such persons only to the extent required by law. Singapore customers should contact OAP at 6579 8289 for matters arising from, or in connection with, the information/research distributed.
ASX in a trend of lower highs.ASX200 - 24h expiry - We look to Sell at 7210 (stop at 7260)
Posted a Double Bottom formation.
Neckline comes in at 7133.
We are trading at overbought extremes.
This is negative for short term sentiment and we look to set shorts at good risk/reward levels for a further correction lower.
The 200 day moving average should provide resistance at 7210.
Our profit targets will be 7085 and 7010
Resistance: 7215 / 7435 / 7600
Support: 7010 / 6825 / 6660
Risk Disclaimer
The trade ideas beyond this page are for informational purposes only and do not constitute investment advice or a solicitation to trade. This information is provided by Signal Centre, a third-party unaffiliated with OANDA, and is intended for general circulation only. OANDA does not guarantee the accuracy of this information and assumes no responsibilities for the information provided by the third party. The information does not take into account the specific investment objectives, financial situation, or particular needs of any particular person. You should take into account your specific investment objectives, financial situation, and particular needs before making a commitment to trade, including seeking advice from an independent financial adviser regarding the suitability of the investment, under a separate engagement, as you deem fit.
You accept that you assume all risks in independently viewing the contents and selecting a chosen strategy.
Where the research is distributed in Singapore to a person who is not an Accredited Investor, Expert Investor or an Institutional Investor, Oanda Asia Pacific Pte Ltd (“OAP“) accepts legal responsibility for the contents of the report to such persons only to the extent required by law. Singapore customers should contact OAP at 6579 8289 for matters arising from, or in connection with, the information/research distributed.

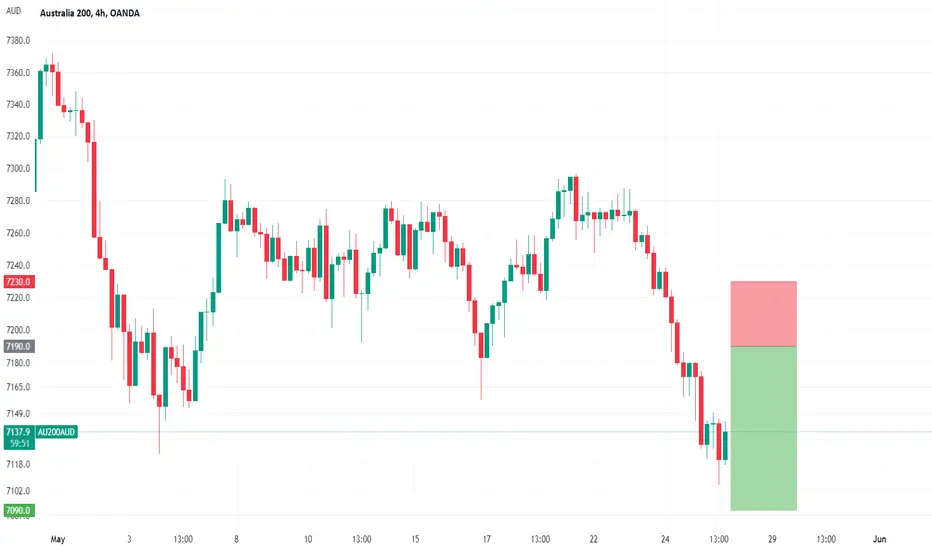
AU200 to see a temporary move higher?ASX200 - 24h expiry
Previous support level of 7129 broken.
Short term bias has turned negative.
Preferred trade is to sell into rallies.
The hourly chart technicals suggests further upside before the downtrend returns.
Further downside is expected although we prefer to sell into rallies close to the 7190 level.
We look to Sell at 7190 (stop at 7230)
Our profit targets will be 7090 and 7010
Resistance: 7215 / 7305 / 7435
Support: 7010 / 6825 / 6660
Risk Disclaimer
The trade ideas beyond this page are for informational purposes only and do not constitute investment advice or a solicitation to trade. This information is provided by Signal Centre, a third-party unaffiliated with OANDA, and is intended for general circulation only. OANDA does not guarantee the accuracy of this information and assumes no responsibilities for the information provided by the third party. The information does not take into account the specific investment objectives, financial situation, or particular needs of any particular person. You should take into account your specific investment objectives, financial situation, and particular needs before making a commitment to trade, including seeking advice from an independent financial adviser regarding the suitability of the investment, under a separate engagement, as you deem fit.
You accept that you assume all risks in independently viewing the contents and selecting a chosen strategy.
Where the research is distributed in Singapore to a person who is not an Accredited Investor, Expert Investor or an Institutional Investor, Oanda Asia Pacific Pte Ltd (“OAP“) accepts legal responsibility for the contents of the report to such persons only to the extent required by law. Singapore customers should contact OAP at 6579 8289 for matters arising from, or in connection with, the information/research distributed.
Hopes for a accurate trend predictiontest this stuff again 17/03 /2023
hoping for green
but orange would be a more likely wave form
Selling ASX200 at the top.ASX200 - 22h expiry - We look to Sell at 7025 (stop at 7090)
We are trading at overbought extremes.
Previous resistance located at 7028.
A lower correction is expected.
The hourly chart technicals suggests further upside before the downtrend returns.
Preferred trade is to sell into rallies.
Although the anticipated move lower is corrective, it does offer ample risk/reward today.
Our profit targets will be 6845 and 6770
Resistance: 7140 / 7340 / 7590
Support: 6770 / 6580 / 6400
Disclaimer – Saxo Bank Group.
Please be reminded – you alone are responsible for your trading – both gains and losses. There is a very high degree of risk involved in trading. The technical analysis , like any and all indicators, strategies, columns, articles and other features accessible on/though this site (including those from Signal Centre) are for informational purposes only and should not be construed as investment advice by you. Such technical analysis are believed to be obtained from sources believed to be reliable, but not warrant their respective completeness or accuracy, or warrant any results from the use of the information. Your use of the technical analysis , as would also your use of any and all mentioned indicators, strategies, columns, articles and all other features, is entirely at your own risk and it is your sole responsibility to evaluate the accuracy, completeness and usefulness (including suitability) of the information. You should assess the risk of any trade with your financial adviser and make your own independent decision(s) regarding any tradable products which may be the subject matter of the technical analysis or any of the said indicators, strategies, columns, articles and all other features.
Please also be reminded that if despite the above, any of the said technical analysis (or any of the said indicators, strategies, columns, articles and other features accessible on/through this site) is found to be advisory or a recommendation; and not merely informational in nature, the same is in any event provided with the intention of being for general circulation and availability only. As such it is not intended to and does not form part of any offer or recommendation directed at you specifically, or have any regard to the investment objectives, financial situation or needs of yourself or any other specific person. Before committing to a trade or investment therefore, please seek advice from a financial or other professional adviser regarding the suitability of the product for you and (where available) read the relevant product offer/description documents, including the risk disclosures. If you do not wish to seek such financial advice, please still exercise your mind and consider carefully whether the product is suitable for you because you alone remain responsible for your trading – both gains and losses.

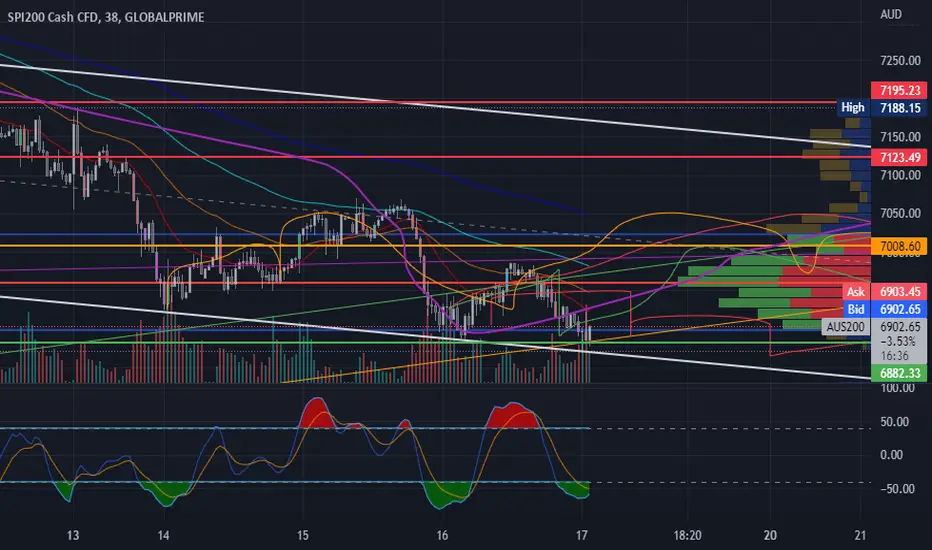
ASX 200ASX 200: bearish divergence at the top, and rejected from resistance zone as well. Right now at its hourly support of .618 Fib. Breaking this level tomorrow morning will take the price to .786 region, and after that 6400 support.
at 15 mins TF, a series of LH, LLs have been created already.

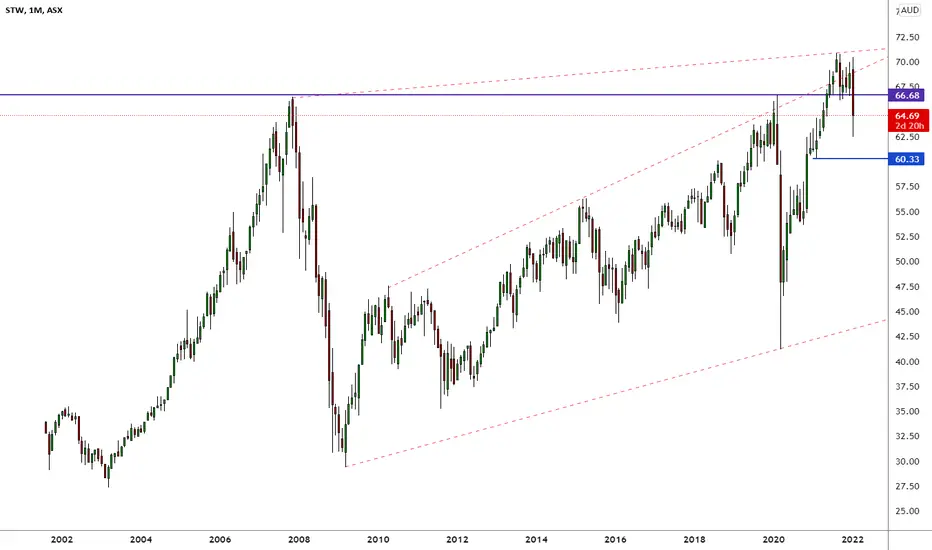
ETF:STW ASX200 key levels and trend lines analysis ASX:STW
sharing my view on the STW
Track Record – launched in August 2001, STW was the very first exchange-traded fund listed in Australia.
Core Index Exposure – a potential core Australian equity exposure for investors.
Diversification – low-cost exposure to over 90%1 of the Australian equity market capitalisation in a single transaction.
Capture Capital Growth and Income – capture potential stock growth opportunities, dividends and franking credits offered by 200 largest, and most liquid, publicly listed entities in the Australian equity market.
Rigorous Index Tracking – a rigorous investment approach that seeks to closely mirror the performance returns of the benchmark.
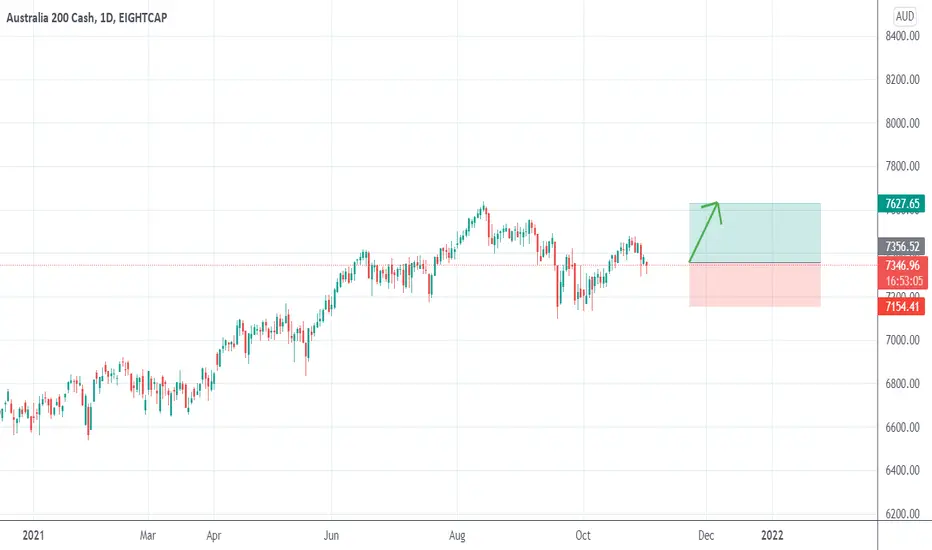
Asx200 to challenge ATH?After reaching a new ATH in mid-August, Asx200 started to correct and found support in 7100 zone.
At this moment we are in a correction following the first leg up since the recent low and the index can continue higher to challenge the ATH.
This scenario is negated if we have a drop under 7150
XJO Short (ASX200)Clear head and shoulders and in line with cycle count on SPX500. December target zone identified.

AUS200 SHORT and double channel AUS200 SHORT and double channel . stop abv last week high target 50-100dma
DSK - Could we see a pullback?DSK has rallied nicely, but the recent price action indicates that maybe price has gotten top heavy. It looks very overbought currently and may need a breather and a decent pull back, as it has printed a double top, coupled with MACD Bearish Divergence. It has also broken its trendline, which makes me believe that it may run out of steam and pull back lower. There is strong support at $3.30, which should hold and I believe if broken, we might see acceleration in price drop.
I have two buy zones (1st Buy Zone between $2.80 - $2.95) and (2nd Buy Zone between $2.50 - $2.70), where I think price may come to test as these are previous Resistance zones or congestion zones and also Fibonacci 50% and Fibonacci 61.8% zones (confluence). I would monitor price action at either of the two levels and would buy after bullish price action confirmation.
Please note these are my own notes, by no means trading advice. Please do your own research before entering into any trade.

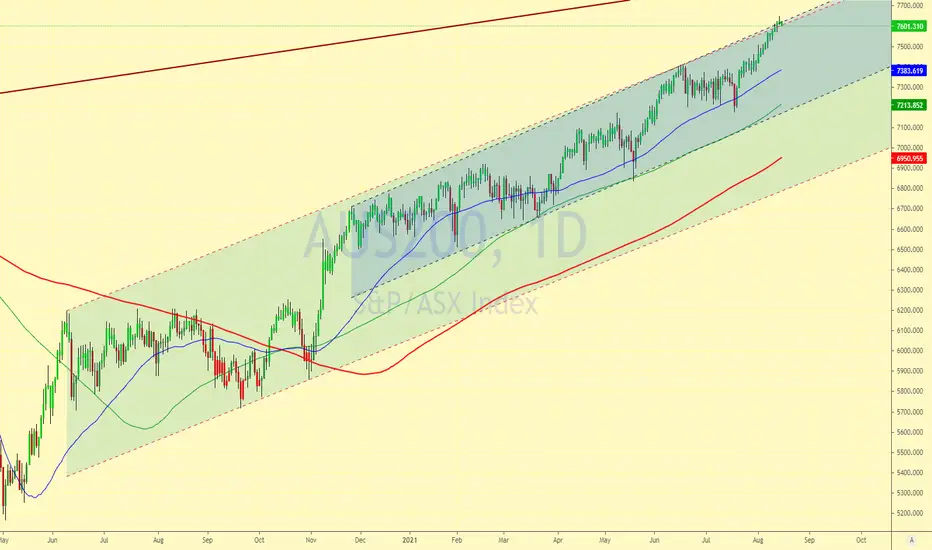
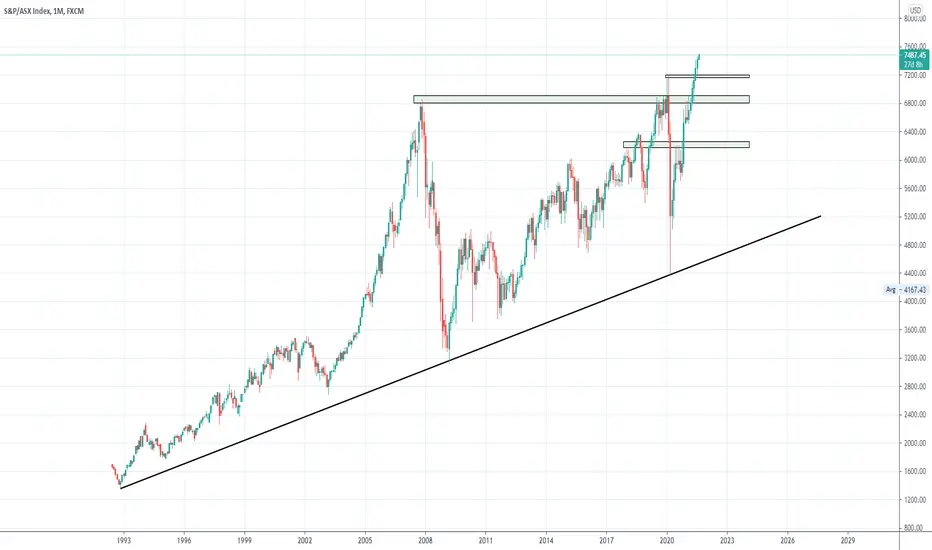
Australian stocks looking pretty goodAfter more than a decade of poor performance relative to other markets, the Australian stock market has clearly broken out. At least it has broken out in AUD terms, not USD terms (not yet). It's looking pretty strong and in my opinion it could continue much higher. Definitely one market that makes me have a more bullish outlook on stocks in general.
At some point it could return to 6300, but for now I can easily see it go to 10000 over the next 12-18 months.
Normal correction ahead for ANZANZ is moving in a 5 wave pattern and have already completed Wave 3.
Now it is heading for correction wave 4.
Once it reaches point A on the chart, we will see an bit of uptrend where it will meet point B. Post point B, it will continue its journey south
If you like my analysis then do drop a LIKE and a COMMENT. Also do SHARE it with your friends.
Also don't forget to smash that FOLLOW button to get daily analysis of multiple crypto currencies and sometime ASX stocks.
Note - These are my personal notes and in no way a financial advice. Do your own research and Trade wisely

AMPOL to DIP to 26.06 in coming daysOn a 2 hour chart, AMPOL is moving in 5 wave pattern, with Wave 3 completed as displayed on the chart.
From here it should drop to 26.06 where it will meet daily support, before bouncing up to 31-32 zone.
Expect a major drop once it reaches point 5. I will create new analysis once it is close to wave 5.
If you like my analysis then do drop a LIKE and a COMMENT. Also do SHARE it with your friends.
Also don't forget to smash that FOLLOW button to get daily analysis of multiple crypto currencies and sometime ASX stocks.
Note - These are my personal notes and in no way a financial advice. Do your own research and Trade wisely

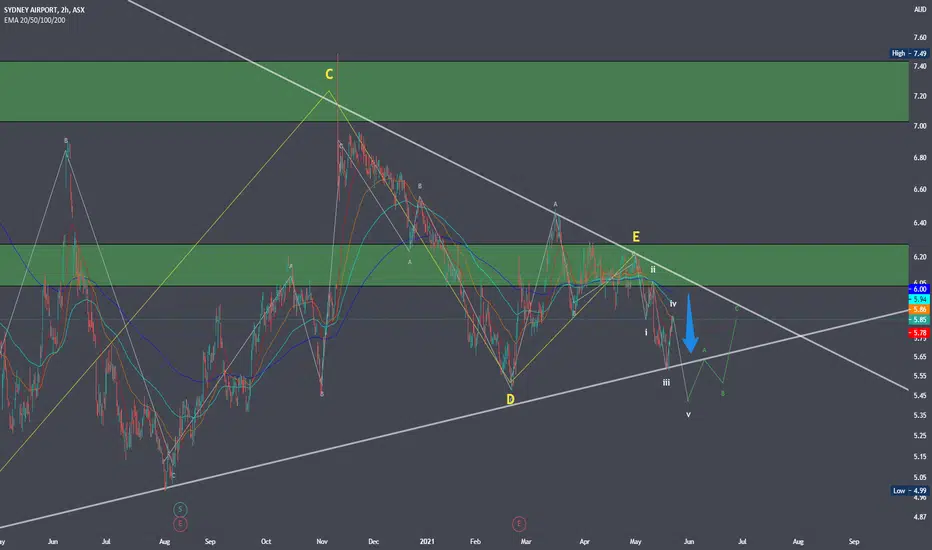
SYD Airport to Land soonIts been quite a challenging time for Sydney for quite some time and good days isn't near anytime soon.
Going by the chart, looks like SYD will dip more to around 5.35 level before bouncing up again.
Also all EMA's are above the price line which is a bearish sign.
Would be interested to see how long will SYD take to Take off.
If you like my analysis then do drop a LIKE and a COMMENT. Also do SHARE it with your friends.
Also don't forget to smash that FOLLOW button to get daily analysis of multiple crypto currencies and sometime ASX stocks.
Note - These are my personal notes and in no way a financial advice. Do your own research and Trade wisely
CWY - Possible Pullback in progressCWY has been going in a very good uptrend and appaently it seems that it has gone up quite far and facing some resistance. Hoping to see it retrace lower, ideally to the bullish trendline or towards the 200 SMA for a potential buy setup. I will see how it develops further if and when it comes lower for a pull back. My Buyzone is between $2.35 - $2.50, which is the trendline support area where I will be monitoring price action for a potential buy plan.
Please note these are my own notes, by no means trading advice. Please do your own research before entering into any trade.

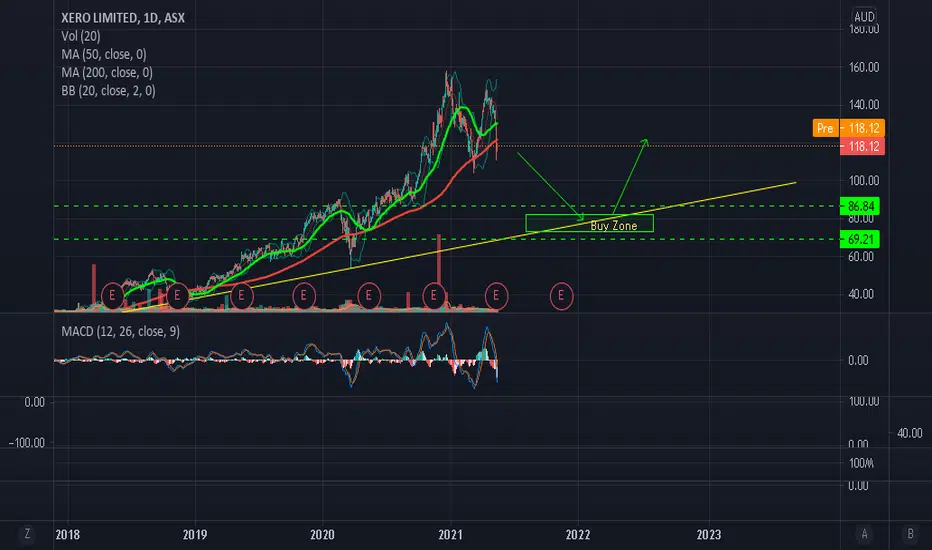
XRO - Road MapXRO has showed a spectacular run in 2020 but since Jan 2021, it seems that XRO needs a breather and the double top kind of price action shows that it might have turned or about to turn for a decent pull back. I will be a confident buyer at or near my buy zone between $78.00 and $80.00, which is also its trendline support. I will be closely watching price action if and when we get there.
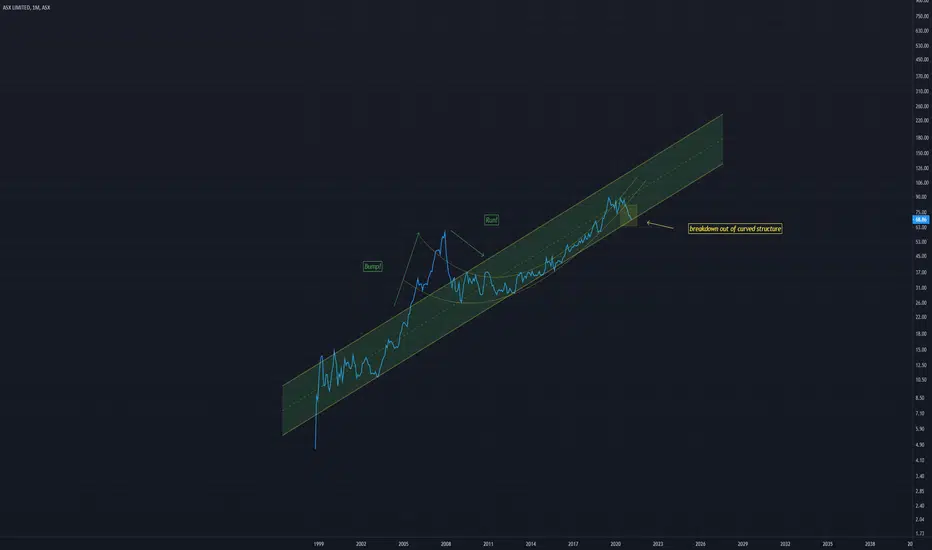
ASX Curved structure breakdownPrice has broken down from this curved structure
Although it is still within a larger channel
I feel this channel wont hold and a further breakdown will ensue
We will see
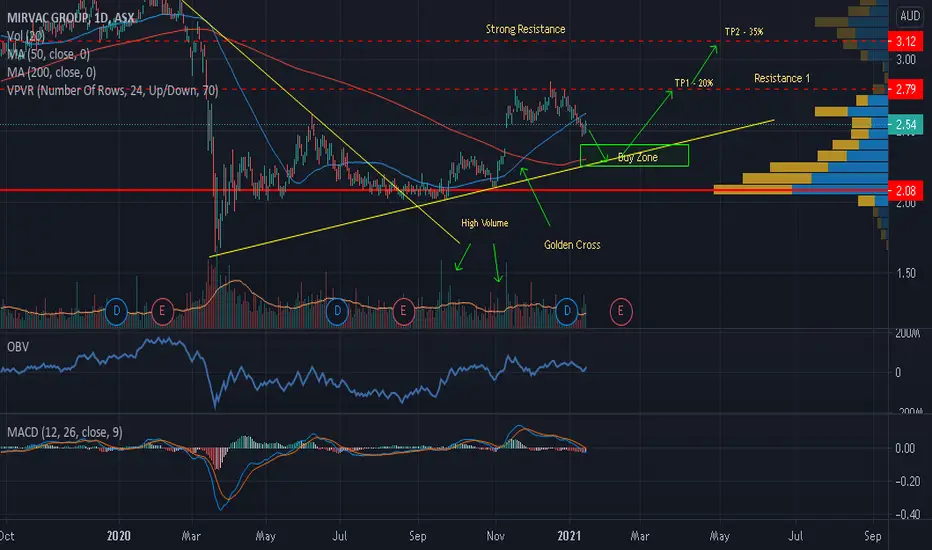
MGR - Uptrend Confirmed. Next Buying opportunityBullish trend confirmation indications:
1. Downtrend line broken.
2. Impulsive price action at the break of the trendline with High Volume
3. After the impulsive break, price is pulling back.
4. I would be a confident buyer within the Buy Zone which is the Fib Retracement Level Zone of
50-61.8 % and support of the trendline. The ideal Buying zone is between $2.20 - $2.40.
5. Good Buying Opportunity if it closes positive or prints a Bullish candlestick patterns in the Buy Zone area and on or near
the trendline with Bullish Price Action follow through. That will be a trade with confluence.
Please note these are my own notes, by no means trading advise. Please do your own research before entering into any trade.