ATAIMS TECHNICAL ANALYSISTechnical analysis for ATAIMS Stock based on Trend Analysis, Chart Pattern and VPA
ATAIMS
ATAIMS TRENDLINE BUY ON DIPS STRATEGYMYX:ATAIMS
UPTREND
FAST TURTLE BUY
FIFT BOD STAR
MCDX BANKER 65%
EXPERT SIGNAL TRENDING

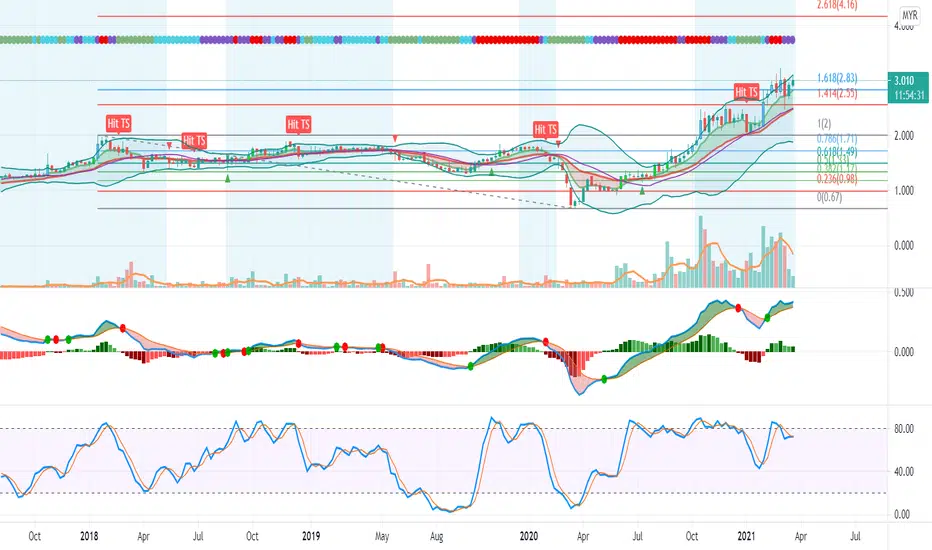
ATAIMS Mission to Find Next Resistance TF(1W)ATAIMS Mission to Find Next Resistance TF(1W)
ATAIMS is expected to fly high for long term time frame. The price already close above Fibonacci Retracement 161.8% (2.83) area. Then, will continue to find the next resistance at R1 = 4.16 . If volume overtake then a good sign for ATAIMS to fly high.
Time-Frame = TF(1W)
MACD Mode: Uptrend and bullish
Stochastic: Blue line cross up red line
This is not a buy call but just an idea for educational purpose only.
Disclaimer : Trade at Your Own Risk (TAYOR)
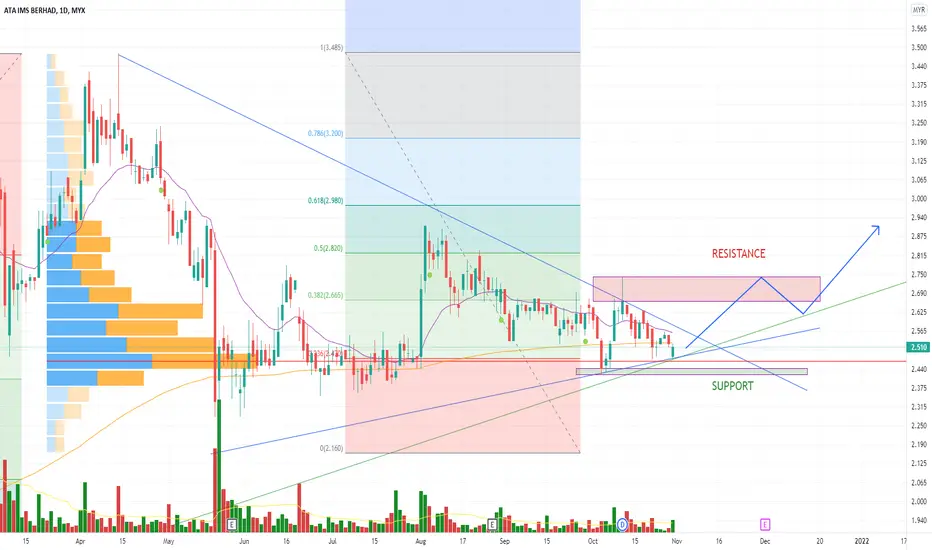
ATAIMS Breakout Play?MYX:ATAIMS
Inverse HNS
Slow Turtle Buy
FiFt Spike +ve bull recharge
Atom Buy
Volume spike
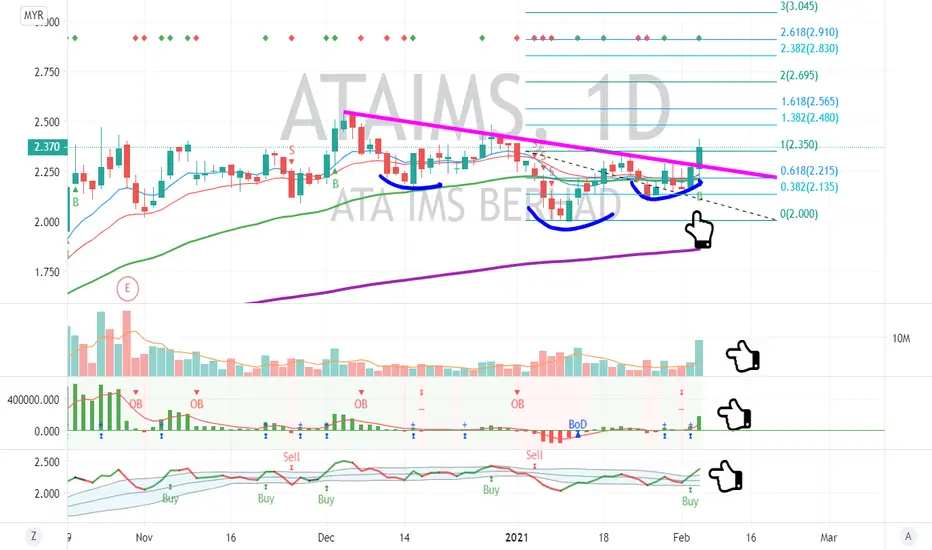
ATAIMS - new ATH?In H4, the stock just breakout from symmetrical triangle. Let the price breakout Lower High (LH) 2.35 for safer entry. MACD+RSI gives a breakout+momentum signal.
EP 2.36
TP 2.40, 2.47, 2.83 (Triangle opening), 2.91 (Fibo 1.272)
SL 2.18, 2.1, 2.02
Being one of sector leader in Containers and Packaging, ATAIMS is a heavy stock with very small balance float (7% of 1204M shares), still competitive with its lighter competitor TGUAN (25% of 380M shares).
TAYOR
