ATMUSDT UPDATE#ATM
UPDATE
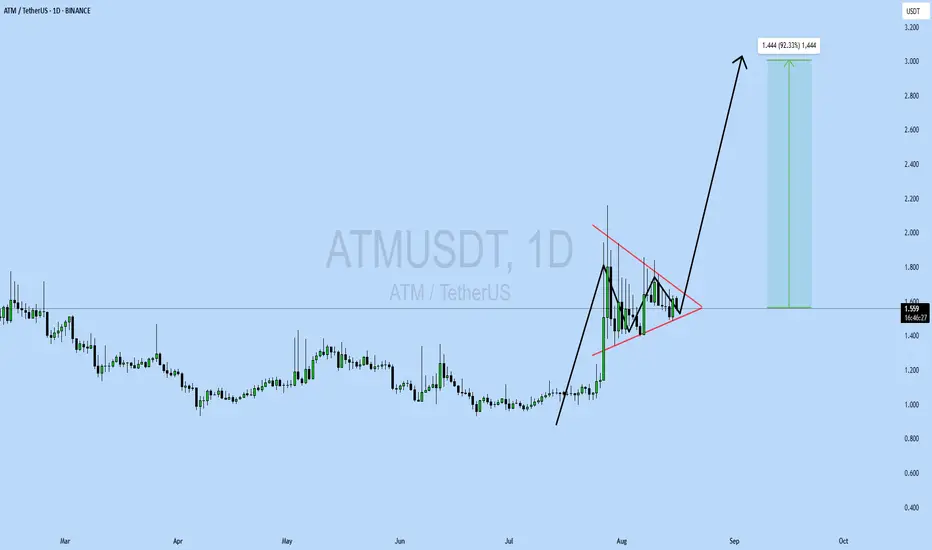
ATM Technical Setup
Pattern: Bullish Pennant pattern
Current Price: $1.565
Target Price: $3.00
Target % Gain: 92.33%
Technical Analysis: ATM is forming a bullish pennant on the 1D chart. After a strong impulse move, the price is consolidating within a narrowing range. A breakout from this structure backed by a strong trend continuation is likely, with volume supporting momentum.
Time Frame: 1D
Risk Management Tip: Always use proper risk management.
Atmusdtlong
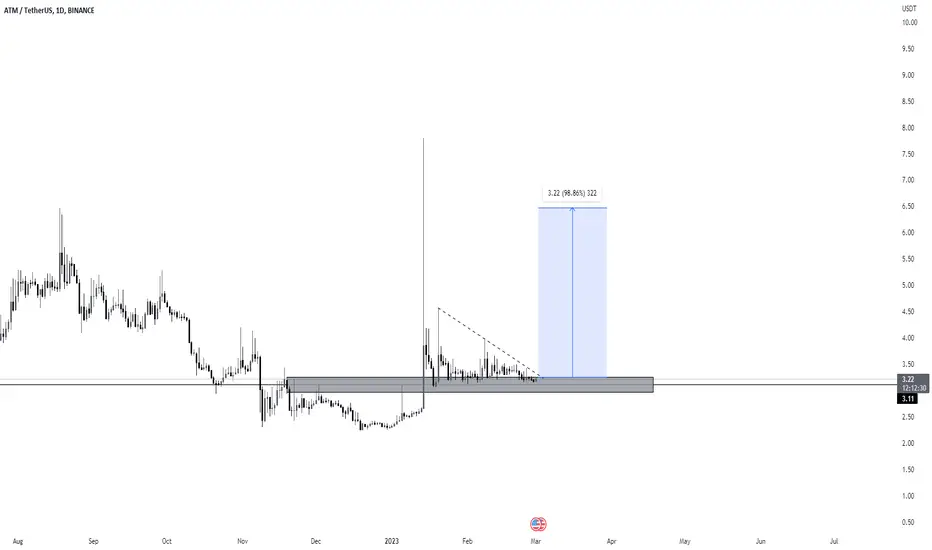
ATMUSDT Forming Descending TriangleATMUSDT is currently tracing a descending triangle pattern, typically viewed as a bearish continuation formation—but it can also flip into a bullish reversal when occurring at market lows or consolidation zones. This chart structure features a series of lower highs pushing into a flat support level, indicating that bullish interest is holding firm despite weakening upside momentum. A breakout above the upper trendline, particularly backed by strong volume, would signal a trend shift.
Volume has stayed solid throughout the pattern's formation, suggesting accumulation near support. If ATM can convincingly break upward through the upper boundary, we could see a robust rally in the range of 90% to 100%+—a substantial opportunity for swing traders.
Investor focus is heating up, with technical setups like symmetrical triangles and ABCD formations hinting at upside potential. Such pattern recognition, combined with rising volume and sentiment, makes this a high-probability trade setup.
Watch for a breakout above resistance with confirming volume and consider it a possible entry zone. Proper risk control around the support area will be key in capitalizing on this potential rally.
✅ Show your support by hitting the like button and
✅ Leaving a comment below! (What is your opinion about this Coin)
Your feedback and engagement keep me inspired to share more insightful market analysis with you!
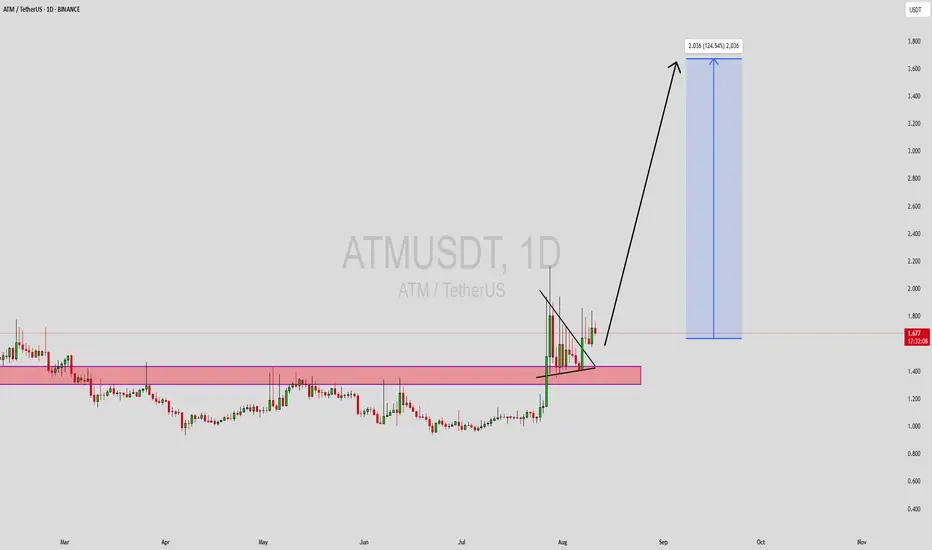
ATM/USDT Analysis, LONG!ATM/USDT Is trading inside of a triangle on a strong demand zone, will it be pumped again?
Looks good to me, im buying!