ATOM/USDT - SHORT----- Welcome, dear followers! -----
- Here is my trading methodology. I trade with a normal system and analysis of resistance and support, as well as price reversal patterns.
- For the record, I do not place a stop loss within my trades. So that I only risk 1.5% of my total capital in order to support the loss due to a price reversal against me.
- If a price reversed against my expectation and touched the drawn line r3, then I transferred targets to the entry point and waited for the price to close at it with a loss equal to almost zero.
- Today's deal is shown in the chart, and here are the entry and exit points below.
-- Support me with numbers and follow up on my account for other deals in the future. Thank you for coming to this part. --
-------------------------------------------------------
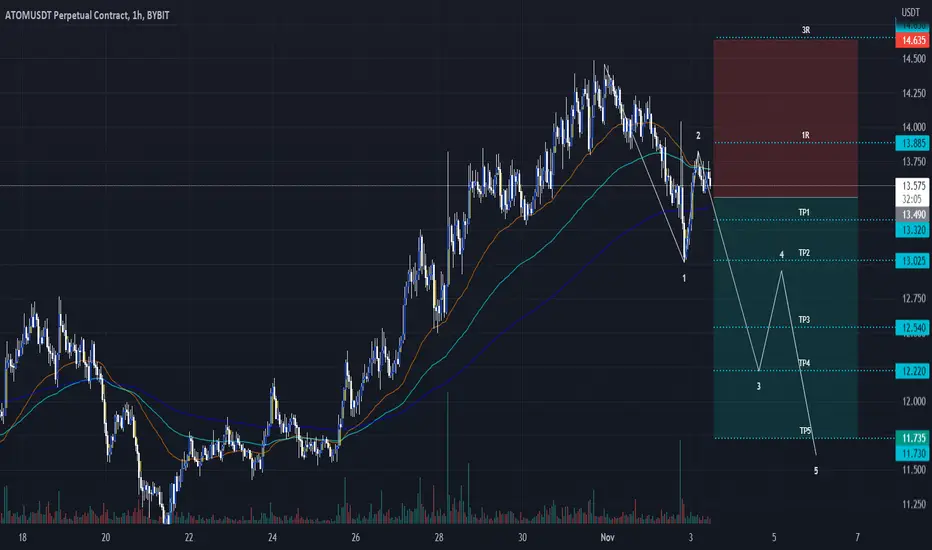
⚡️⚡️ #ATOM/USDT ⚡️⚡️
Client: My-ByBit USDT
Trade Type: Breakout (Short)
Leverage: Cross (3X)
Entry Targets:
1) 13.490 - 100.0%
Take-Profit Targets:
1) 13.320 - 20.0%
2) 13.025 - 20.0%
3) 12.540 - 20.0%
4) 12.220 - 20.0%
5) 11.730 - 20.0%
Trailing Configuration:
Entry: Percentage (0.0%)
Take-Profit: Percentage (0.333%)
Stop: Breakeven -
Trigger: Target (2)
ATOM
COSMOS/ATOM looking ready for 16$Nice pullback and bounce off 382 Fib. 16$ perfectly aligns with 16.50! Lets go

Cosmos (ATOM) - November 3Hello?
Welcome, traders.
By "following", you can always get new information quickly.
Please also click "Boost".
Have a good day.
-------------------------------------
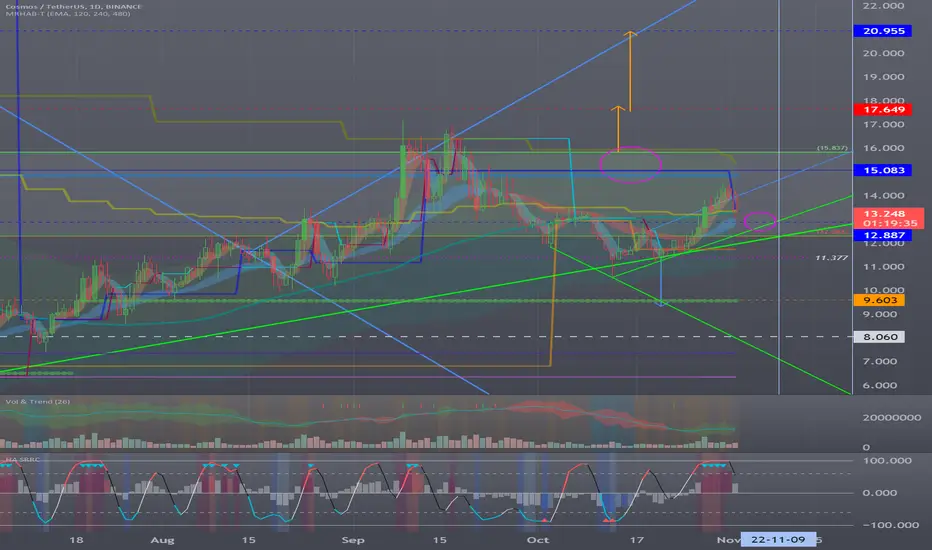
(ATOMUSDT 1W Chart)
Whether the 12.262-15.837 section is supported and able to rise is the key.
(1D chart)
If the price holds above 12.887 and above the M-Signal line of the 1W chart, it is expected that this will lead to an attempt to move higher above 15.083-15.837.
If not, you should check to see if it is supported near 12.282.
If it falls below 11.377, it is expected to drop to around 9.603, so Stop Loss is necessary to secure cash.
------------------------------------------------------------ -------------------------------------------
** All descriptions are for reference only and do not guarantee a profit or loss in investment.
** If you share this chart, you can use the indicators normally.
** The MRHAB-T indicator contains indicators that indicate support and resistance points.
** HA SRRC indicators are expressed as StochRSI(line), RSI(columns), CCI(bgcolor).
** CCI indicator is expressed as overbought range (CCI > +100) and oversold range (CCI < -100).
(Short-term Stop Loss can be said to be a point where profit and loss can be preserved or additional entry can be made through split trading. It is a short-term investment perspective.)
---------------------------------
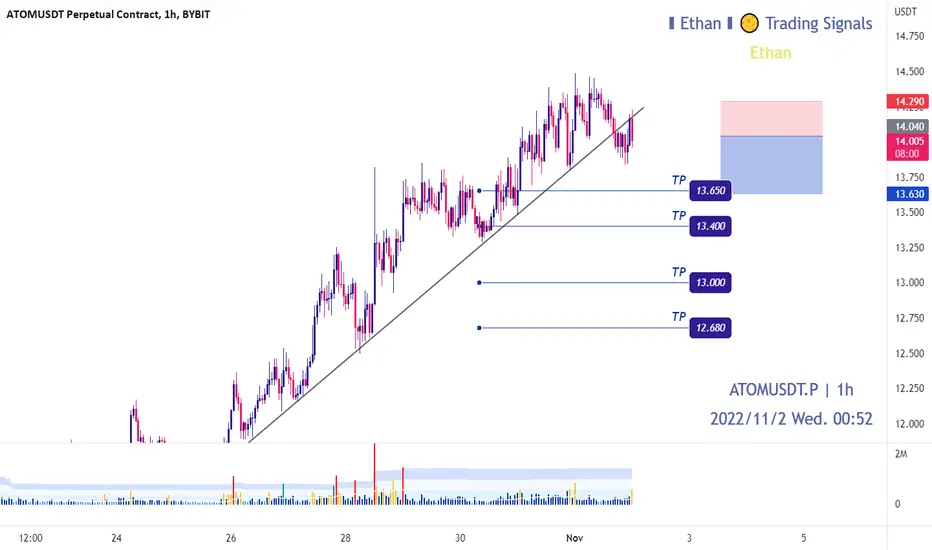
ATOM - Selling SignalBYBIT:ATOMUSDT.P
1H time frame
-
ATOM broke the long-term uptrend and retested it already, it stands for the validation of resistance.
We can open short with good RRR here.
-
Entry: Market
TP: 13.65, 13.4, 13, 12.65
SL: if it goes above the uptrend
BRIEFING Week #44 : A new Path for the FED ?!Here's your weekly update ! Brought to you each weekend with years of track-record history..
Don't forget to hit the like/follow button if you feel like this post deserves it ;)
That's the best way to support me and help pushing this content to other users.
Kindly,
Phil

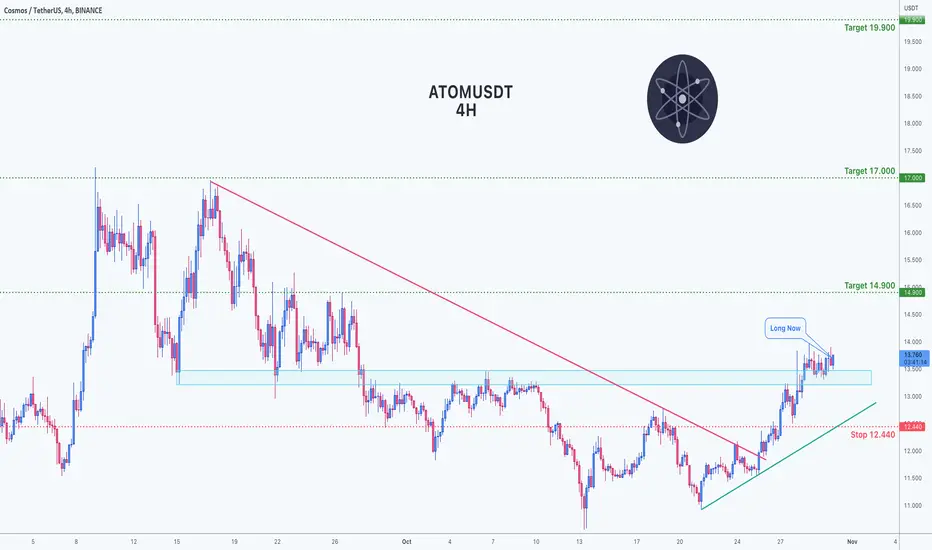
Trading opportunity for ATOMUSDT CosmosBased on technical factors there is a Long position in :
📊 ATOMUSDT Cosmos
🔵 Long Now 13.710
🧯 Stop loss 12.440
🏹 Target 1 14.900
🏹 Target 2 17.000
🏹 Target 3 19.900
💸RISK : 1%
We hope it is profitable for you ❤️
Please support our activity with your likes👍 and comments📝
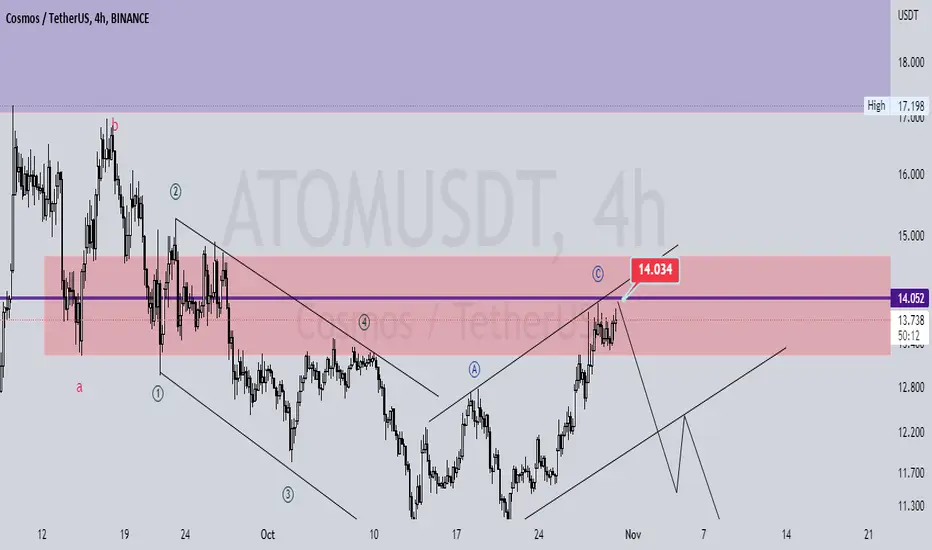
ATOMUSDT: Elliot Price Action 4hrHello dear friends. In this currency we see the end of correction wave and we expected start downtrend and this price very very important shown at the chart .be profit... please like and share
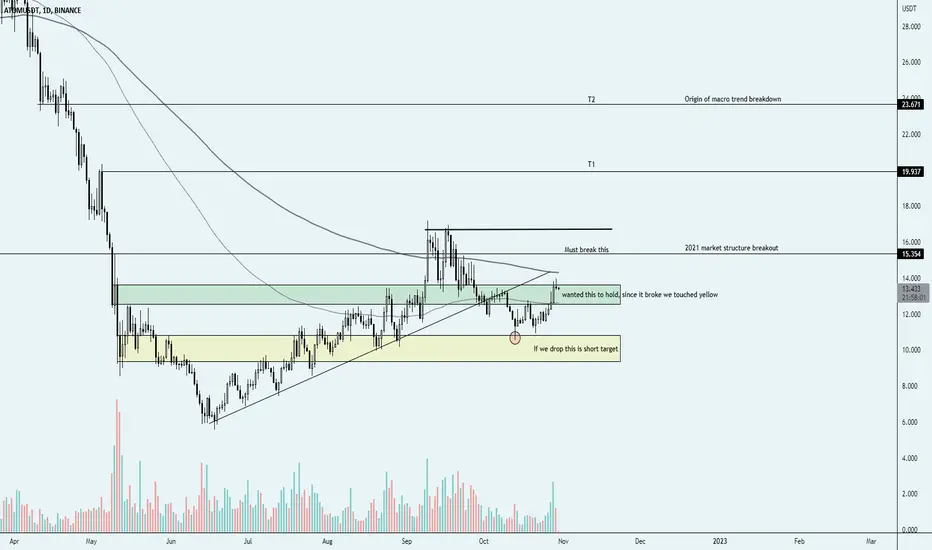
ATOM - Tagged Demand, now what?I shared this chart weeks ago and expected a tag in yellow if we broke down.
it broke down, tagged yellow and now pushing to the upside.
IF we get some strength in the market, this chart does not look too bad.
Targets above if we get a push, for obvious reasons yellow must hold now.
Cheers
long atom #ATOM / Futures
🟢 Long Leverage 3X _ 8X
▶️ Entry: 13.70 _ 13.5 _ 13.31
❇️ TP :
1. 13.96
2. 14.37
3. 14.82
❌ SL : 12.81
Ehtemal midam ke 14.70 short beshe . chon pullbake in balaei ke dare mizane
be tp roye chart tavajoh nakoniid . eshtebah shode
tp neveshte shode
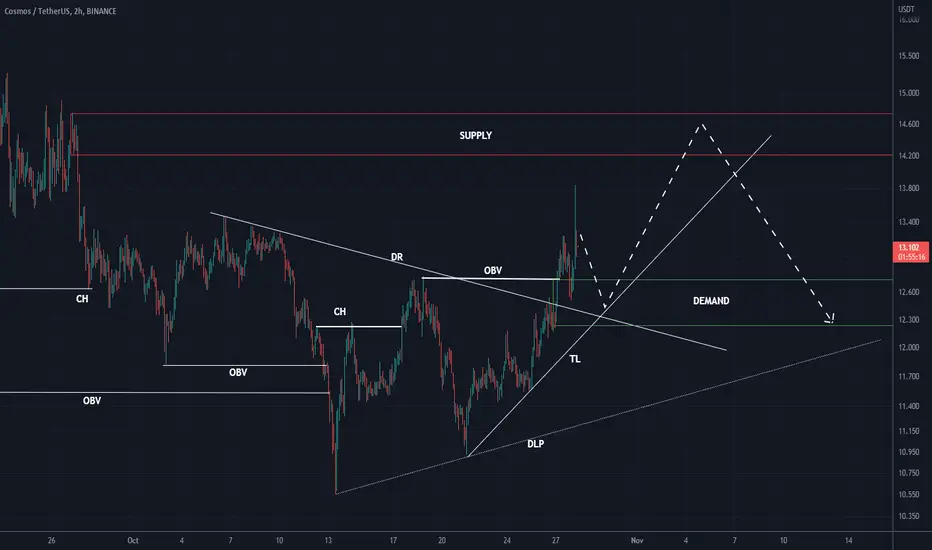
ATOM STATUSAccording to the recent break of structural and breaking resistances, if the atom reaches the supply zone, it can drop downwards. In this area, we should look for short setups
Comment if you have any questions
Thank You
Cosmos (ATOM) - October 27Hello?
Welcome, traders.
By "following", you can always get new information quickly.
Please also click "Boost".
Have a good day.
-------------------------------------
(ATOMUSDT 1W Chart)
Whether the 12.282-15.837 section is supported and able to rise is the key.
(1D chart)
The key is to find support at or above the 11.377-12.282 zone and move higher than 15.083.
Otherwise, it is expected to fall below 9.603.
If it is supported and rises in the 15.083-18.837 section, it is expected to rise to around 22.948.
------------------------------------------------------------ -------------------------------------------
** All descriptions are for reference only and do not guarantee a profit or loss in investment.
** If you share this chart, you can use the indicators normally.
** The MRHAB-T indicator contains indicators that indicate support and resistance points.
** SR_R_C indicators are displayed as StochRSI(line), RSI(columns), CCI(bgcolor).
** CCI indicator is expressed as overbought range (CCI > +100) and oversold range (CCI < -100).
(Short-term Stop Loss can be said to be a point where profit and loss can be preserved or additional entry can be made through split trading. It is a short-term investment perspective.)
---------------------------------

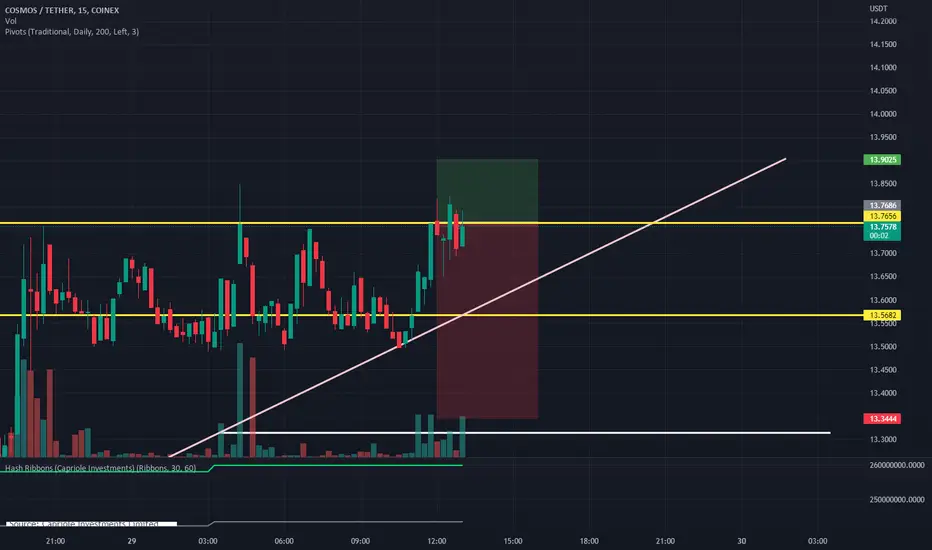
ATOM LONG (Day Trade)I like Atom here making higher lows.
Would take this long if it gets triggered.
Valid only for the next 24 hours.

Cosmos longCosmos broke trough off the upper boundary of descending channel. Asset broke trough off the resistance level. Bullish movement to resistance level at 14.7 is expected to happen.

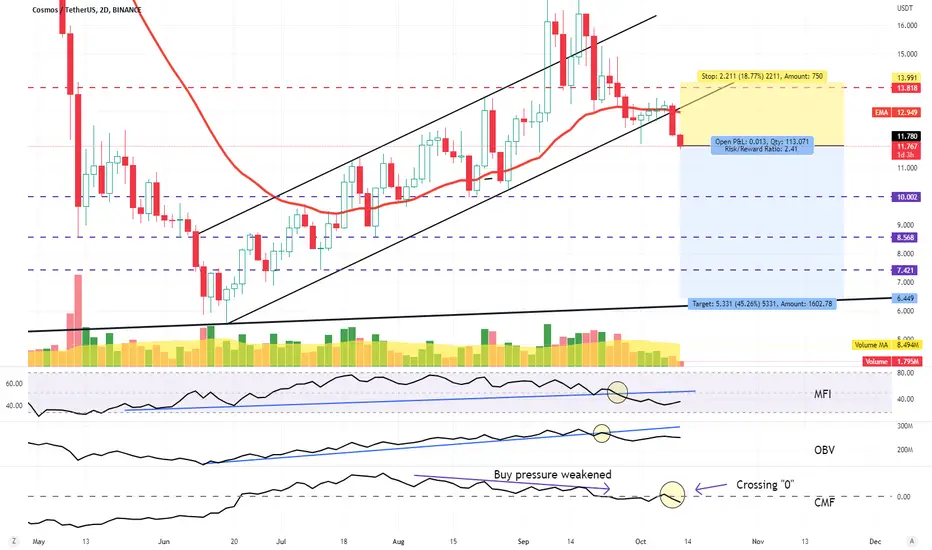
Short ATOMATOM is the best large cap crypto which outperformed almost other ones since mid June. However, the hype was not maintained, as with other cryptos in this bear market.
In 2D TF, the prices had broken the ascending channel and already lost 10% from the breaking point.
Volume indicators MFI and OBV had also broken their trendlines. Moreover, CMF crossed "0" with continously declining buy pressure.
ATOMUSDT shortwaiting for CHoCH on 5-15 min and open short , follow the risk management and don't forget to put stop loss

ATOM Trend Broken!!KEY Levels mapped!
Love it or hate it, hit that thumbs up and share your thoughts below!
Every day the charts provide new information. You have to adjust or get REKT.
Don't trade with what you're not willing to lose. Safe Trading, Calculate Your Risk/Reward & Collect!
This is not financial advice. This is for educational purposes only.

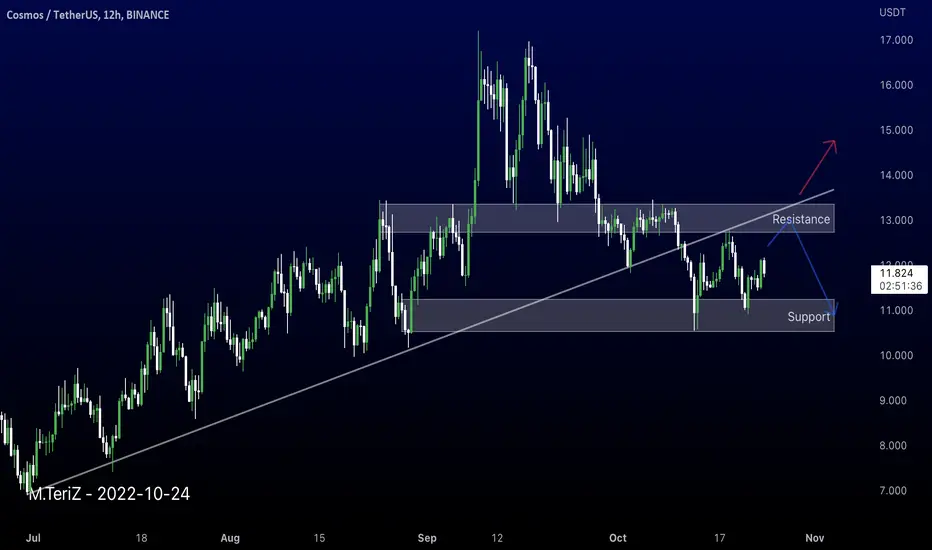
ATOMusdt 12H TrendLine & Resistance According to the chart, the upward trend line has broken down and is close to the resistance zone. If this area is maintained, we expect the possibility of falling to support, and otherwise, the analysis will be updated with the break of the trend line.
Its not Buy or Sell SIGNAL
DYOR
BY : M.TeriZ - @AtonicShark

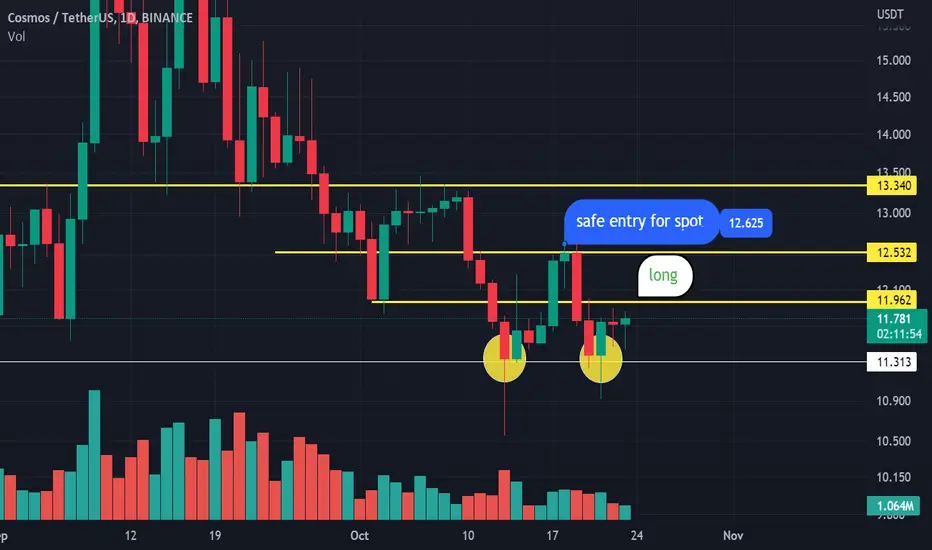
ATOM USDT Hello my frinds
i think this week we start a new trand
i hope you all enjoy this signal for futuer and spot
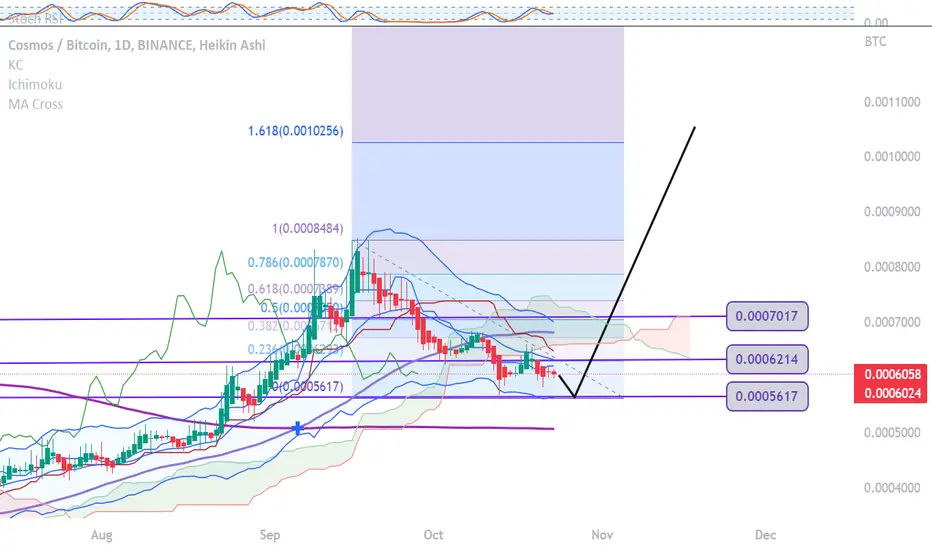
ATOMBTCATOMBTC: ATOMBTC can reach the lower edge of the keltner channel at 0.0005617 to pull back towards 0.0006708. The crossing of the moving averages indicated on the chart favors this upward climb.
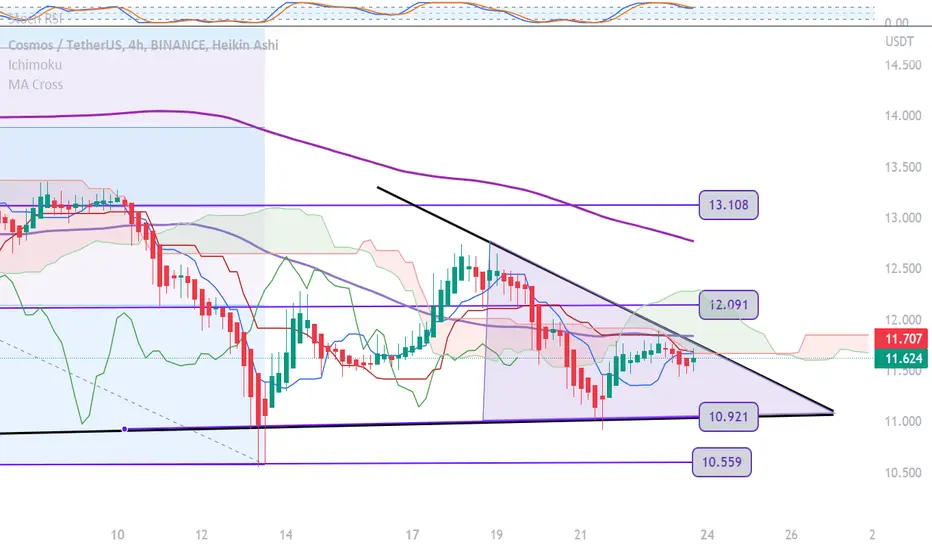
ATOMUSDT 4HATOMUSDT - Perfect triangular formation, you can still fetch the lower edge of the triangular base at $10,921. Here are its next supports and resistances:
S: 10,921 / 10,559
A: 11,855 / 12,091 / 12,789 / 13,108
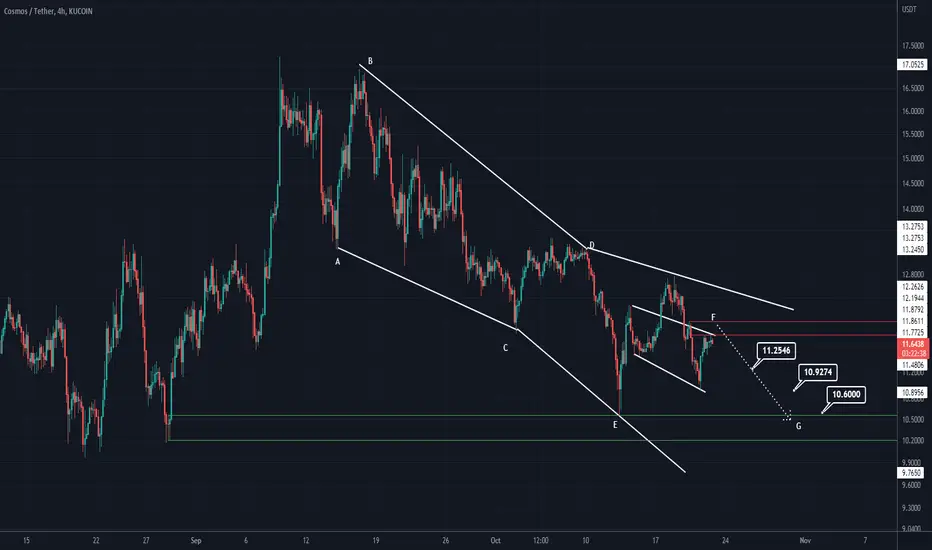
ATOM WAVE PATTERNHello dear traders, how are you? I hope you are fine
I detected a diametric in the 4-hour time frame that the F-wave has turned into a contraction reverse triangle. We will have a fall soon
Comment if you have any questions
Thank You
Cosmos Surprising- Atom have been more bullish than others altcoins on his come back.
- Seems like we got a Bottom around 5.4$.
- Like always in cryptos, everything can happen as most of altcoins will follow TheKing, so invest wisely.
-----------------------------------------------------
Trade Setup
-----------------------------------------------------
Buy Zones : 11.5$ - 10.5$
- TP1 : 19.5$
- TP2 : 29$
-----------------------------------------------------
2 strategies for this trade :
-----------------------------------------------------
1/ - Set a Stop Loss around : 9.5$
- i never do that because cryptos are too volatiles and can make fast dip wicks, i prefer DCA rebuy.
2/ - invest only 25% at actual price and keep some juice.
- invest 75% if Atom back to Bottom around 5.5$
-----------------------------------------------------
Stay Safe ! Happy Tr4Ding!
