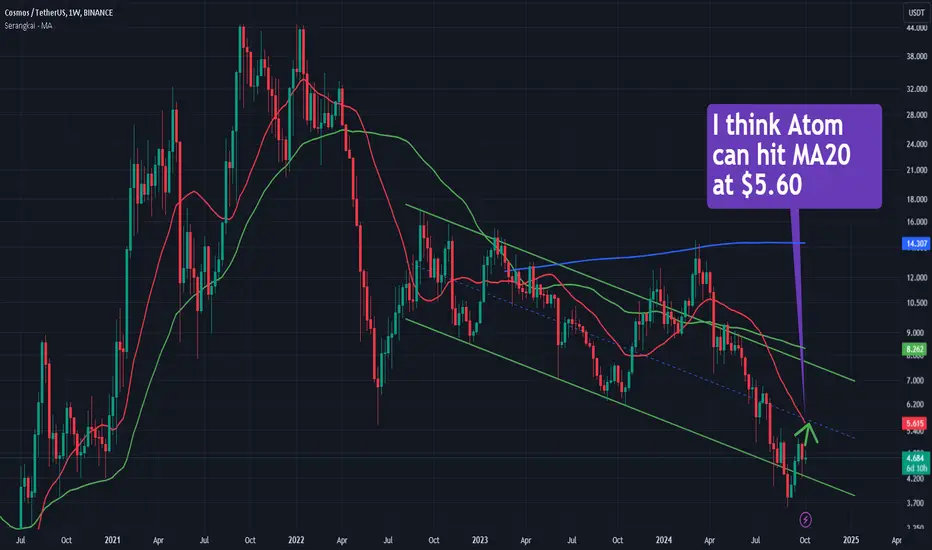
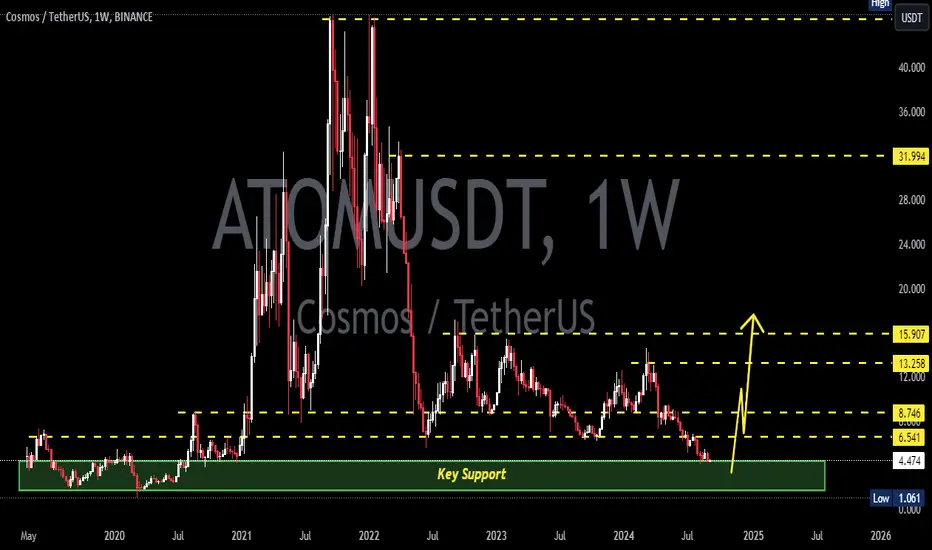
SasanSeifi| Will It Rebound or Drop Further?Hey there, ✌In the weekly timeframe, as you can see, Atom's price has been in a downtrend from the $8.50 range and has now corrected to the crucial weekly support level at $4. Currently, the price is trading around $4.
In the long-term timeframe, maintaining the $4 level is crucial. The price has reacted to this important support, and if it consolidates here with confirmation on lower timeframes, we could expect a potential rebound with positive fluctuations toward the $5 and $6.50 levels.
If positive momentum develops, we should watch how the price reacts to the $6.50 level. To continue the bullish trend and reach the target supply zone of $7 to $8, breaking the $6.50 level is necessary.
On the other hand, if the $4 level breaks and the price stabilizes below it, the likelihood of further correction increases, with potential downside targets of $3.20 to $2.30.
🔶The chart is in logarithmic scale.
This analysis is my personal viewpoint and not financial advice. If you found this helpful, please like and comment – I’d love to hear your thoughts! Happy trading! ✌😊
ATOM

BRIEFING Week #40: Money Starts to MoveHere's your weekly update ! Brought to you each weekend with years of track-record history..
Don't forget to hit the like/follow button if you feel like this post deserves it ;)
That's the best way to support me and help pushing this content to other users.
Kindly,
Phil

BRIEFING Week #39 : China RoaringHere's your weekly update ! Brought to you each weekend with years of track-record history..
Don't forget to hit the like/follow button if you feel like this post deserves it ;)
That's the best way to support me and help pushing this content to other users.
Kindly,
Phil

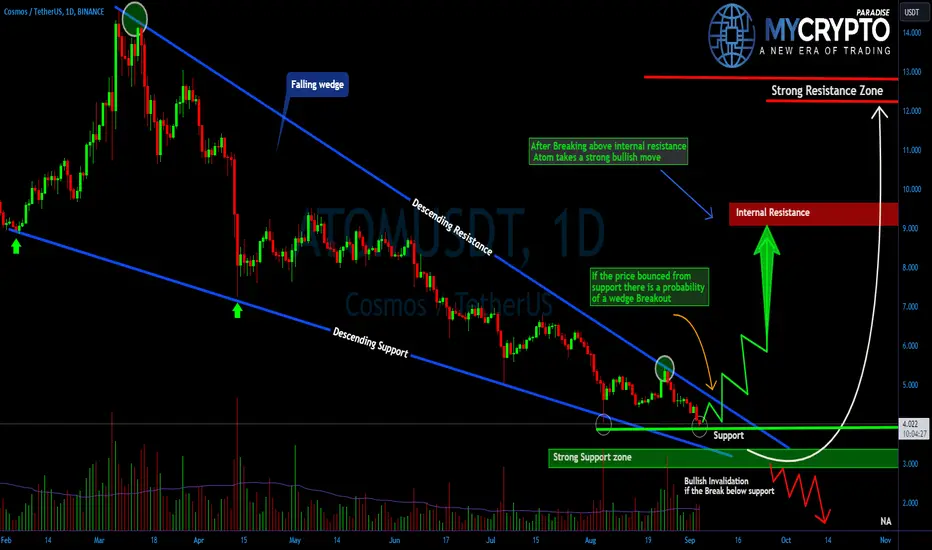
Breakout Alert: #ATOM Ready for Massive Move After the BreakoutYello, Paradisers! Are we on the edge of a massive move that could change the game for #ATOM? Let's discuss the latest analysis of #Cosmos:
💎#ATOMUSDT has just broken above a Descending Channel after a solid push from the Bullish Order Block (OB) at $4.087. This could be the moment we’ve been waiting for, as #Cosmos has been trapped in this formation for 4-5 months. But now, things are heating up, and we’re eyeing a potential shift toward bullish momentum.
💎For this rally to really take off, NASDAQ:ATOM needs to clear the key resistance at $5.43. If it manages to break through that level, the next probable target will be a major resistance zone—where a much stronger rally could ignite.
💎But, don’t celebrate just yet! If NASDAQ:ATOM loses momentum, we might see a pullback to retest the breakout around the Bullish OB to capture liquidity again. Failing to hold here could send the price back down toward the lower demand zone at $3.66.
💎A breakdown below this support flips the script entirely, putting the bears back in charge and potentially driving #Cosmos even lower.
Stay focused, patient, and disciplined, Paradisers🥂
MyCryptoParadise
iFeel the success🌴

BRIEFING Week #38 : Interesting Market MovesHere's your weekly update ! Brought to you each weekend with years of track-record history..
Don't forget to hit the like/follow button if you feel like this post deserves it ;)
That's the best way to support me and help pushing this content to other users.
Kindly,
Phil

XRPUSDT SHORT 15M TF🚀The Atom Signals Trading View Indicator is a sophisticated tool designed for traders seeking to enhance their market analysis and trading strategies. Developed with the intention of providing clear and actionable signals, this indicator leverages a blend of technical analysis techniques to identify potential entry and exit points in the market. It aims to simplify the decision-making process by offering visual cues and alerts, which can be particularly valuable for both novice and experienced traders.🤖
🚀Key features of the Atom Signals Indicator include its adaptability to various trading styles—whether you're a day trader, swing trader, or long-term investor. By incorporating elements like trend detection, momentum analysis, and support/resistance levels, it provides a comprehensive overview of market conditions. This versatility makes it a useful addition to any trader's toolkit, regardless of the asset class they are focusing on, be it stocks, forex, cryptocurrencies, or commodities.🤖
🚀With its user-friendly interface on Trading View, the Atom Signals Indicator is accessible to traders of all experience levels. It not only aids in identifying trading opportunities but also assists in managing risk by highlighting potential reversals or consolidations. Whether you're looking to fine-tune your strategy or gain a fresh perspective on market movements, the Atom Signals Trading View Indicator offers a valuable resource for informed decision-making in the fast-paced world of trading.🤖
Based on the indicator we predict as shown in the charts.
You can check the indicator for free. Go to our links.
🚀Good Luck!

ETHUSDT LONG 15M TF🚀The Atom Signals Trading View Indicator is a sophisticated tool designed for traders seeking to enhance their market analysis and trading strategies. Developed with the intention of providing clear and actionable signals, this indicator leverages a blend of technical analysis techniques to identify potential entry and exit points in the market. It aims to simplify the decision-making process by offering visual cues and alerts, which can be particularly valuable for both novice and experienced traders.🤖
🚀Key features of the Atom Signals Indicator include its adaptability to various trading styles—whether you're a day trader, swing trader, or long-term investor. By incorporating elements like trend detection, momentum analysis, and support/resistance levels, it provides a comprehensive overview of market conditions. This versatility makes it a useful addition to any trader's toolkit, regardless of the asset class they are focusing on, be it stocks, forex, cryptocurrencies, or commodities.🤖
🚀With its user-friendly interface on Trading View, the Atom Signals Indicator is accessible to traders of all experience levels. It not only aids in identifying trading opportunities but also assists in managing risk by highlighting potential reversals or consolidations. Whether you're looking to fine-tune your strategy or gain a fresh perspective on market movements, the Atom Signals Trading View Indicator offers a valuable resource for informed decision-making in the fast-paced world of trading.🤖
Based on the indicator we predict as shown in the charts.
You can check the indicator for free. Go to our links.
🚀Good Luck!

BNBUSDT LONG 15M TF🚀The Atom Signals Trading View Indicator is a sophisticated tool designed for traders seeking to enhance their market analysis and trading strategies. Developed with the intention of providing clear and actionable signals, this indicator leverages a blend of technical analysis techniques to identify potential entry and exit points in the market. It aims to simplify the decision-making process by offering visual cues and alerts, which can be particularly valuable for both novice and experienced traders.🤖
🚀Key features of the Atom Signals Indicator include its adaptability to various trading styles—whether you're a day trader, swing trader, or long-term investor. By incorporating elements like trend detection, momentum analysis, and support/resistance levels, it provides a comprehensive overview of market conditions. This versatility makes it a useful addition to any trader's toolkit, regardless of the asset class they are focusing on, be it stocks, forex, cryptocurrencies, or commodities.🤖
🚀With its user-friendly interface on Trading View, the Atom Signals Indicator is accessible to traders of all experience levels. It not only aids in identifying trading opportunities but also assists in managing risk by highlighting potential reversals or consolidations. Whether you're looking to fine-tune your strategy or gain a fresh perspective on market movements, the Atom Signals Trading View Indicator offers a valuable resource for informed decision-making in the fast-paced world of trading.🤖
Based on the indicator we predict as shown in the charts.
You can check the indicator for free. Go to our links.
🚀Good Luck!

BTCUSDT LONG 15M TF🚀The Atom Signals Trading View Indicator is a sophisticated tool designed for traders seeking to enhance their market analysis and trading strategies. Developed with the intention of providing clear and actionable signals, this indicator leverages a blend of technical analysis techniques to identify potential entry and exit points in the market. It aims to simplify the decision-making process by offering visual cues and alerts, which can be particularly valuable for both novice and experienced traders.🤖
🚀Key features of the Atom Signals Indicator include its adaptability to various trading styles—whether you're a day trader, swing trader, or long-term investor. By incorporating elements like trend detection, momentum analysis, and support/resistance levels, it provides a comprehensive overview of market conditions. This versatility makes it a useful addition to any trader's toolkit, regardless of the asset class they are focusing on, be it stocks, forex, cryptocurrencies, or commodities.🤖
🚀With its user-friendly interface on Trading View, the Atom Signals Indicator is accessible to traders of all experience levels. It not only aids in identifying trading opportunities but also assists in managing risk by highlighting potential reversals or consolidations. Whether you're looking to fine-tune your strategy or gain a fresh perspective on market movements, the Atom Signals Trading View Indicator offers a valuable resource for informed decision-making in the fast-paced world of trading.🤖
Based on the indicator we predict as shown in the charts.
You can check the indicator for free. Go to our links.
🚀Good Luck!

XAGUSD LONG 15M TF🚀The Atom Signals Trading View Indicator is a sophisticated tool designed for traders seeking to enhance their market analysis and trading strategies. Developed with the intention of providing clear and actionable signals, this indicator leverages a blend of technical analysis techniques to identify potential entry and exit points in the market. It aims to simplify the decision-making process by offering visual cues and alerts, which can be particularly valuable for both novice and experienced traders.🤖
🚀Key features of the Atom Signals Indicator include its adaptability to various trading styles—whether you're a day trader, swing trader, or long-term investor. By incorporating elements like trend detection, momentum analysis, and support/resistance levels, it provides a comprehensive overview of market conditions. This versatility makes it a useful addition to any trader's toolkit, regardless of the asset class they are focusing on, be it stocks, forex, cryptocurrencies, or commodities.🤖
🚀With its user-friendly interface on Trading View, the Atom Signals Indicator is accessible to traders of all experience levels. It not only aids in identifying trading opportunities but also assists in managing risk by highlighting potential reversals or consolidations. Whether you're looking to fine-tune your strategy or gain a fresh perspective on market movements, the Atom Signals Trading View Indicator offers a valuable resource for informed decision-making in the fast-paced world of trading.🤖
Based on the indicator we predict as shown in the charts.
You can check the indicator for free. Go to our links.
🚀Good Luck!

OIL LONG 15M TF🚀The Atom Signals Trading View Indicator is a sophisticated tool designed for traders seeking to enhance their market analysis and trading strategies. Developed with the intention of providing clear and actionable signals, this indicator leverages a blend of technical analysis techniques to identify potential entry and exit points in the market. It aims to simplify the decision-making process by offering visual cues and alerts, which can be particularly valuable for both novice and experienced traders.🤖
🚀Key features of the Atom Signals Indicator include its adaptability to various trading styles—whether you're a day trader, swing trader, or long-term investor. By incorporating elements like trend detection, momentum analysis, and support/resistance levels, it provides a comprehensive overview of market conditions. This versatility makes it a useful addition to any trader's toolkit, regardless of the asset class they are focusing on, be it stocks, forex, cryptocurrencies, or commodities.🤖
🚀With its user-friendly interface on Trading View, the Atom Signals Indicator is accessible to traders of all experience levels. It not only aids in identifying trading opportunities but also assists in managing risk by highlighting potential reversals or consolidations. Whether you're looking to fine-tune your strategy or gain a fresh perspective on market movements, the Atom Signals Trading View Indicator offers a valuable resource for informed decision-making in the fast-paced world of trading.🤖
Based on the indicator we predict as shown in the charts.
You can check the indicator for free. Go to our links.
🚀Good Luck!

GBPUSD LONG 15M TF🚀The Atom Signals Trading View Indicator is a sophisticated tool designed for traders seeking to enhance their market analysis and trading strategies. Developed with the intention of providing clear and actionable signals, this indicator leverages a blend of technical analysis techniques to identify potential entry and exit points in the market. It aims to simplify the decision-making process by offering visual cues and alerts, which can be particularly valuable for both novice and experienced traders.🤖
🚀Key features of the Atom Signals Indicator include its adaptability to various trading styles—whether you're a day trader, swing trader, or long-term investor. By incorporating elements like trend detection, momentum analysis, and support/resistance levels, it provides a comprehensive overview of market conditions. This versatility makes it a useful addition to any trader's toolkit, regardless of the asset class they are focusing on, be it stocks, forex, cryptocurrencies, or commodities.🤖
🚀With its user-friendly interface on Trading View, the Atom Signals Indicator is accessible to traders of all experience levels. It not only aids in identifying trading opportunities but also assists in managing risk by highlighting potential reversals or consolidations. Whether you're looking to fine-tune your strategy or gain a fresh perspective on market movements, the Atom Signals Trading View Indicator offers a valuable resource for informed decision-making in the fast-paced world of trading.🤖
Based on the indicator we predict as shown in the charts.
You can check the indicator for free. Go to our links.
🚀Good Luck!

XAUSD LONG 15M TF🚀The Atom Signals Trading View Indicator is a sophisticated tool designed for traders seeking to enhance their market analysis and trading strategies. Developed with the intention of providing clear and actionable signals, this indicator leverages a blend of technical analysis techniques to identify potential entry and exit points in the market. It aims to simplify the decision-making process by offering visual cues and alerts, which can be particularly valuable for both novice and experienced traders.🤖
🚀Key features of the Atom Signals Indicator include its adaptability to various trading styles—whether you're a day trader, swing trader, or long-term investor. By incorporating elements like trend detection, momentum analysis, and support/resistance levels, it provides a comprehensive overview of market conditions. This versatility makes it a useful addition to any trader's toolkit, regardless of the asset class they are focusing on, be it stocks, forex, cryptocurrencies, or commodities.🤖
🚀With its user-friendly interface on Trading View, the Atom Signals Indicator is accessible to traders of all experience levels. It not only aids in identifying trading opportunities but also assists in managing risk by highlighting potential reversals or consolidations. Whether you're looking to fine-tune your strategy or gain a fresh perspective on market movements, the Atom Signals Trading View Indicator offers a valuable resource for informed decision-making in the fast-paced world of trading.🤖
Based on the indicator we predict as shown in the charts.
You can check the indicator for free. Go to our links.
🚀Good Luck!

EURUSD LONG 15M TF🚀The Atom Signals Trading View Indicator is a sophisticated tool designed for traders seeking to enhance their market analysis and trading strategies. Developed with the intention of providing clear and actionable signals, this indicator leverages a blend of technical analysis techniques to identify potential entry and exit points in the market. It aims to simplify the decision-making process by offering visual cues and alerts, which can be particularly valuable for both novice and experienced traders.🤖
🚀Key features of the Atom Signals Indicator include its adaptability to various trading styles—whether you're a day trader, swing trader, or long-term investor. By incorporating elements like trend detection, momentum analysis, and support/resistance levels, it provides a comprehensive overview of market conditions. This versatility makes it a useful addition to any trader's toolkit, regardless of the asset class they are focusing on, be it stocks, forex, cryptocurrencies, or commodities.🤖
🚀With its user-friendly interface on Trading View, the Atom Signals Indicator is accessible to traders of all experience levels. It not only aids in identifying trading opportunities but also assists in managing risk by highlighting potential reversals or consolidations. Whether you're looking to fine-tune your strategy or gain a fresh perspective on market movements, the Atom Signals Trading View Indicator offers a valuable resource for informed decision-making in the fast-paced world of trading.🤖
Based on the indicator we predict as shown in the charts.
You can check the indicator for free. Go to our links.
🚀Good Luck!

USDJPY SHORT 15M TF🚀The Atom Signals Trading View Indicator is a sophisticated tool designed for traders seeking to enhance their market analysis and trading strategies. Developed with the intention of providing clear and actionable signals, this indicator leverages a blend of technical analysis techniques to identify potential entry and exit points in the market. It aims to simplify the decision-making process by offering visual cues and alerts, which can be particularly valuable for both novice and experienced traders.🤖
🚀Key features of the Atom Signals Indicator include its adaptability to various trading styles—whether you're a day trader, swing trader, or long-term investor. By incorporating elements like trend detection, momentum analysis, and support/resistance levels, it provides a comprehensive overview of market conditions. This versatility makes it a useful addition to any trader's toolkit, regardless of the asset class they are focusing on, be it stocks, forex, cryptocurrencies, or commodities.🤖
🚀With its user-friendly interface on Trading View, the Atom Signals Indicator is accessible to traders of all experience levels. It not only aids in identifying trading opportunities but also assists in managing risk by highlighting potential reversals or consolidations. Whether you're looking to fine-tune your strategy or gain a fresh perspective on market movements, the Atom Signals Trading View Indicator offers a valuable resource for informed decision-making in the fast-paced world of trading.🤖
Based on the indicator we predict as shown in the charts.
You can check the indicator for free. Go to our links.
🚀Good Luck!

BRIEFING Week #37 : Wild Markets PersistHere's your weekly update ! Brought to you each weekend with years of track-record history..
Don't forget to hit the like/follow button if you feel like this post deserves it ;)
That's the best way to support me and help pushing this content to other users.
Kindly,
Phil

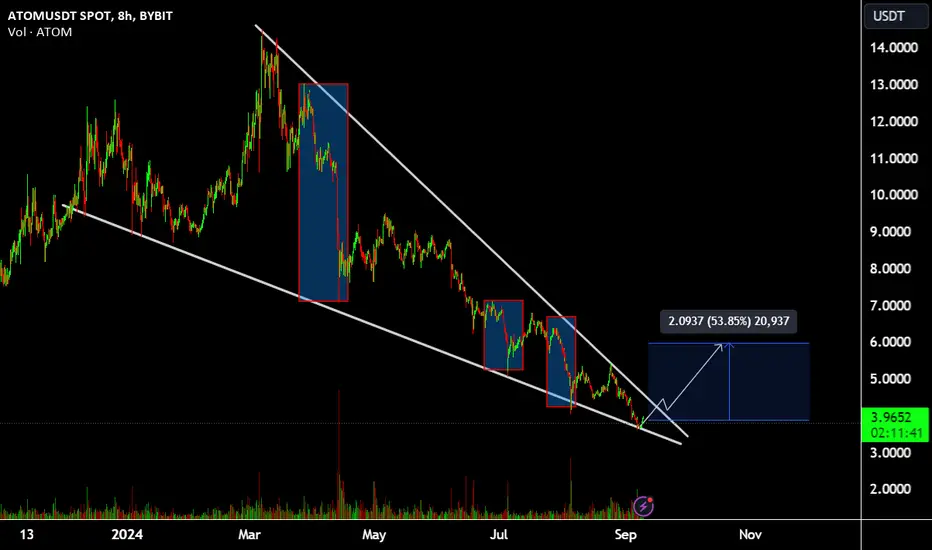
CRYPTO COIN - ATOM = LONG As I wrote in previous posts, many coins are currently forming a descending wedge. It can be noted that the ATOM coin was heavily sold off with large impulses. It's also clear that the coin bounced off the support zone, and in my opinion, it may now be breaking out of the wedge into play. The project itself is very promising and has many applications in cryptocurrency, which could increase buyer interest in purchasing it.
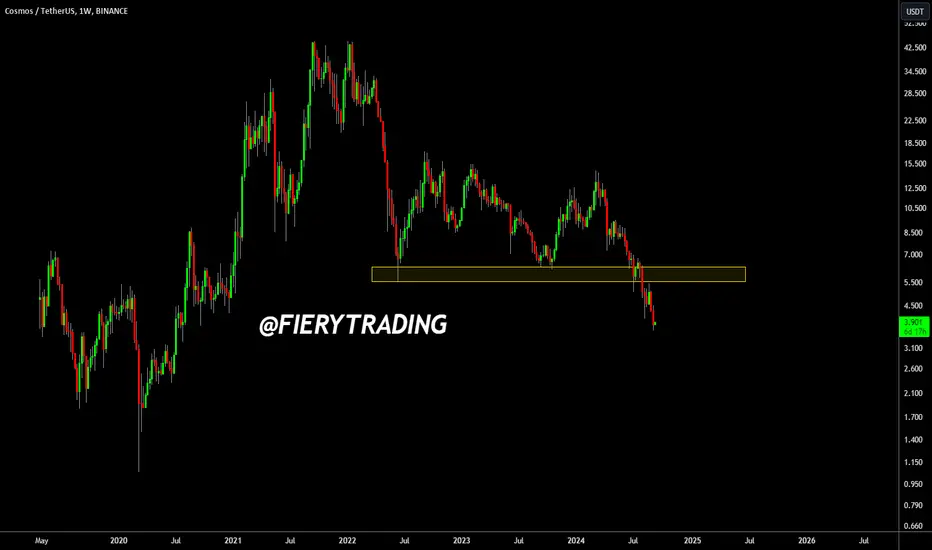
ATOM: Signaling Further Market Decline?In this analysis I want to take a closer look at the state of the market. ATOM Was a decent performing token in the previous cycle, but it sadly failed to impress investors this cycle.
Most striking is that ATOM is one of the few alts which has actually made a new bear-market low. This token has never entered a bullish phase like most tokens did and has basically made lower-lows throughout.
This token had a 5B marketcap just a few months ago, so we're seeing some serious money leaving this token. Naturally, there's something going on in the background which amplifies the sell-off, but I'm looking at it as a potential signal that the alt market is currently in a bad spot.
There's a lot of alts that are currently not far away from their bear-market lows. If we see more and more making fresh lows it could be an indication that more selling is yet to come.
ATOMUSDT: Ready for a Major Falling wedge breakout?Yello, Paradisers ! Are we standing on the brink of a breakout for #ATOMUSDT, or is another fake-out looming just around the corner? Let's delve into the latest technical signals and pinpoint the crucial price action that could dictate our next move!
💎#ATOMUSDT is currently flashing strong bullish signals. If it can rebound from the critical support zone at $4.035 to $3.893, there's a substantial probability of a falling wedge breakout. This could set the stage for a sustained upward trajectory, with the first target being a key internal resistance. A successful breakout here would likely attract further buying interest and fuel a bullish trend continuation.
💎However, the immediate spotlight is on the internal resistance level at $9.101. A decisive move above this mark would act as a powerful bullish confirmation, potentially propelling #COSMOS towards higher resistance zones. This move could significantly elevate the price, reinforcing a bullish narrative for the days to come.
💎But caution remains essential. If the upward momentum weakens and the price fails to hold its ground above the current support, we may witness a retracement toward a stronger support zone between $3.340 and $2.858. A failure to maintain momentum at these lower levels would invalidate the bullish scenario, leading to a potentially sharp decline.
💎At this critical juncture, the market will decide its direction. Holding firm above $4.035 and breaking out of the wedge are vital for confirming a continued bullish trend. Keep a close eye on these levels and remain agile with your strategy as the market dynamics evolve.
Stay focused, patient, and disciplined, Paradisers🥂
MyCryptoParadise
iFeel the success🌴
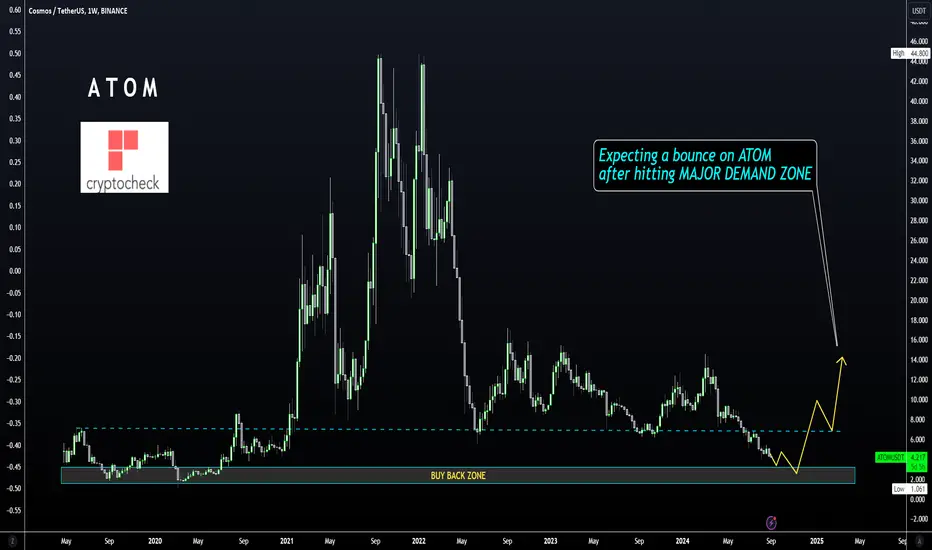
ATOM - Ideal BUY BACK Zone ApproachingThe greatest thing about bullish impulses / parabolic upwards price action, is when you know you can ride the tide because you ALREADY have a position.
However, this means having the courage to buy when the prices are low and there is no immediate sign of a turnaround to the upside. I'll say again; profits are made in bullish markets but secured during bearish markets.
This will, of course, largely depend on the direction of BTC over the next few weeks. So don't miss that important update HERE:
___________________________________
BINANCE:ATOMUSDT
ATOMUSDTATOM ~ 1W ✅
#ATOM If you have Conviction on this Coin, Maybe this support Block will be a very good purchase to start accumulating again. at least for 20%+ profits
BRIEFING Week #35 : The Battle Extends FurtherHere's your weekly update ! Brought to you each weekend with years of track-record history..
Don't forget to hit the like/follow button if you feel like this post deserves it ;)
That's the best way to support me and help pushing this content to other users.
Kindly,
Phil
