ATOM/USDT Weekly Analysis – Major Reversal Incoming?🔍 Technical Structure & Price Action:
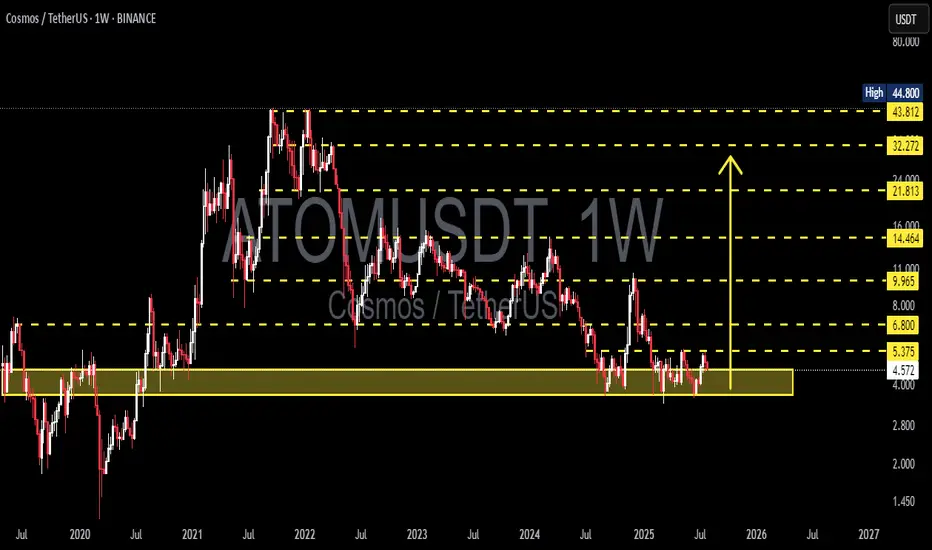
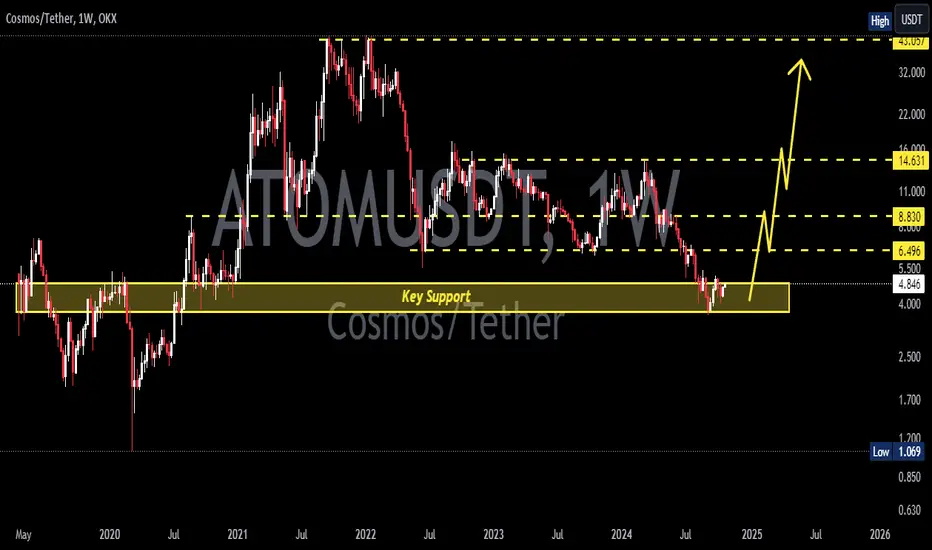
ATOM has been in a prolonged downtrend since peaking at $44.80 in 2022, forming consistent lower highs and lower lows. However, the price has recently returned to a major long-term demand zone between $4.00 – $5.37, which has historically acted as a strong support since 2020.
The price is showing a bullish reaction from this level, indicating a potential trend reversal or relief rally.
---
🧱 Key Levels & Technical Zones:
Level Role
$4.00 - $5.37 Major Historical Demand Zone (Strong Support) 🟨
$6.80 Minor Resistance & Double Bottom Neckline
$9.96 Mid-Term Key Resistance
$14.46 Next Bullish Target If Breakout Holds
$21.81 Major Resistance Ahead
$32.27 - $43.81 Long-Term Distribution Zone / ATH Range
$44.80 All-Time High (ATH)
---
📐 Patterns and Price Behavior:
🟡 1. Potential Double Bottom (Reversal Pattern)
The price appears to be forming a double bottom structure with a neckline around $6.80. A successful breakout above this level could signal a confirmed trend reversal.
🟡 2. Sideways Accumulation
ATOM has been ranging sideways within a tight zone, suggesting institutional accumulation before a possible impulse breakout.
🟡 3. Volume Compression
Declining volume near support often precedes a strong breakout move, either up or down.
---
✅ Bullish Scenario:
Price continues to hold above the $4.00 – $5.37 demand zone.
If weekly candle closes above $6.80, bullish confirmation is triggered.
Potential targets:
Short-Term: $9.96
Mid-Term: $14.46 – $21.81
Long-Term: $32.27 – $43.81 (if momentum sustains)
📈 Confirmation Signs:
Break and weekly close above $6.80
Increasing breakout volume
RSI divergence from oversold territory
---
⚠️ Bearish Scenario:
If price breaks down below $4.00, bears could regain control.
Possible downside targets:
Next Support: $2.80
Breakdown invalidates the double bottom structure
Continuation of macro downtrend likely
📉 Confirmation Signs:
Strong weekly close below $4.00
Spike in selling volume
Failure to break $6.80 resistance
---
🎯 Conclusion & Strategy:
ATOM is sitting at a make-or-break level, where a strong historical support zone meets growing bullish momentum. If bulls manage to break above $6.80, it could trigger a multi-week rally toward mid-term targets. This setup presents a high reward-to-risk opportunity if managed correctly.
---
⚙️ Trading Strategy Suggestion:
Aggressive Entry: Within $5.00 - $5.37 zone, stop loss below $4.00
Conservative Entry: After confirmed breakout above $6.80
Take-Profit Zones: $9.96 → $14.46 → $21.81
Risk Management is a MUST 🚨
#ATOMUSDT #Cosmos #CryptoAnalysis #DoubleBottom #AltcoinOutlook #TechnicalAnalysis #SupportResistance #PriceAction #CryptoTrading #BreakoutWatch #TrendReversal
Atomusdsignals
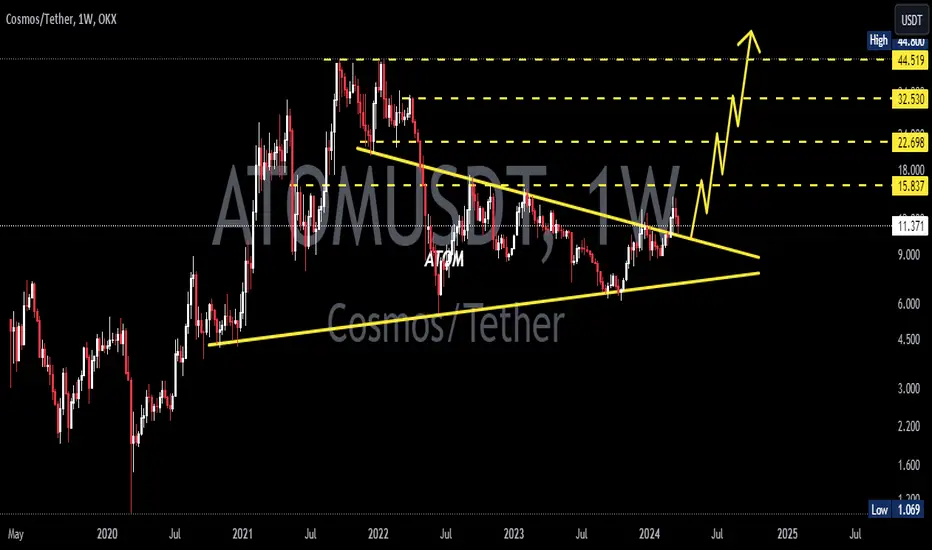
ATOM/USDT – Long-Term Accumulation Phase Nearing Breakout?📊 Full Technical Breakdown:
🟡 Long-Term Accumulation Zone
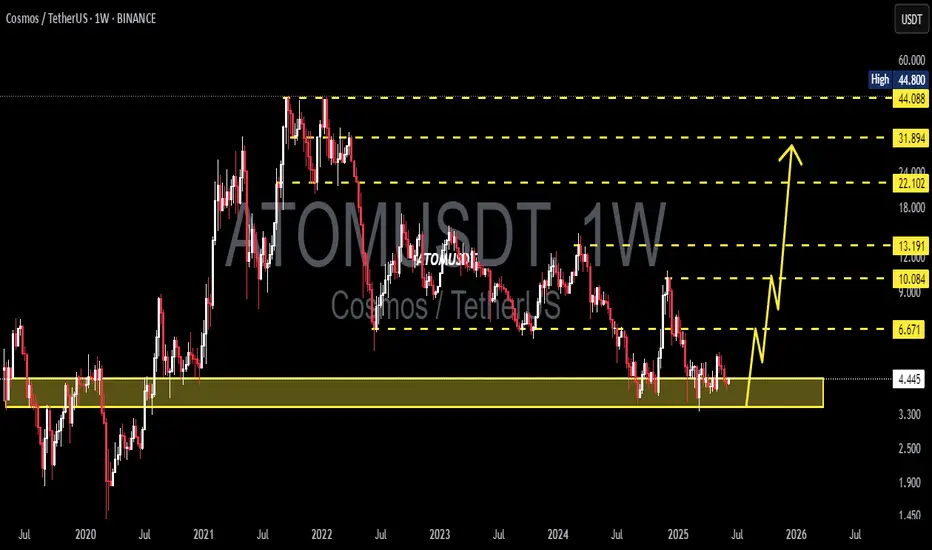
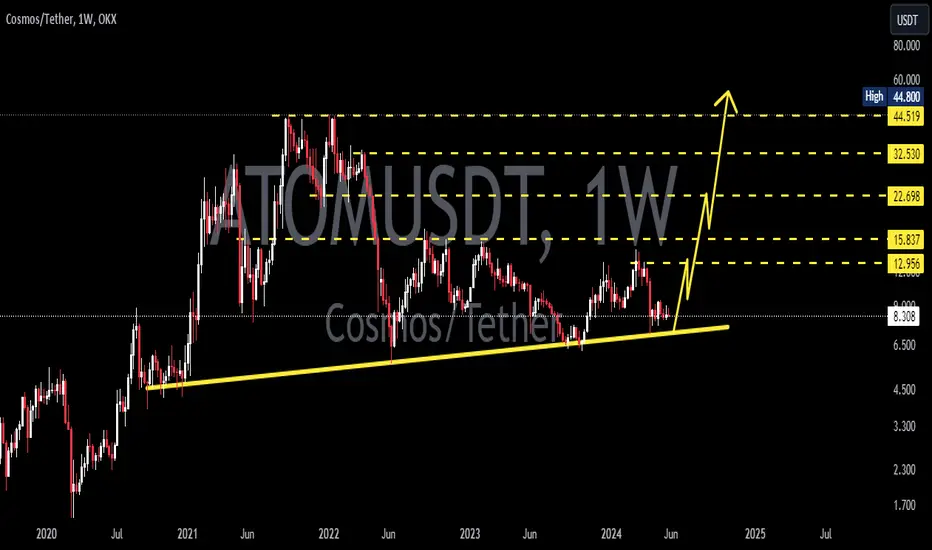
ATOM is currently trading within a horizontal accumulation zone between $4.50 and $5.20, which has held strong since early 2021. This key area has acted as a solid floor across multiple market cycles, suggesting strong buying interest from long-term holders or institutional participants.
🔻 Descending Trendline Resistance
Since reaching its all-time high (~$44.8) in late 2021, ATOM has been in a sustained downtrend, forming a descending trendline acting as dynamic resistance. The price is now retesting this line for the first time in months, hinting at a potential trend reversal setup if broken.
🧱 Potential Descending Triangle Breakout
The current structure closely resembles a Descending Triangle, with a flat base of support and a descending resistance line. While typically a bearish continuation pattern, in this context — combined with prolonged oversold conditions — it may serve as a bear trap and precede a major breakout.
✅ Bullish Scenario (Confirmed Breakout & Trend Reversal):
If ATOM breaks and closes weekly above $6.80, the breakout could trigger a powerful move, marking the start of a new macro bullish phase.
📈 Upside targets based on historical resistance levels:
📍 $9.96 → former short-term resistance
📍 $14.46 → previous support-turned-resistance
📍 $21.81 → major structural breakdown point
📍 $32.27 → upper resistance zone
🎯 $43.81 – $44.80 → All-Time High (ATH) zone
🟢 Potential upside: Over 700% from current levels if breakout is validated with strong momentum and volume.
❌ Bearish Scenario (Rejection & Breakdown):
If price gets rejected at the trendline and breaks below the $4.50 accumulation floor:
📉 Downside targets to watch:
🔻 $3.00 → previous minor support
🔻 $2.20 → pandemic-era support zone
🔻 $1.06 → historical bottom (2020)
This would confirm a continuation of the macro downtrend and indicate that further accumulation is needed before any major reversal.
📌 Key Technical Confirmation Signals:
Weekly Volume: A true breakout must be supported by a volume spike well above the weekly average.
RSI (Relative Strength Index): A move above 50 on the weekly RSI would support a bullish thesis.
Bullish Divergence (on lower timeframes): Would strengthen the breakout probability.
🔮 Strategic Takeaway:
ATOM is at a make-or-break level. With a long period of sideways consolidation and tightening price action, a high-volatility move is imminent.
> For long-term investors, this zone offers a high reward-to-risk opportunity. For traders, it's time to prepare for a confirmed breakout or rejection trade setup.
#ATOMUSDT #CosmosAnalysis #CryptoBreakout #TechnicalAnalysis #DescendingTriangle #BullishSetup #AltcoinSeason #CryptoMomentum #AccumulationZone #TrendReversal #CryptoSignals

ATOMUSDT 1W Analysis ATOM ~ 1W Analysis
#ATOM Buy back gradually from here if you still have confidence in this coin with a short term target of at least 20%+ from here.
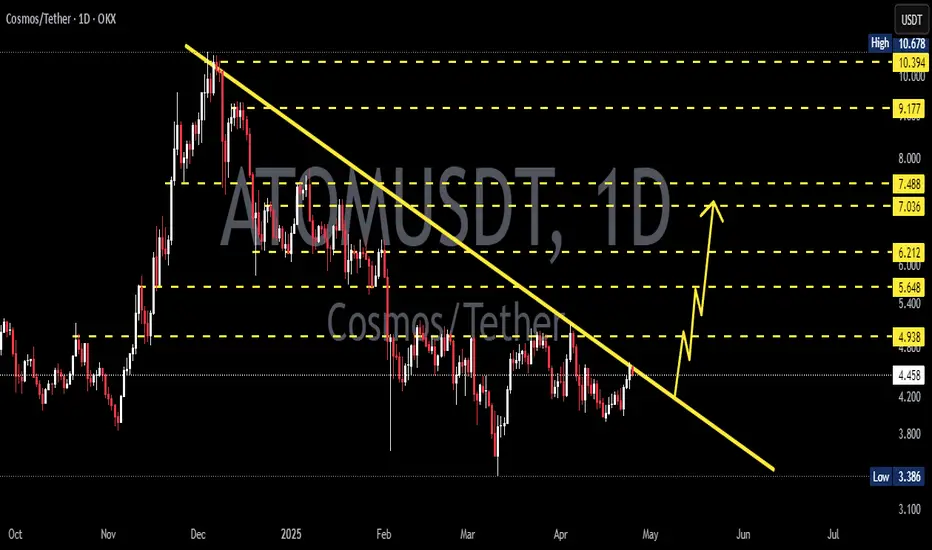
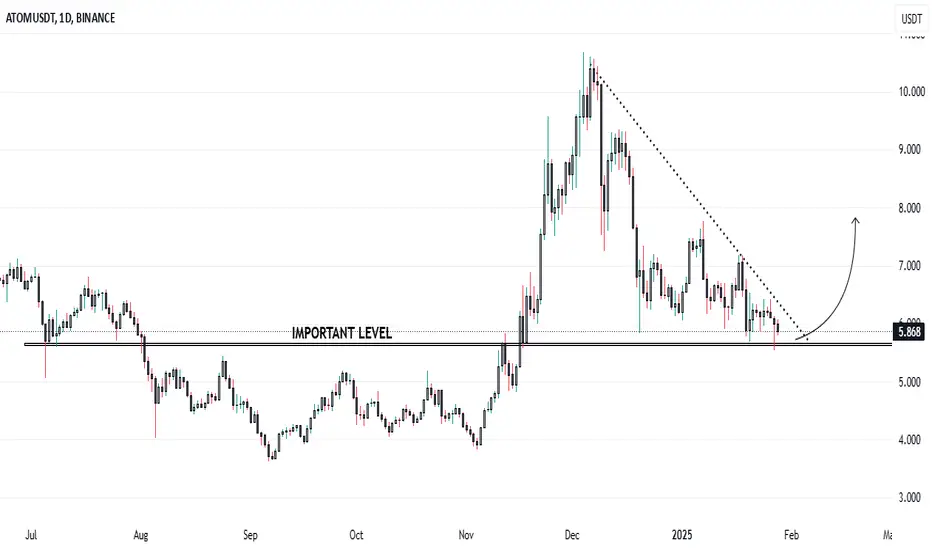
ATOMUSDT 1D AnalysisATOM ~ 1D Analysis
#ATOM Buy after successfully penetrating this resistant line with a short -term target of at least 10%+ from here.
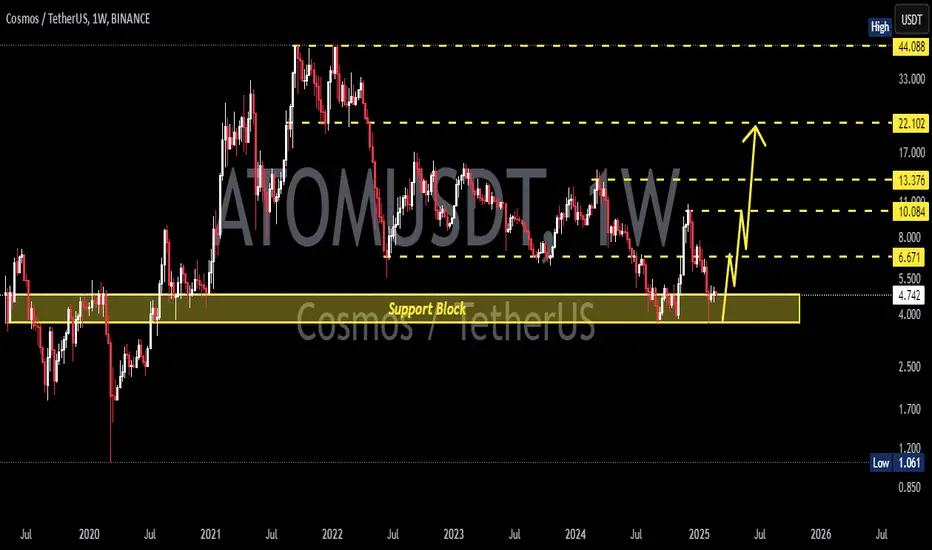
ATOMUSDT 1WATOM ~ 1W Analysis
#ATOM Buy gradually from here if you still have a Conviction on this Coin. This is a very good support block for now.
ATOM Back at Crucial Level: What Should You Do...?ATOM is currently at a significant level of 5.650, which has served as both support and resistance multiple times throughout the year. It acted as support in July 2024, as resistance at NOV 2024, and is now functioning as support again. Presently, ATOM is in a downtrend since reaching a high of 10.600. Given that it is at this support level, you might consider buying if you are interested, or you could wait for further confirmation before making a decision.
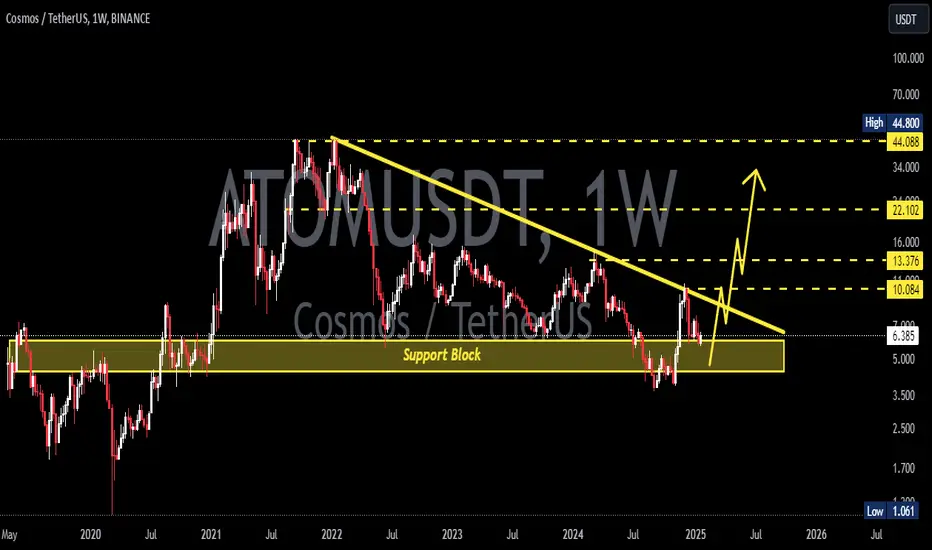
ATOMUSDT 1WATOM ~ 1W
#ATOM If you still have Conviction on this coin,. Don't miss this trade,. Buy with a minimum target of 20%++
ATOM Is Escaping From The Dead Zone: Wyckoff Accumulation Done!Hello, Skyrexians!
Let's update the previous Cosmos analysis today. It was one the weakest coin in 2024 and it looks like finally reached the bottom, completed accumulation and is about to explode. In our opinion BINANCE:ATOMUSDT is one of the most undervalued crypto asset for 2025.
Let's take a look at the weekly time frame. We can see the clear Wyckoff accumulation, no single event and phase has not been violated. The most painful time, the spring has been already passed. Price showed the impulse to the upside after that. You can see that Fractal Trend Detector turned green and started print the green support zone. Last time we have seen it there was a fake growth, but this time there is a high probability of true bull run on this asset!
Best regards,
Skyrexio Team
___________________________________________________________
Please, boost this article and subscribe our page if you like analysis!

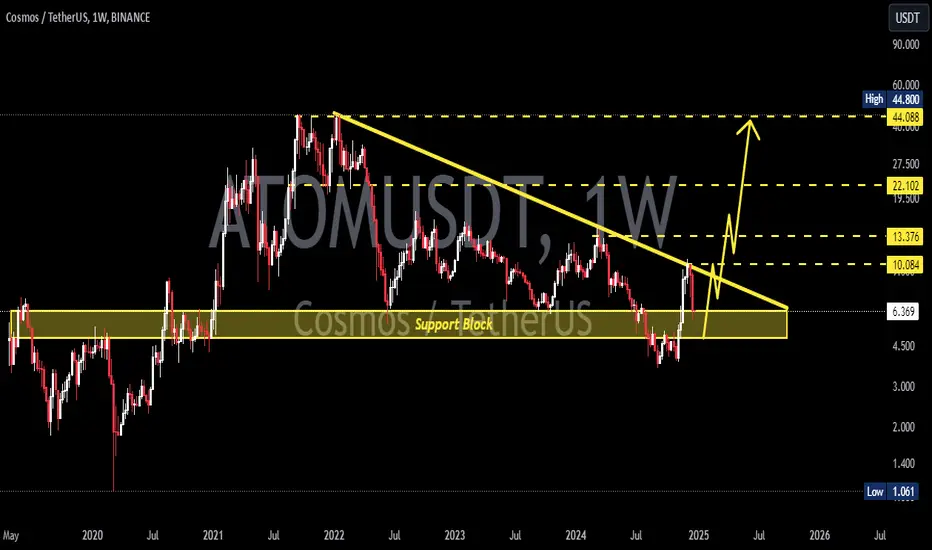
ATOMUSDT 1WATOM ~ 1W
#ATOM This is an important support block for now. if you have Conviction on the coin,. Buying in stages here isn't too bad.
atomusdt update"🌟 Welcome to Golden Candle! 🌟
We're a team of 📈 passionate traders 📉 who love sharing our 🔍 technical analysis insights 🔎 with the TradingView community. 🌎
Our goal is to provide 💡 valuable perspectives 💡 on market trends and patterns, but 🚫 please note that our analyses are not intended as buy or sell recommendations. 🚫
Instead, they reflect our own 💭 personal attitudes and thoughts. 💭
Follow along and 📚 learn 📚 from our analyses! 📊💡"
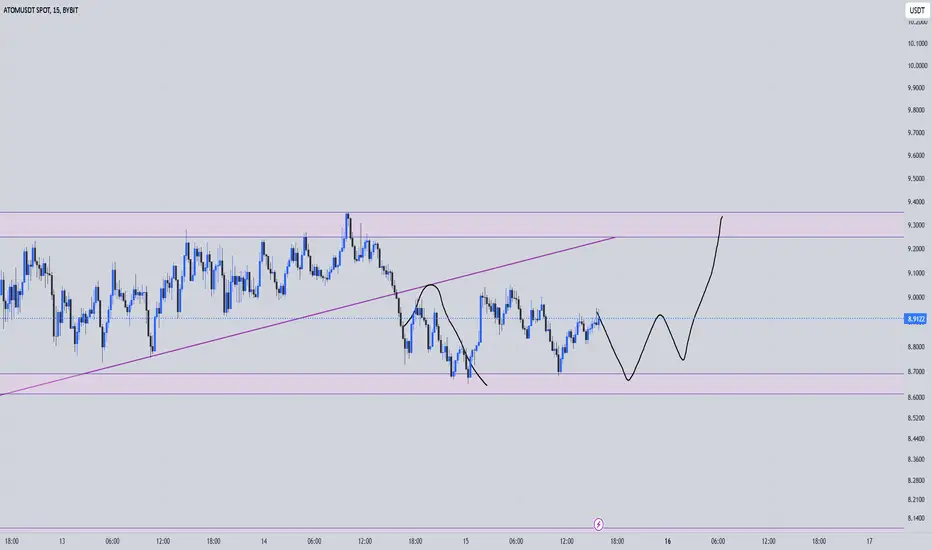
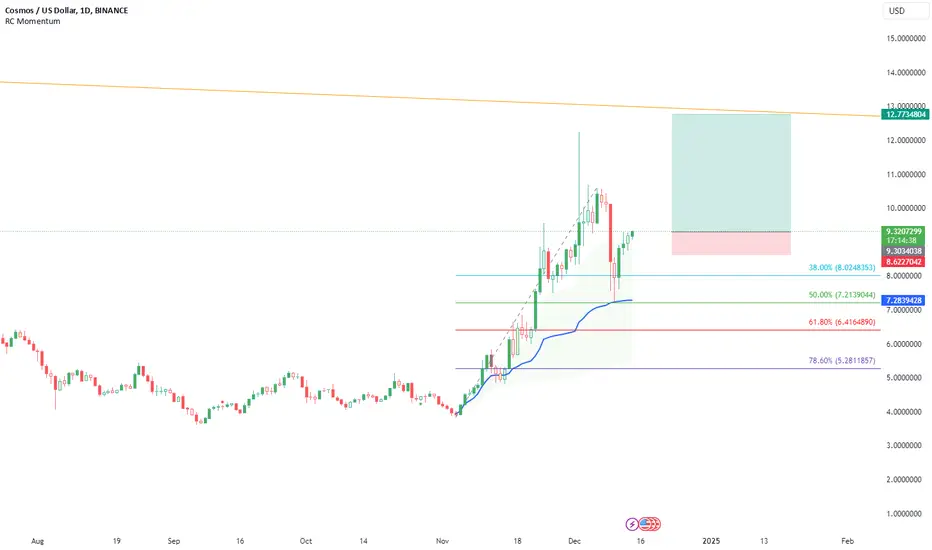
ATOM: Bullish Momentum | go longBINANCE:ATOMUSD | Buy Entry executed on daily chart. Daily Anchored VWAP support found at $7.28 and also it is 50% Fib retracement area as well.
Note: Green Yellow Candle. It is a Buy Signal triggered on daily candle close. Following candle is confirmation candle. As it broke the high of Green Yellow Candle entered long with stop loss. Focus on risk management. Don't let your winning position into loss.
Atom usdt"🌟 Welcome to Golden Candle! 🌟
We're a team of 📈 passionate traders 📉 who love sharing our 🔍 technical analysis insights 🔎 with the TradingView community. 🌎
Our goal is to provide 💡 valuable perspectives 💡 on market trends and patterns, but 🚫 please note that our analyses are not intended as buy or sell recommendations. 🚫
Instead, they reflect our own 💭 personal attitudes and thoughts. 💭
Follow along and 📚 learn 📚 from our analyses! 📊💡"
ATOM - DAILY - 1ST TARGET REACHEDATOM - DAILY - 1ST TARGET REACHED
We could see a price reversal if this resistance is strong enough.
A close today below this resistance leaves room for a price decline.
But , it remain bullish.
ATOMUSDTATOM ~ 1W
#ATOM If you have Conviction on this Coin, Maybe this support Block will be a very good purchase to start accumulating again. at least for 20%+ profits
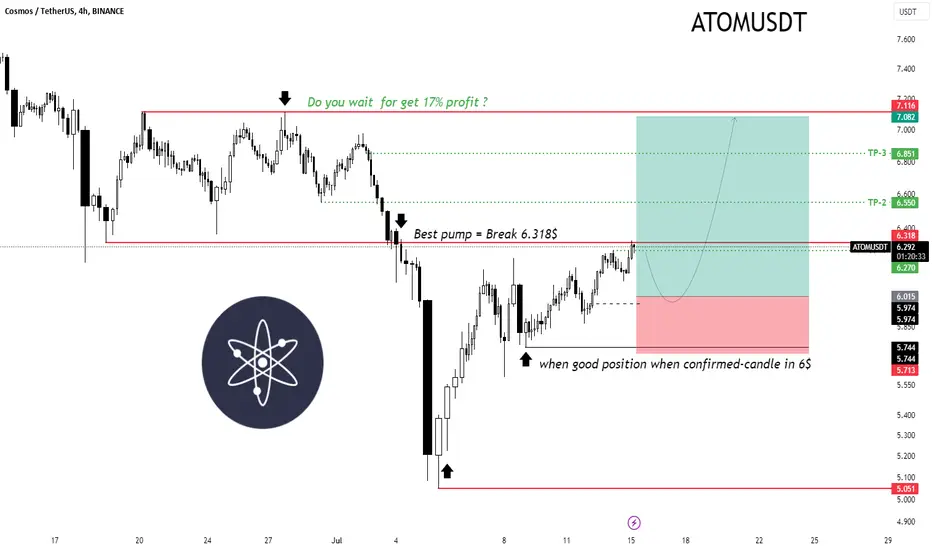
Wait for best positionATOMUSDT Analysis 📊
Key Levels:
Resistance Level: $7.116 🔴
Support Level: $5.051 🟢
Entry Level: Around $6.270 to $6.318 🚀
Take Profit Points (TP):
TP-1: $6.550 🥇
TP-2: $6.851 🥈
TP-3: $7.082 🥉
Trend Analysis:
Bullish Movement (Pump):
The chart indicates the best entry point after breaking the resistance at $6.318 🚀.
In this case, there is a strong probability of a bullish move that could push the price to the specified targets 📈.
Entry and Exit Points:
Entry: When the confirmed candle is around $6. 📥
Exit: At target levels $6.550, $6.851, and $7.082 depending on risk tolerance and profit goals 📤.
Risk Management:
Stop Loss: Around $5.744 to $5.713 ❌.
Profit Target: Up to 17% 📈.
Recommendations:
Profit Expectation: If you aim for a 17% profit, wait for the price to reach $7.116 🤑.
Entry Condition: It’s best to enter after confirming the resistance break and closing the candle above $6.318 ✅.
Position Management: Always consider your risk-to-reward ratio and stick to confirmed signals 🔍.
This analysis is based on the provided information and chart. Always conduct your analysis and review your strategies 📚. Also, never forget risk management 🛡️.
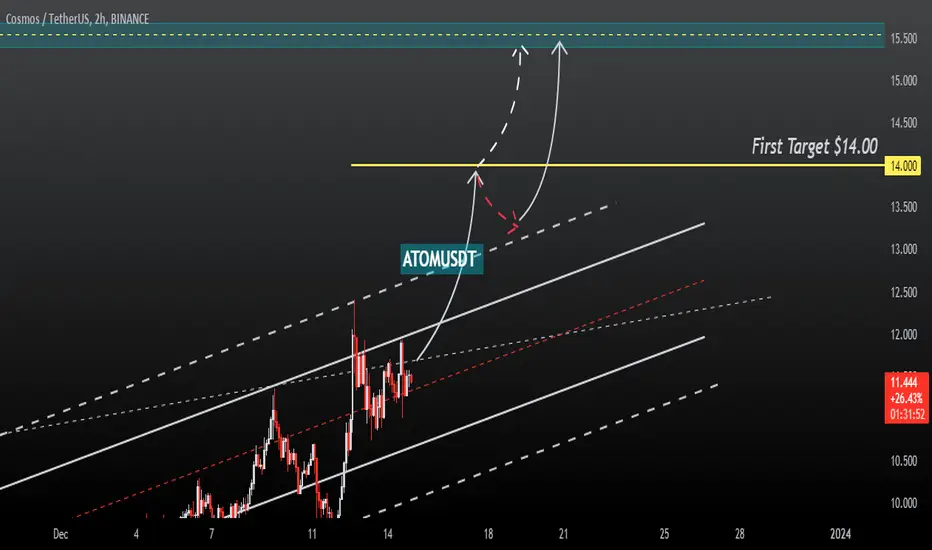
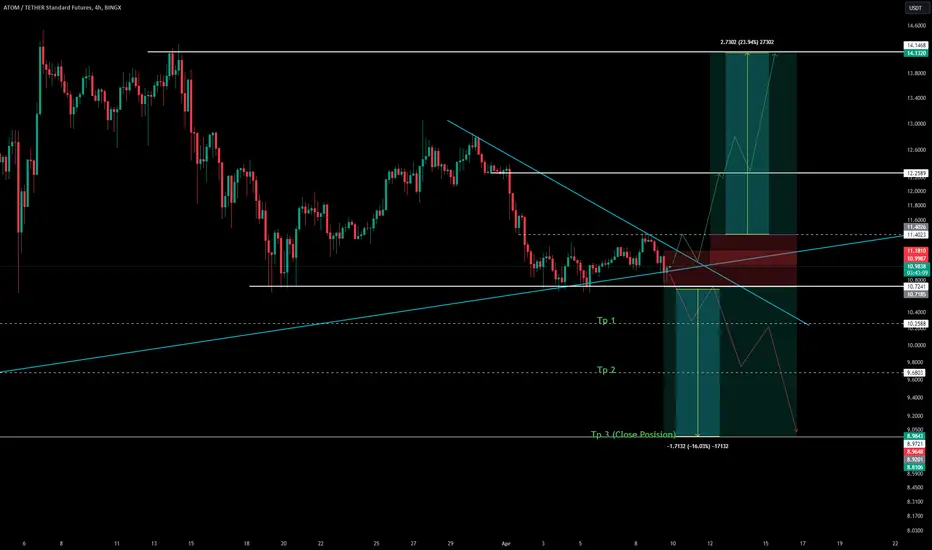
Atom 24 % Pump Or 16 % Dump... ?!The ATOM bullish trendline is about to break.
Short trade possibility:
Entry point: After breaking the bullish trendline and the $10.72 range
Profit targets:
$10.25
$9.68
$8.98
Long trade possibility:
Entry point: Above the $11.40 range
Profit targets:
$12.58
$14.14
Important notes:
This analysis is for informational purposes only and should not be considered as investment advice.
Do your own research and use a proper risk management strategy before any trade.
The cryptocurrency market can be highly volatile, so trade with caution and awareness of the risks.
ATOMUSD 1WATOM ~ 1W 📈
#ATOM The retest of this Support line has been successful. we will remain bulls as long as Atom price is above this Support line.
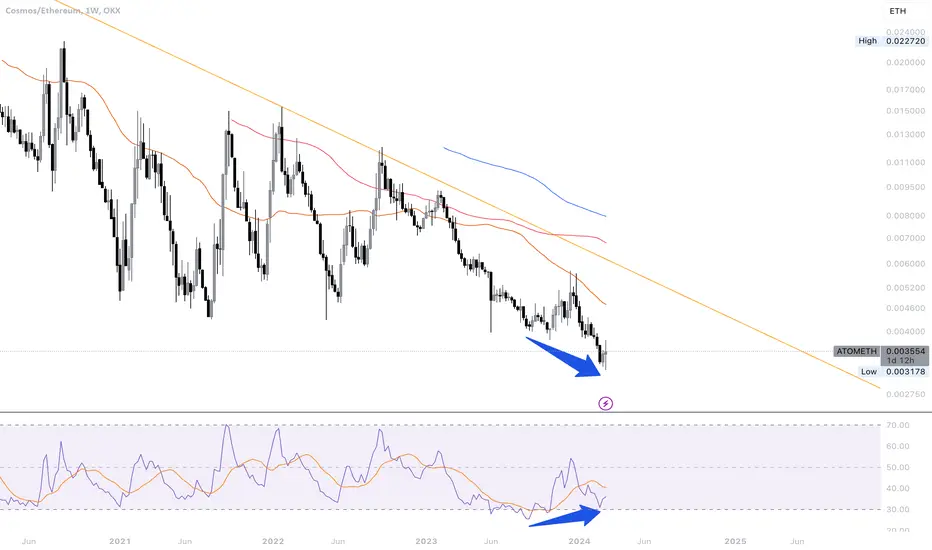
It's Finally time for ATOM! Bullish Div. WeeklyAtom has formed a weekly bullish divergence. Atom has been very weak during the past bear market and didn't show any strength in the most recent run.
But it's different and we can expect NASDAQ:ATOM to rise against ETH for at least %200.
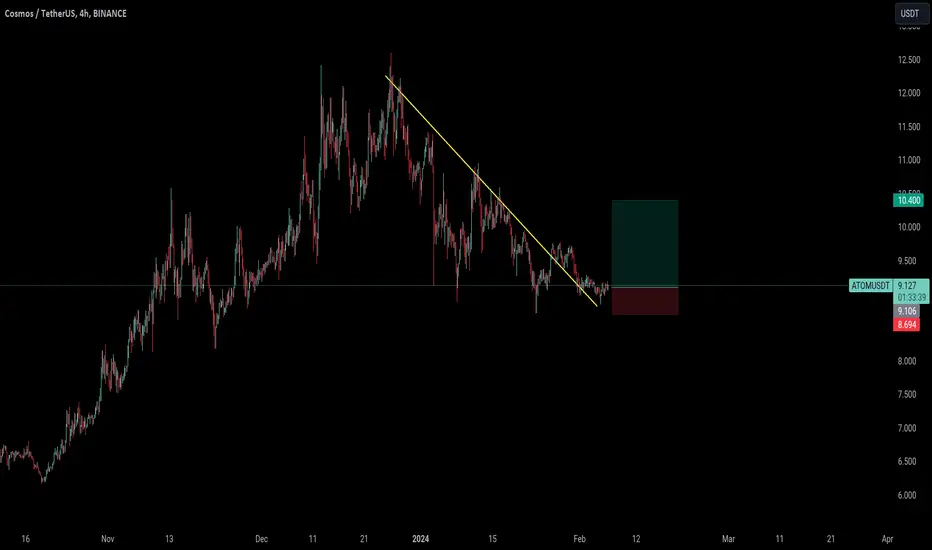
ATOM Long loadingI see a nice bullish setup on ATOM. Classic trendline with break and retest. Bullish divergence on 4Hr timeframe, ranging and accumulation on support, it's a typical bullish setup. My main target is 10.4, stoploss below recent bottom
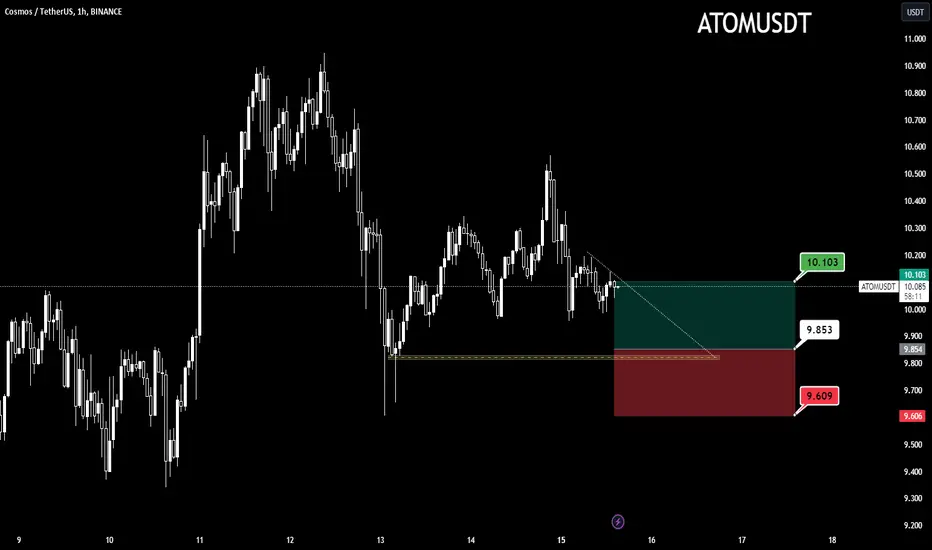
buy in best support (ATOM)📊Analysis by AhmadArz:
Buy for getting reward-1
🔍Entry: 9.85
🛑Stop Loss: 960
🎯Take Profit: 10.10
🔗"Uncover new opportunities in the world of cryptocurrencies with AhmadArz.
💡Join us on TradingView and expand your investment knowledge with our five years of experience in financial markets."
🚀Please boost and💬 comment to share your thoughts with us!
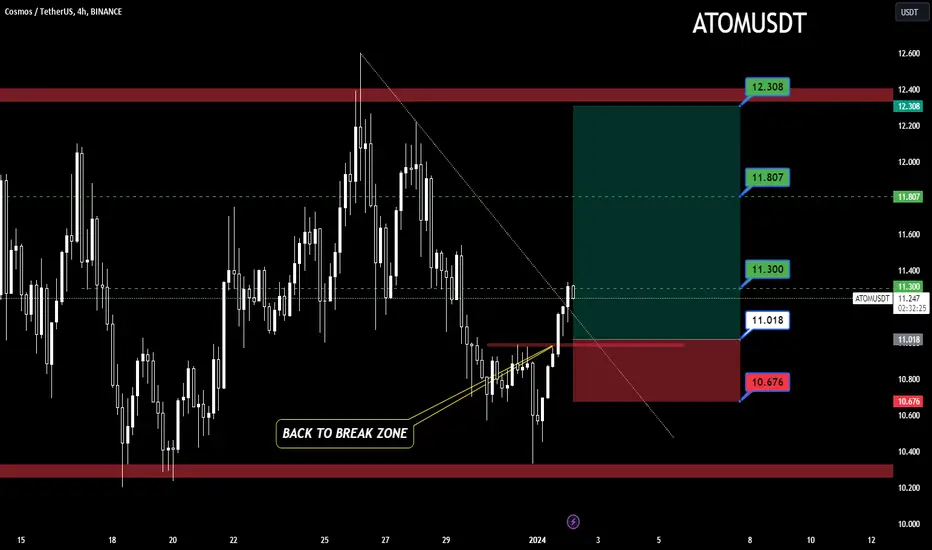
JUMP in new years (ATOM)📊Analysis by AhmadArz:
BACK TO BREAK ZONE.
🔍Entry:11.01
🛑Stop Loss:10.676
🎯Take Profit:11.30-11.80-12.30
🔗"Uncover new opportunities in the world of cryptocurrencies with AhmadArz.
💡Join us on TradingView and expand your investment knowledge with our five years of experience in financial markets."
🚀Please boost and💬 comment to share your thoughts with us!
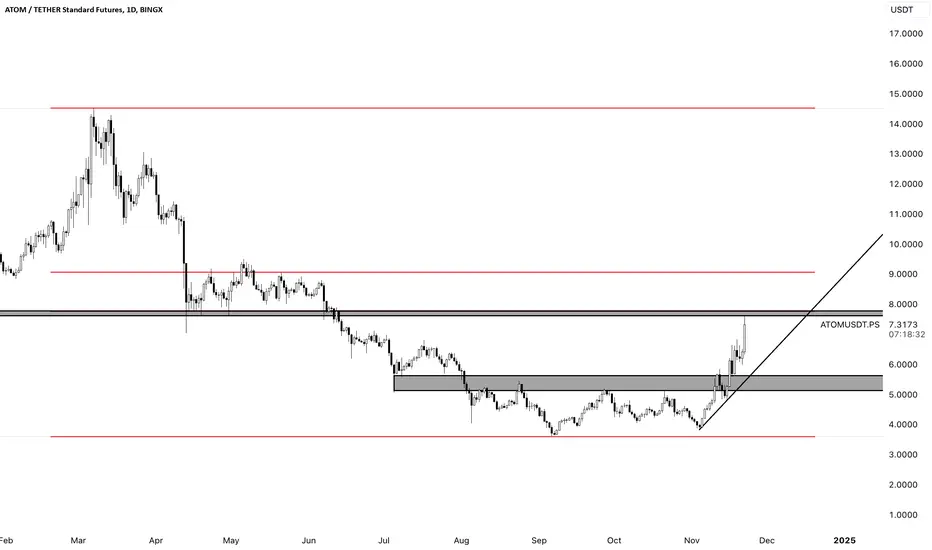
ATOMUSDT Idea - COSMOS vs TETHERHey Traders.. No Comment!!
BINANCE:ATOMUSDT BINANCE:ATOMUSD COINBASE:ATOMUSD
⚠️ Disclaimer: The viewpoints shared represent my individual outlook on the market, based on publicly accessible information and historical data. While a portion of these opinions is influenced by my actual trades, others are not. It's important to note that I am not a financial advisor, and I do not assume any responsibility for the decisions you make in your trading activities.
✅ Feel free to share your inquiries or suggestions in the comments. I am more than willing to assess and analyze any cryptocurrency, forex currency pair, or stock index that piques your interest, so, Please don't hesitate to ask or mention the specific currency chart you'd like me to review.