BUY AUDUSD "long term analysis"Ill wait for price to retrace down 0.74500 for a buy. it may be a short buy as price might go down further after it but you will make a bit..
AU

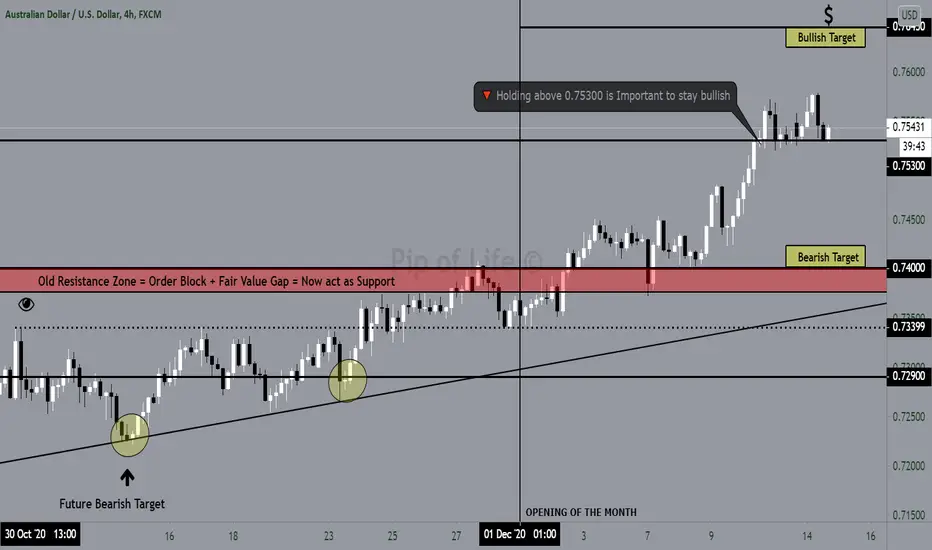
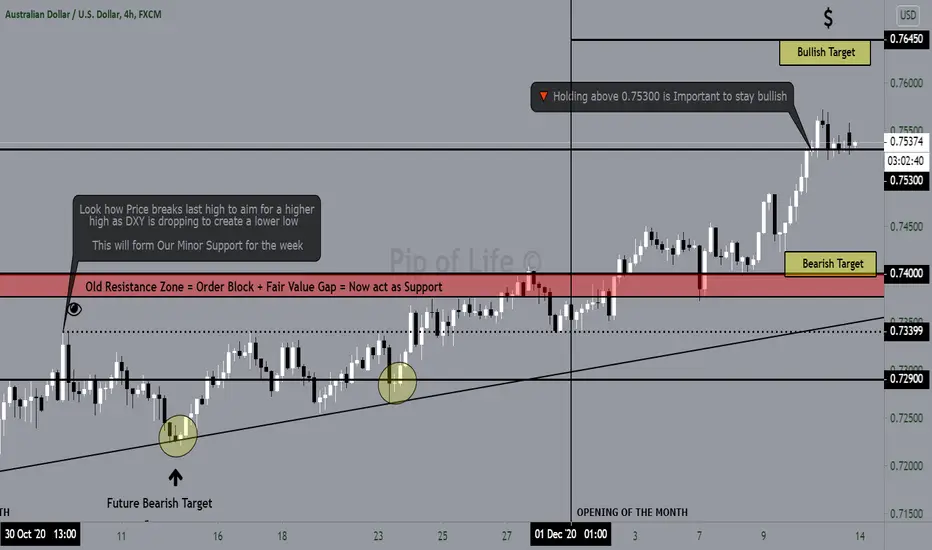
🔰 AUD/USD - Daily Update 🔰🔹 Below 0.7530 AUDUSD will see the 0.7400 support
🔹 Above 0.7530 — resistance is 0.7640
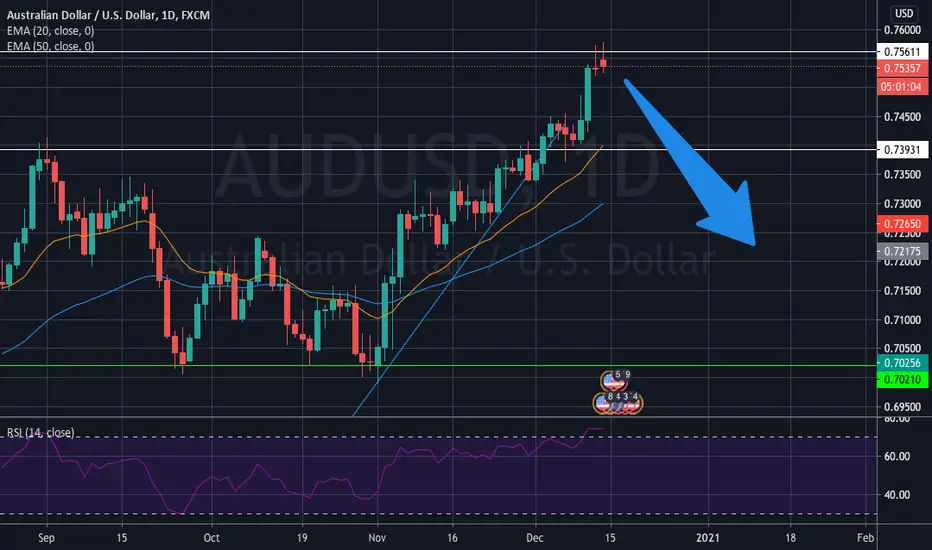
AU Shorts next upSeeing bearish timeframe confluence from the weekly down to the 4H. Bearing pinbar forming around the .75611 resistance zone.
🔰 AUD/USD - Daily Outlook 🔰🔹 Above 0.7530 AUDUSD can visit the 0.7640 zone
🔹 Below 0.7530 the next support is 0.7400

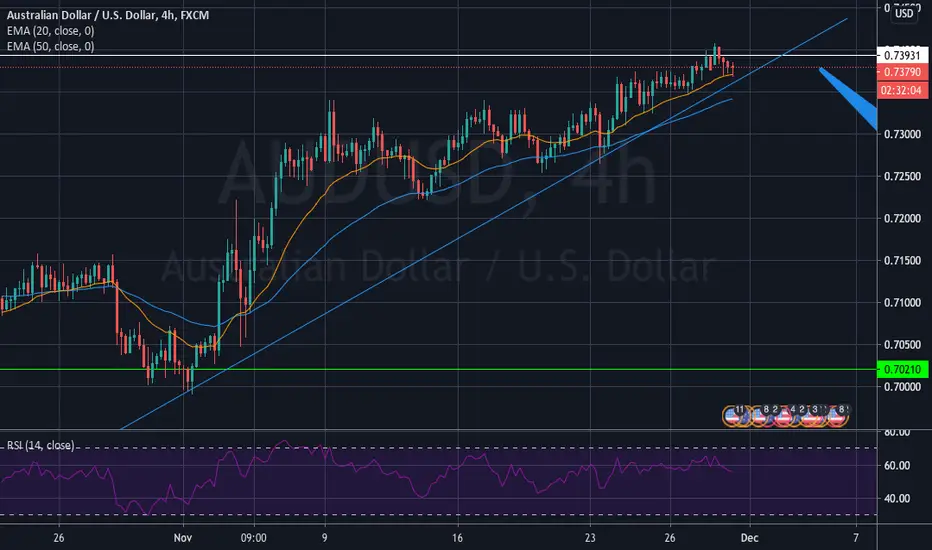
AUD USD Short UpcomingPrice currently aproaching the recent swing high at .74011. Waiting for confirmation with EMA cross and a trend line break
AU to double within next 3-5 months?Looks like a nice channel here.
Especially when this one seems really underestimated among others in the industry.
But mind fundamentals, news and gold price.
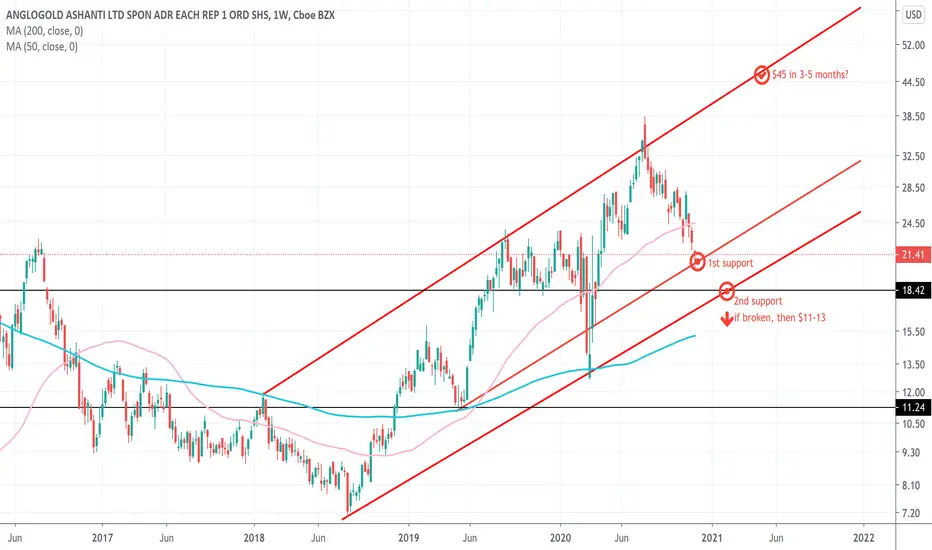
Nevermind the technicals. The fundamental's are enough.Lets see...
If it rises to the top of the channel. That would give it a whopping P.E. of 14
Not bad considering earnings growth of 25%+ over the next 5 years
Also nice dividends...
Most of the miners should be bought on any and all dips...

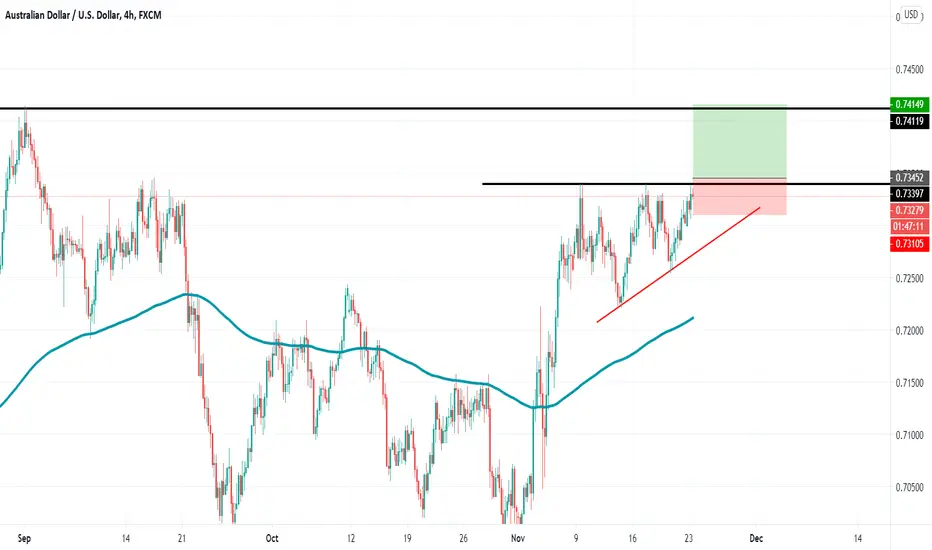
Long/Buy AUD/USDQuick and simple analysis. Wait for rejection of the support before going long. Multiple rejections will indicate a reversal and an uptrend.
If support breaks and then retested-close out position. Keep stop loss at 30 pips below support.
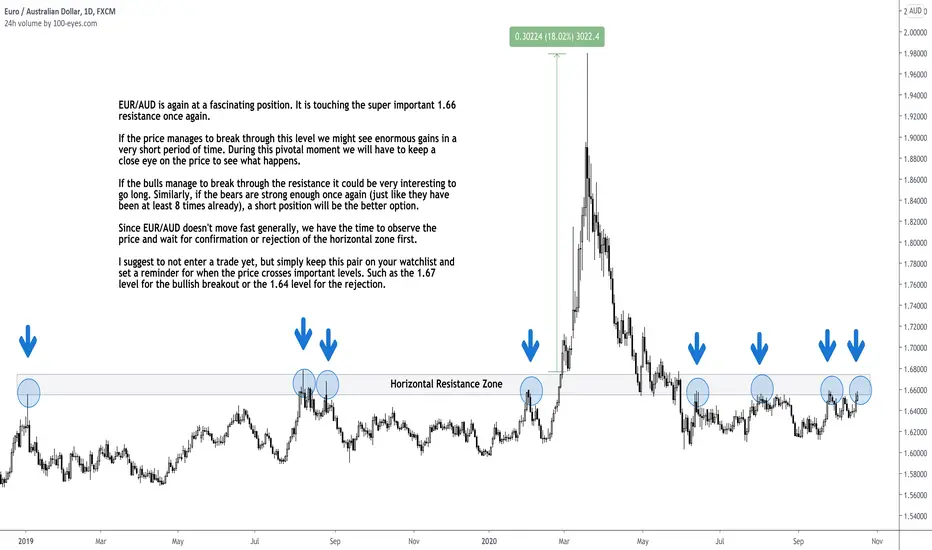
EUR/AUD Is At a PIVOTAL Moment! EUR/AUD is again at a fascinating position. It is touching the super important 1.66 resistance once again.
If the price manages to break through this level we might see enormous gains in a very short period of time. During this pivotal moment we will have to keep a close eye on the price to see what happens.
If the bulls manage to break through the resistance it could be very interesting to go long. Similarly, if the bears are strong enough once again (just like they have been at least 8 times already), a short position will be the better option.
Since EUR/AUD doesn't move fast generally, we have the time to observe the price and wait for confirmation or rejection of the horizontal zone first.
I suggest to not enter a trade yet, but simply keep this pair on your watchlist and set a reminder for when the price crosses important levels. Such as the 1.67 level for the bullish breakout or the 1.64 level for the rejection.
Follow me for consistent high quality updates, with clear explanations and charts.
Please like this post to support me.
- Trading Guru
--------------------------------------------------------------
Disclaimer!
This post does not provide financial advice. It is for educational purposes only!
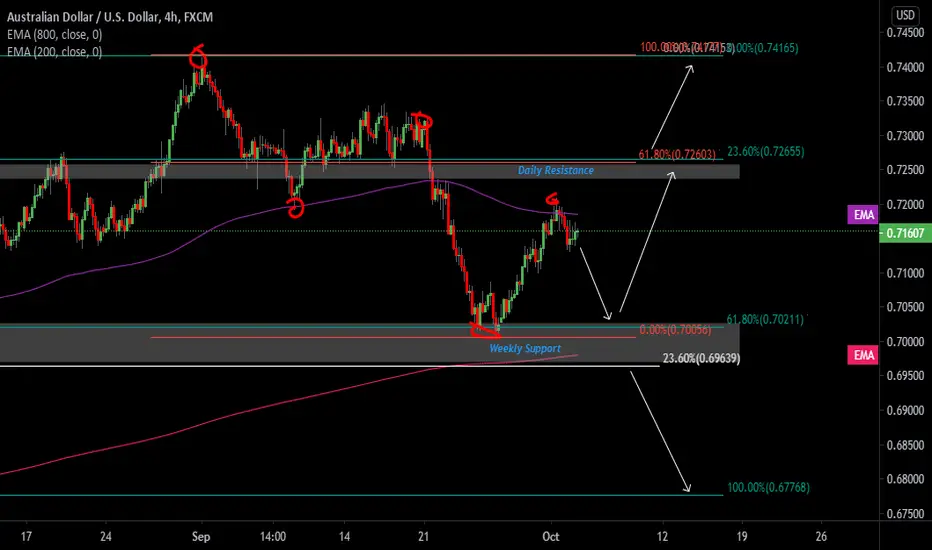
AUDUSD - WEEKLY OUTLOOKTECHNICAL POINTS:
Weekly Fib (white)
Daily Fib (blue)
4hr Fib (orange)
Weekly support
Daily resistance
4hr 200EMA
4hr 800EMA
Clear Downtrend on Daily
Clear Downtrend on 4hr
Buy Confirmation (1):
Break and close above Daily resistance, 4hr 61.8% fib, daily 23.6% fib
This would also break the lower high/lower low structure and negate the usual correction pullback to the 4hr 61.8% fib level.
Buy Confirmation (2):
Daily rejection of weekly support and fibs in that area creating a double bottom
Sell Confirmation:
Break of weekly support, fib levels and 4hr 800ema to target previous swing lows.
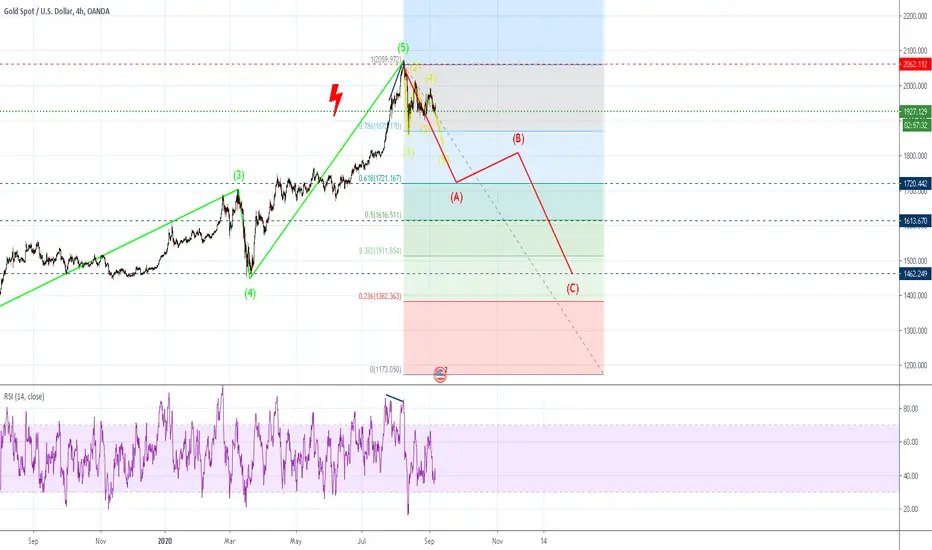
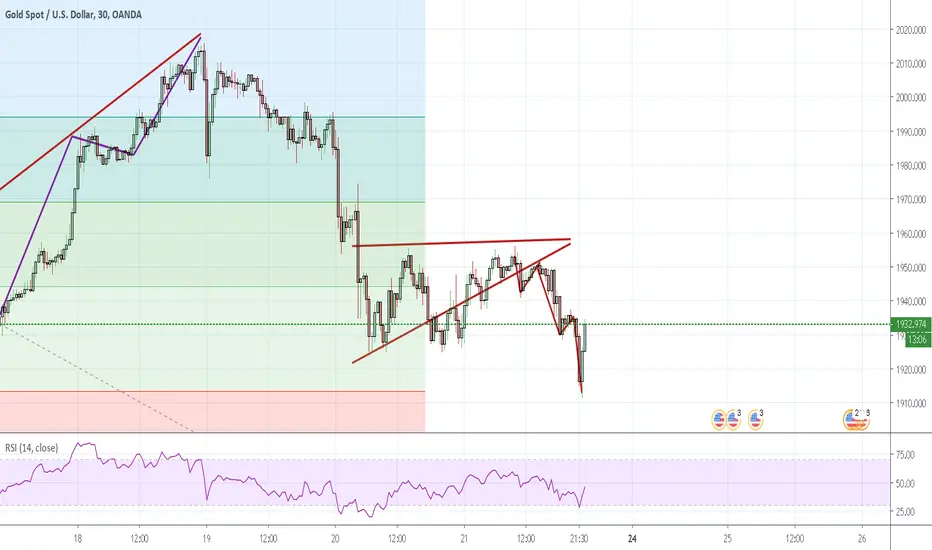
Gold Drop Soon! XAU/USDWe drew out Waves A,B no about to start C, which will bring us down I believe. This isn't investment advice.
Shorting Gold. Shorterm bearish XAUUSDDivergent RSI, 5 Wave impulse complete.
Goals are in blue (blue line)
Red line is invalidation.
This is my short term outlook while correction happens, on longer time scales gold looks very bullish. But I don't plan to keep my short in forever.
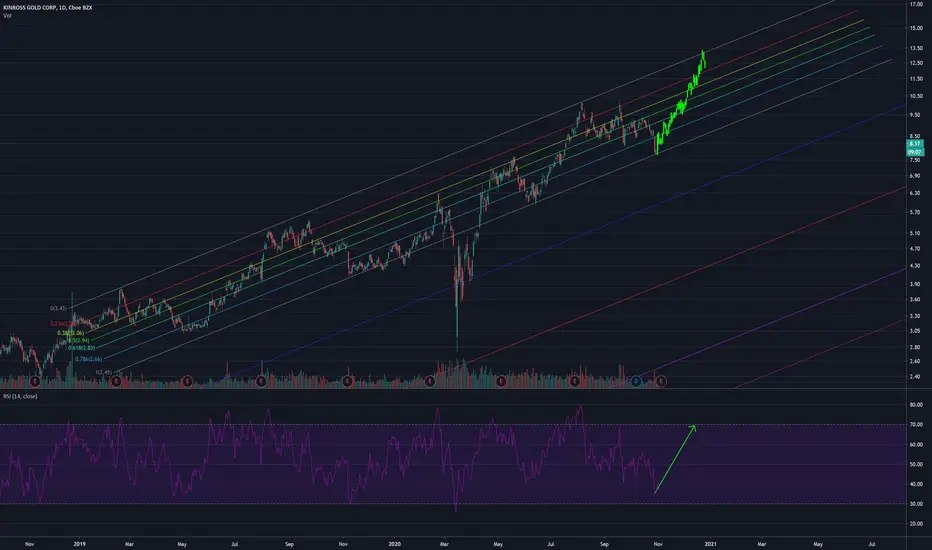
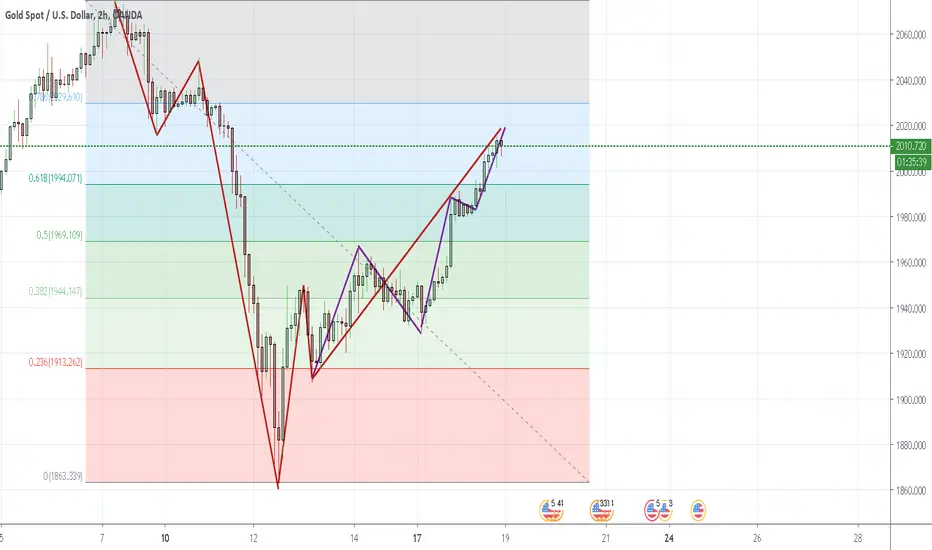
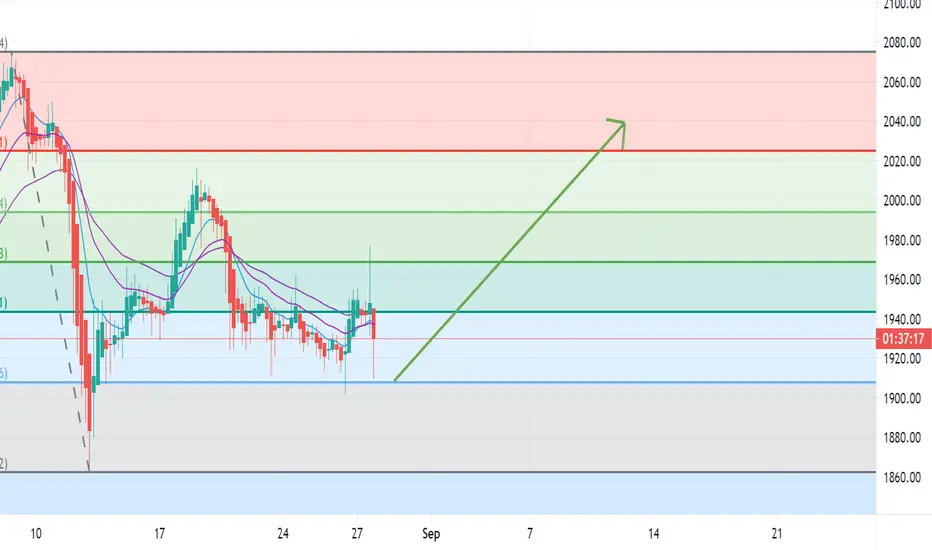
Gold Going UpCall it syncronicity but I believe Gold, too, got out of its corrective phase. RSI might suggest a short term pullback on smaller timeframes, however. Anyway, I bought some yesterday and think this has got more to give.
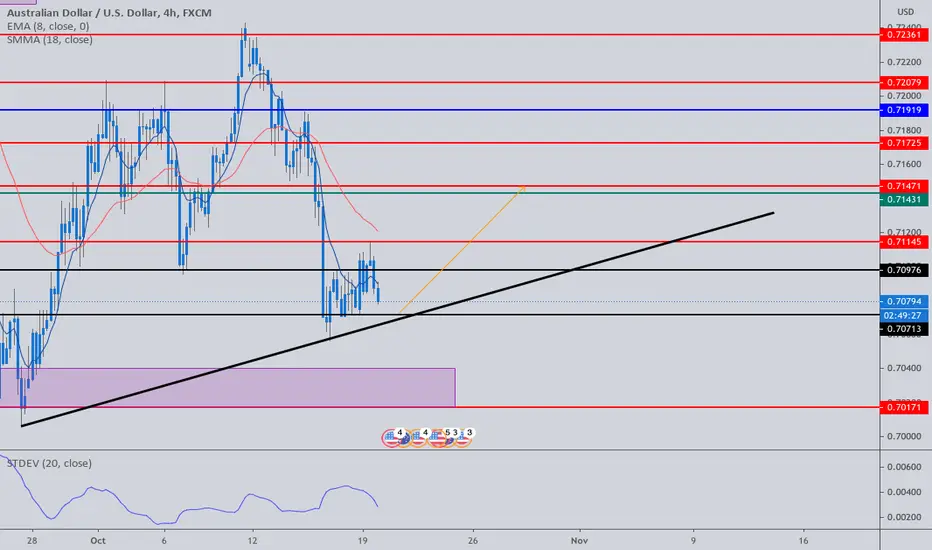
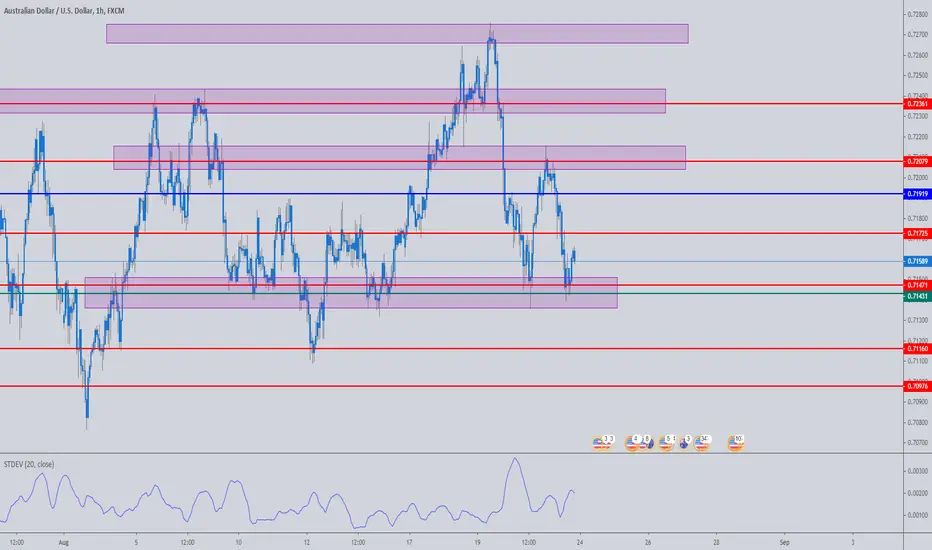
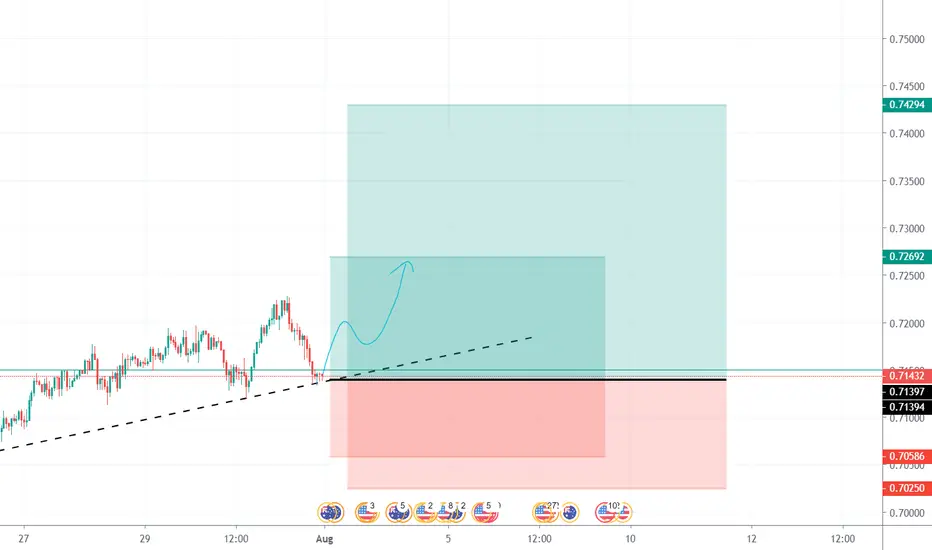
Long AUD/USDWait till price reaches demand zone. Let the price come to you and load on buy and scale to next supply zone.
Enter for the buy .71431
SL. below demand zone.
If anyone has any comments or criticisms-please share.
Thanks!
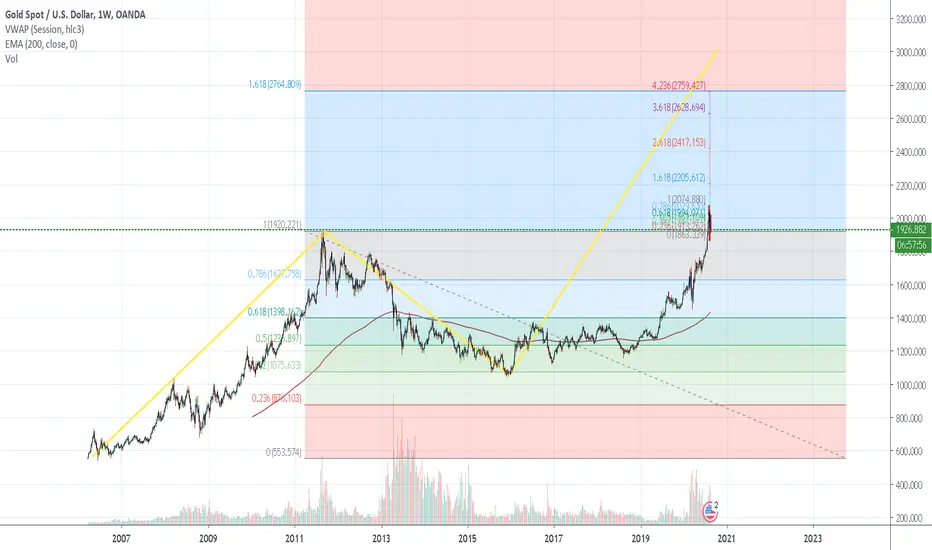
Longterm Bullish on Gold. XAU/USDWe started on the higher high in this latest impulse, and on the weekly it appears to be that we in Wave 3 of Impulse. I am just wondering now if we might at some stage next year or the year after see prices much, much higher than $2000 per ounce. The chart seems to support this.
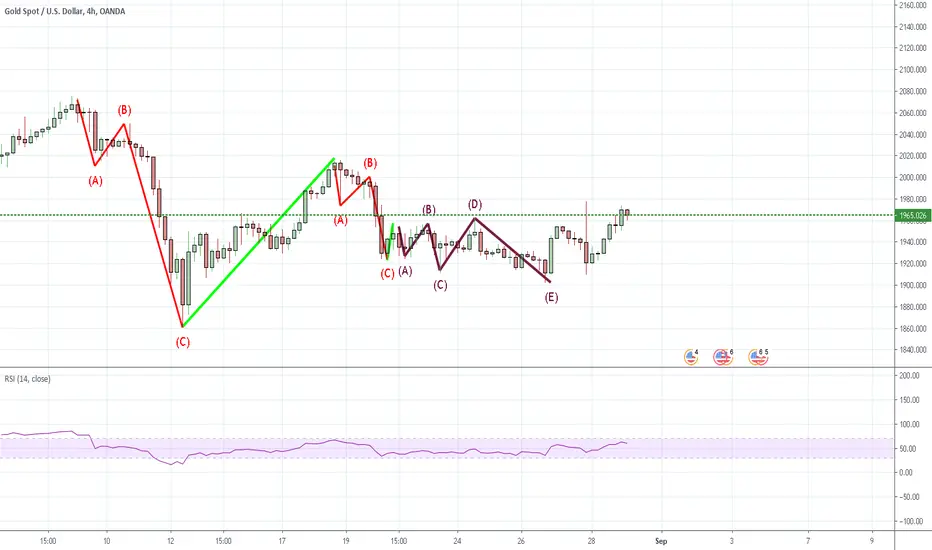
Gold Pivoted. Short term Bullish on Gold . XAUUSDWave C was much smaller than I thought. This is a start of a new impulse I believe.
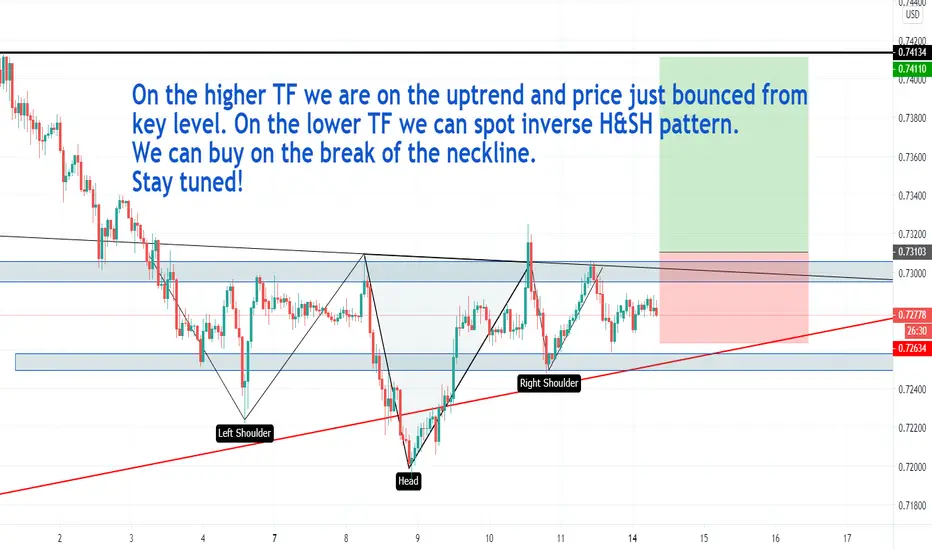
AU formed Head and ShoulderPlan sell for AU in H1
E: 0.6992
SL: 0.7020
TP: 0.6930
Reason: AU formed Head and Shoulder in H1 time frame
