AU

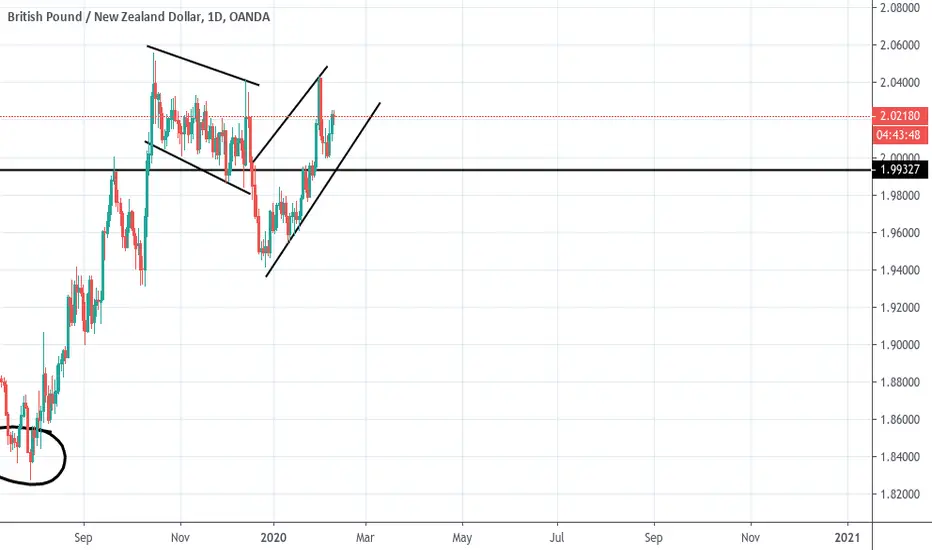
AU: Aussie Long Setup: Too Risky This Week?Aussie is at a monthly key level that I'm watching, THe market was very nonvolatile last week with thanksgiving in theUnited States. Keep in mine, for last week NZD/US moved a right back towards anyone spending all of their time trying to enter. By being dynamic traders we can not only adapt to but ahead of the market at all times.

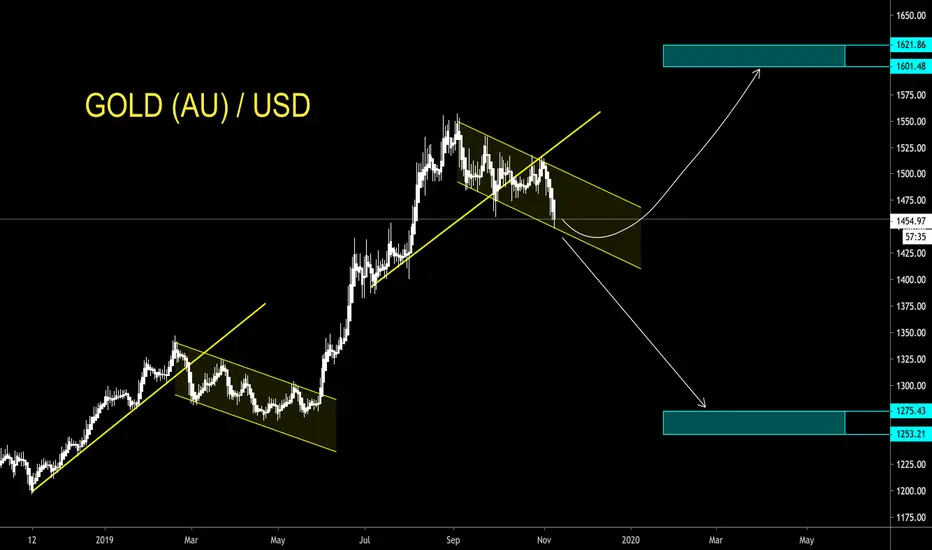
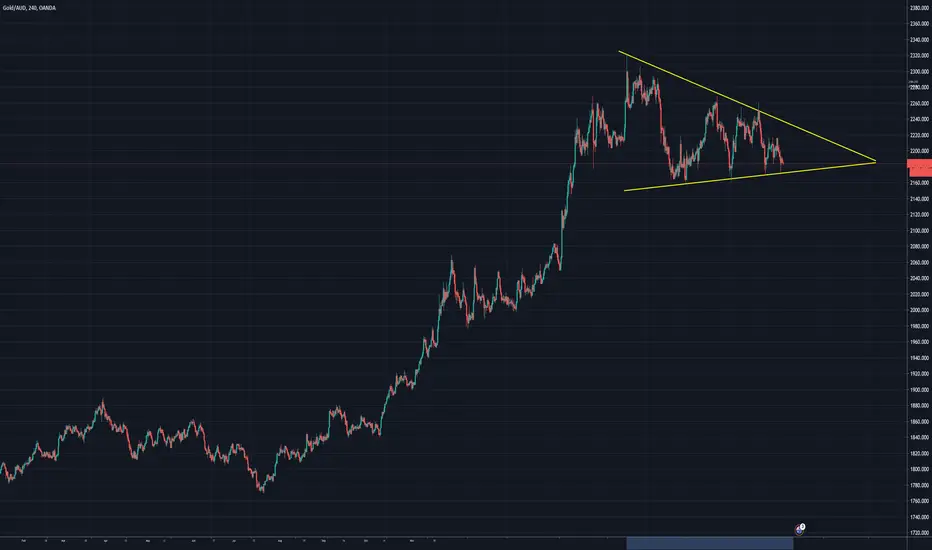
Imminent Gold-Price Surge
This massive 'monthly' triangle exit is 'perfect' by all measurements. It is unlikely that we're ever going to see current levels again, or for at least 6-10 years forward if the assessment is pure 'technical'.
Technical Forecast:
Gold prices are expected to bottom by December this year, which indeed could be the last bottom. The 'monthly' chart shows an incredible price surge potential around (the beginning of) Spring 2020 which could reach beyond 1700+. This is backed by at least 5 major indicators (additional 5 indicators are in the process of becoming super-bulls such as ADX, MACD, etc).
If LL is broken again, aim lower again until two distinctive 'higher highs' have been created on the 'daily'. This will serve as your entry-point confirmation. The technical low is around 1425. Balance your trade or exit your long-position in case prices go below the stop-loss marker (extremely unlikely).
(lines and connections have been averaged on step-line over linear for higher precision)

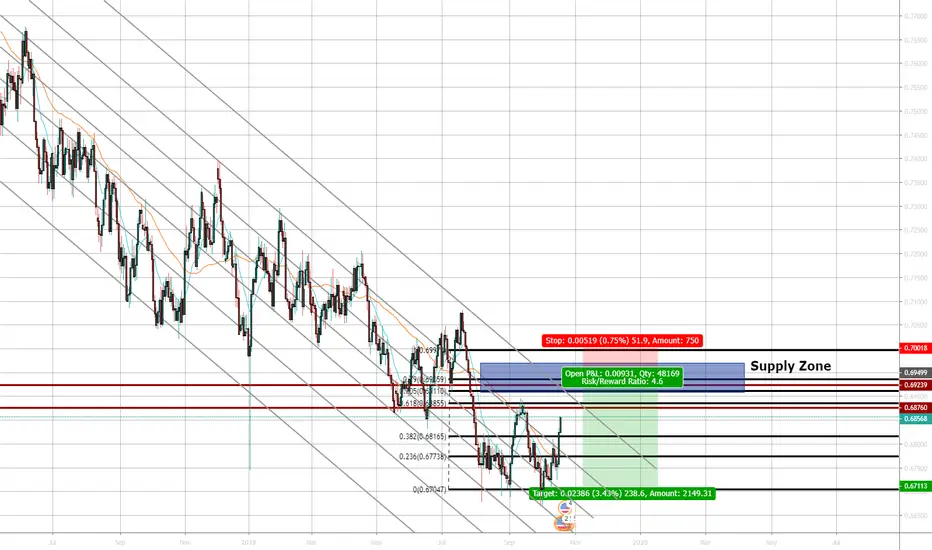
AU: Weekly long setup Entries for this trade will be taken a s resistance is met again for the 3rd drive where we can look to enter long after any type of reversal pattern shown at the fib level of 61.8% from the previous low to the current structural high on the longer term 8-hr/daily time frame.


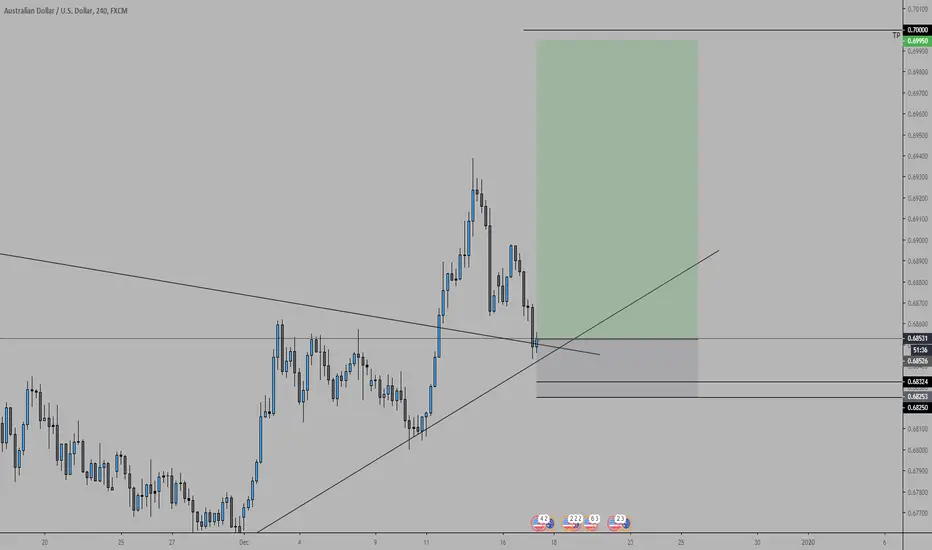
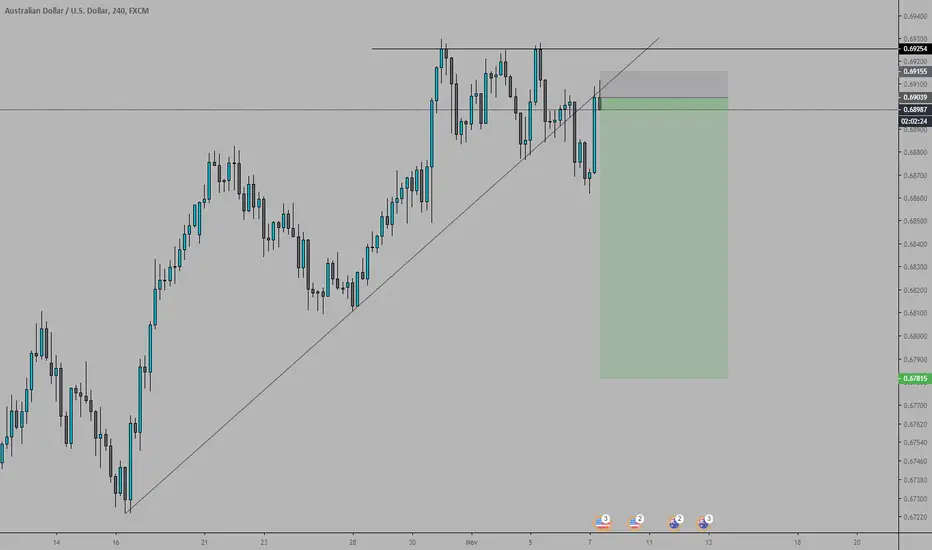
DO NOT MISS THIS TRADEAUDUSD
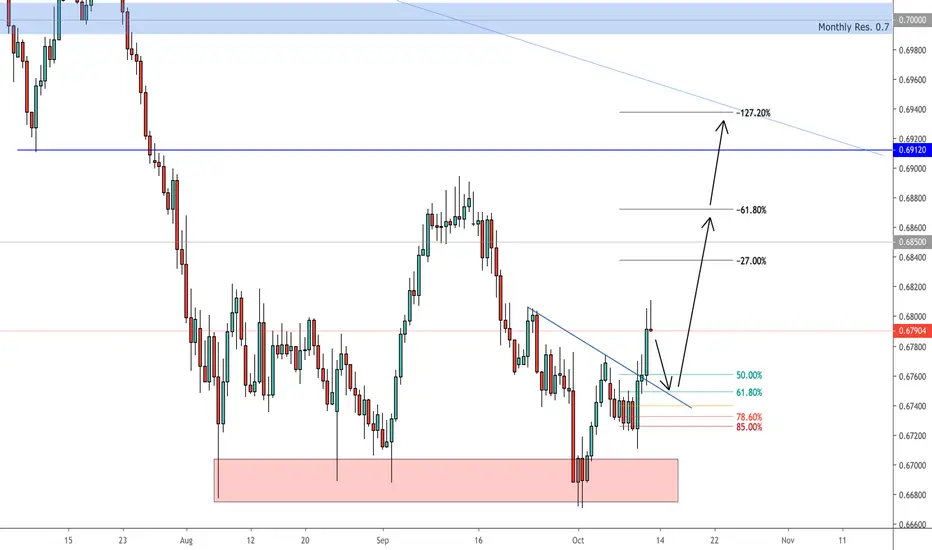
Setup: Structure Breakout & Retest
Confluence:
BRN
Entry:
Buy @ 0.6800; SL @ 0.6770; TP @ 0.6920


AU:Aussie short updates from 11.10 (precision is key)See linked charts (related ideas) for the original setup. We'll be looking for price action to signal a buy next week early.

GOLD - TECHNICAL ANALYSIS ON WHAT TO EXPECT - CryptoManiac101GOLD / USD TA
We have been tracking GOLD down this descending channel for quite a while now. Automatically you would turn bearish on it due to no convincing close and rejection above resistance which means that if you're a bear, you would start targeting 1250 zones for possible re-entry.
Nevertheless, if you take a 'fractal' approach here, we will see that back in March/May we've observed nearly similar pattern which actually resulted in a strong upward break away from the descending channel and general resistance. Can we observe something similar this time around? Possibly however I would not bet LONG or SHORT until we see a close below or above the descending channel.
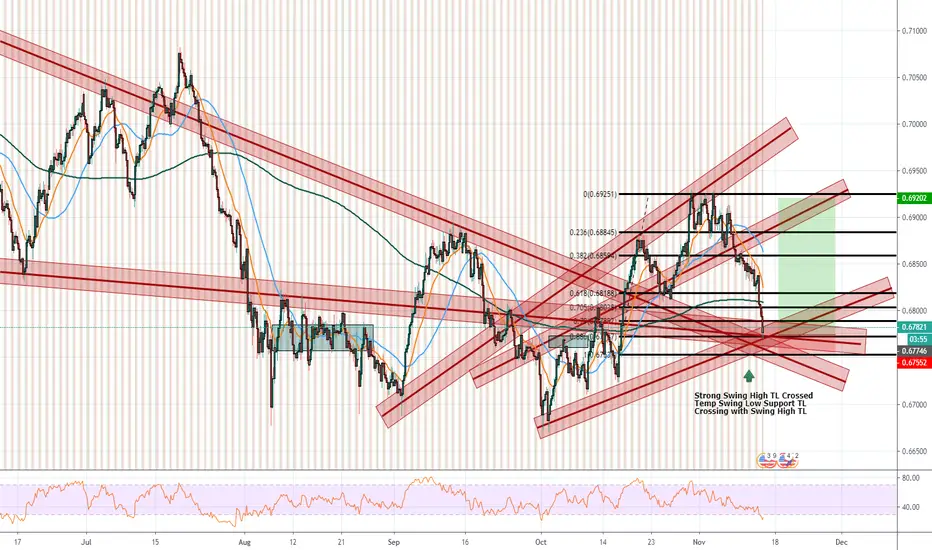
Aussie Short Bias, 11.100.69 seems to be a thick area of supply for Aussie ,we'll be looking to take AU short this week until 0.69 is broken.
Last week's close for AU is key to looking for this bias. This next week we'll be looking for both sides of the trade.

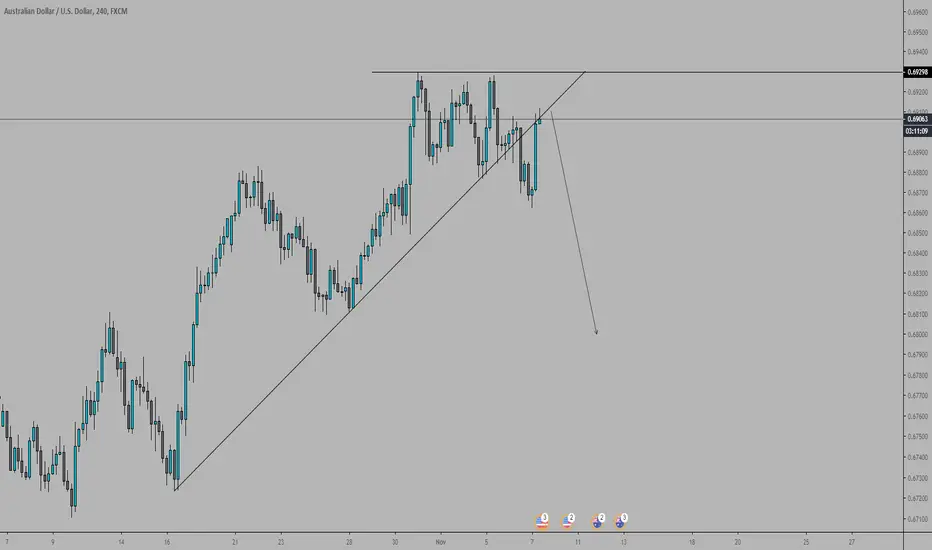
AUDUSD Potential ShortPotential AUDUSD Short
Fibs Align W/ S/R and swing trendline.
Support zone allows for entry space.
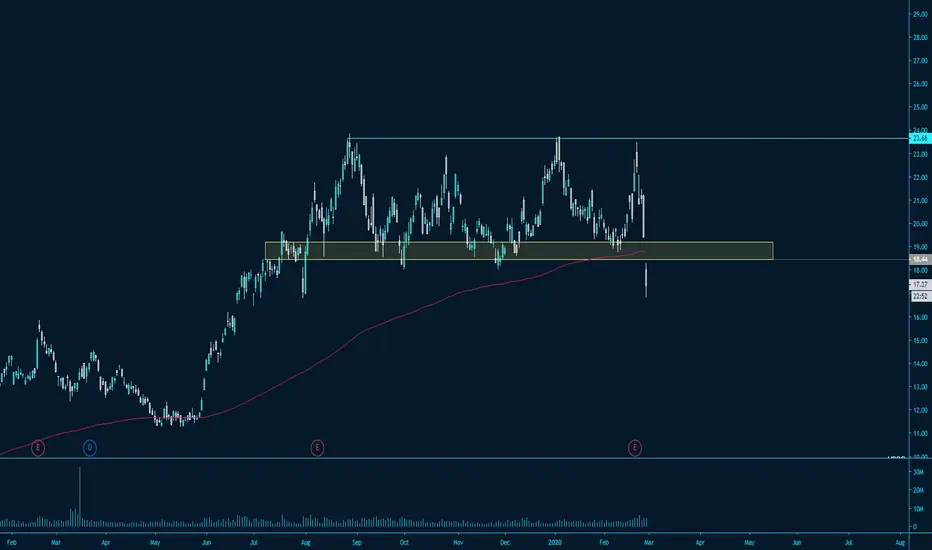
Gold in AUD - Breakout coming. The grey shad is the first 2/3rd of the triangle (point of average breakout). Upward breakout has a 60%, downwards 40% according Bulkowski's research.
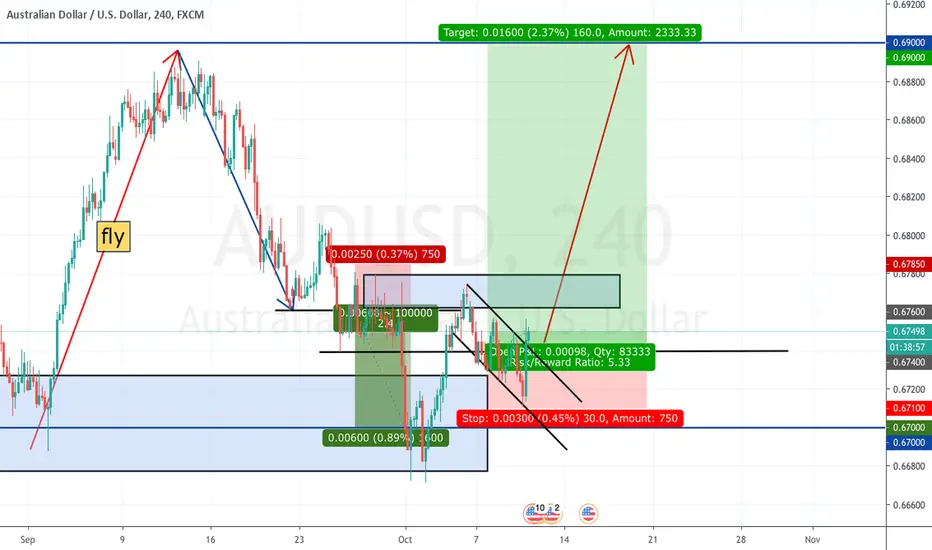
Aussie Fighting BackAUDUSD
Setup: ABC
Confluence:
CRS
61.80 FIb
Entry:
Buy @ 0.6740, SL @ 0.6710 (30 pips), TP @ 0.6900 (160 pips)
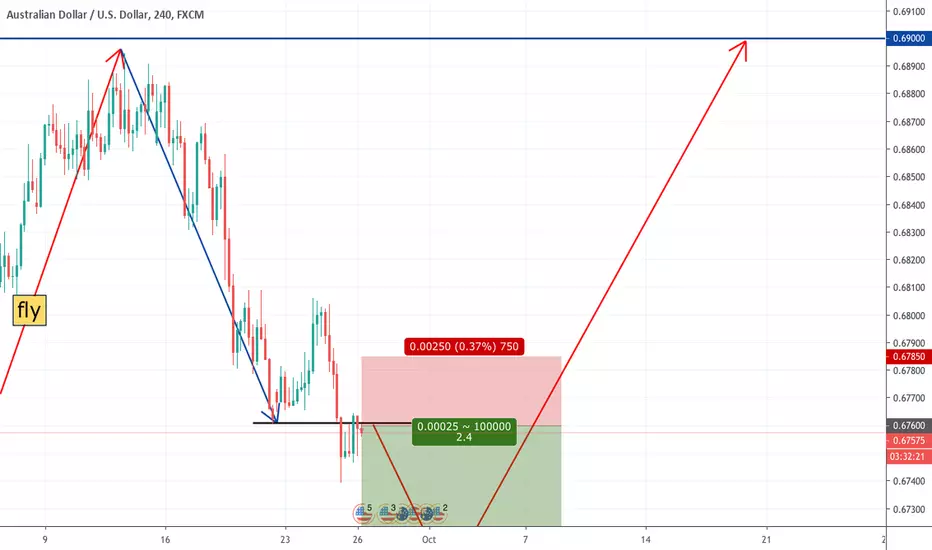
SIMPLE STRUCTURE BREAKOUT ON 4HAUDUSD
Setup: Structure Breakout
Confluence:
sBRN
CRS
Multiple rejections from Resistance
Note:
Cash Rate News tmrw @ 12am. Close the trade is floating negative before news releases
Entry:
Sell limit@ 0.6765, SL @ 0.6785 (35 pips), TP @ 0.6700 (65 pips)
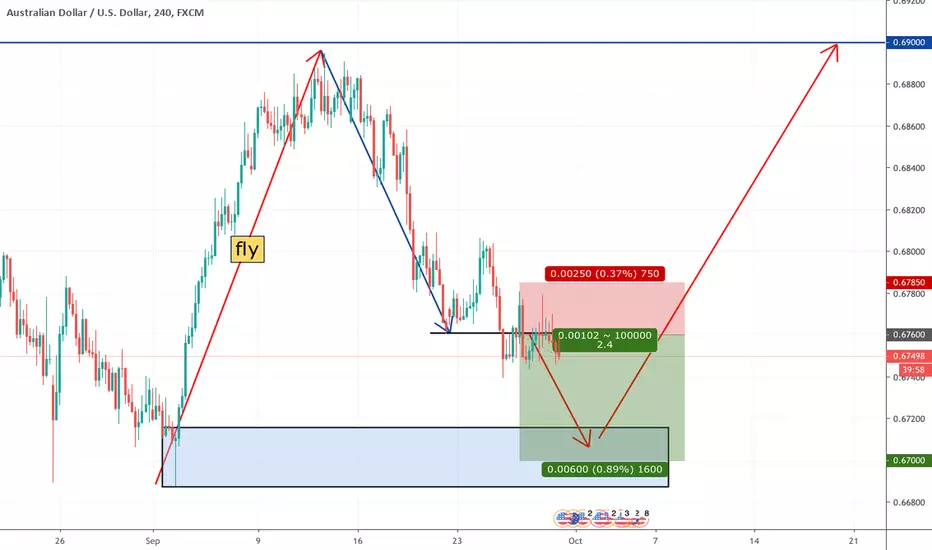
AU 4H - CONTINUE THE FALLAUDUSD
Setup: Structure Breakout
Entry: Sell @ 0.6760,
SL @ 0.6785
TP @ 0.6700
Let's see how it goes. Let me know your thoughts too
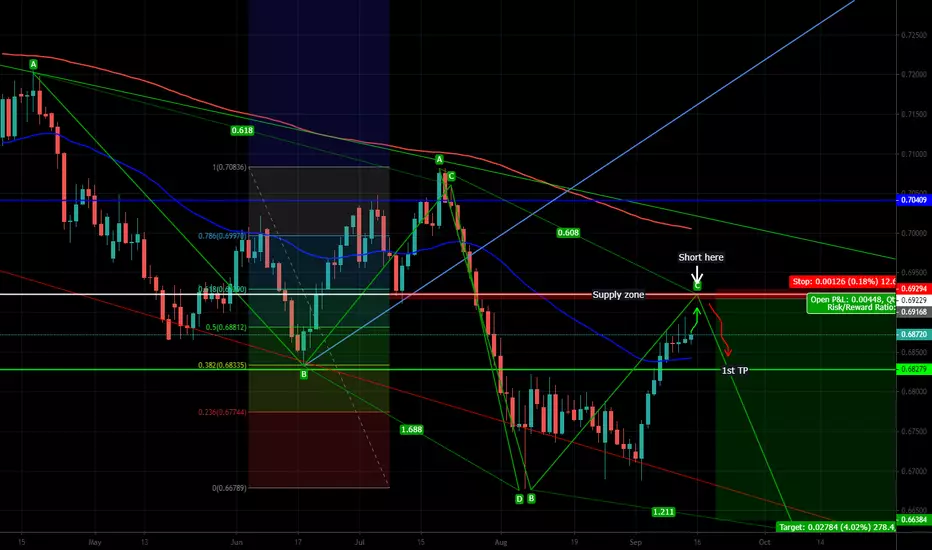
09-12-2019 AUD/USD ABCDFirst ABCD cycle for Aussie was extremely accurate,
possibly we can apply the same strategy for another coming month.
Wait until Aussie reaches at least 60% of Fib level/supply zone then short AU.