AU
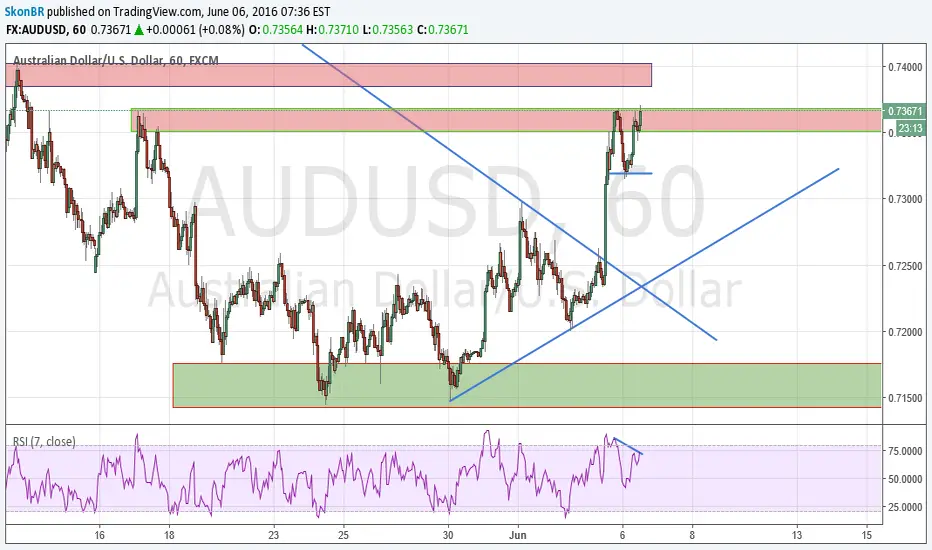
AUDUSD DOUBLE TOP WITH DIV SHORT SIGNAL H1After break of trendline, price went up to the supply zone, created a double top formation, and we see bearish divergence on the rsi, you can entry right away after candlestick confirmation or wait for break of neckline. Stop above supply zone, exit at 0.72860
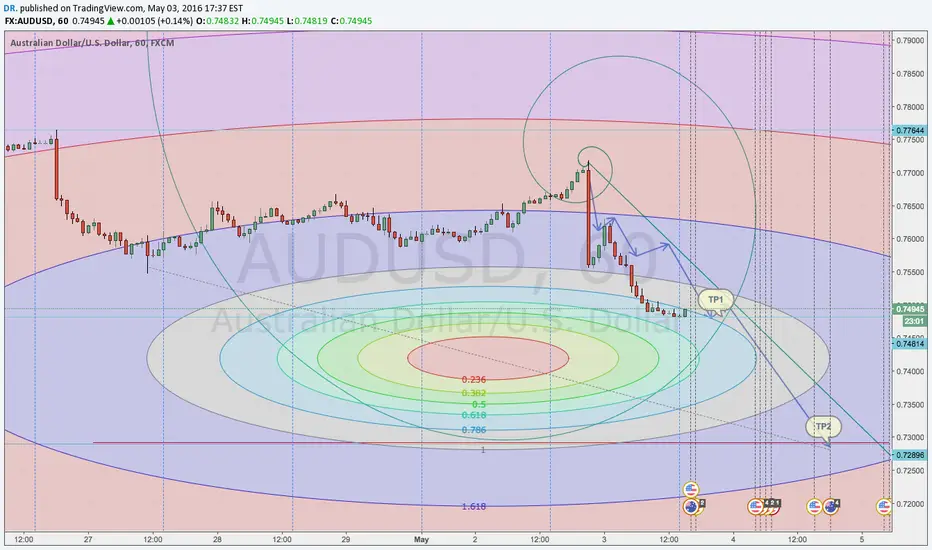
AUDUSD STILL DROWNING AU STILL travelling South, I shot AU @ 0.7681.. and now that DOLLAR is gaining more strength - I will hold my short for a while. I wont get off until 0.7300 or 0.72 somewhere around there ;) but watch out as AU might pop a little till around 0.75050 and then down again.
Happy trading y'all
Dr.
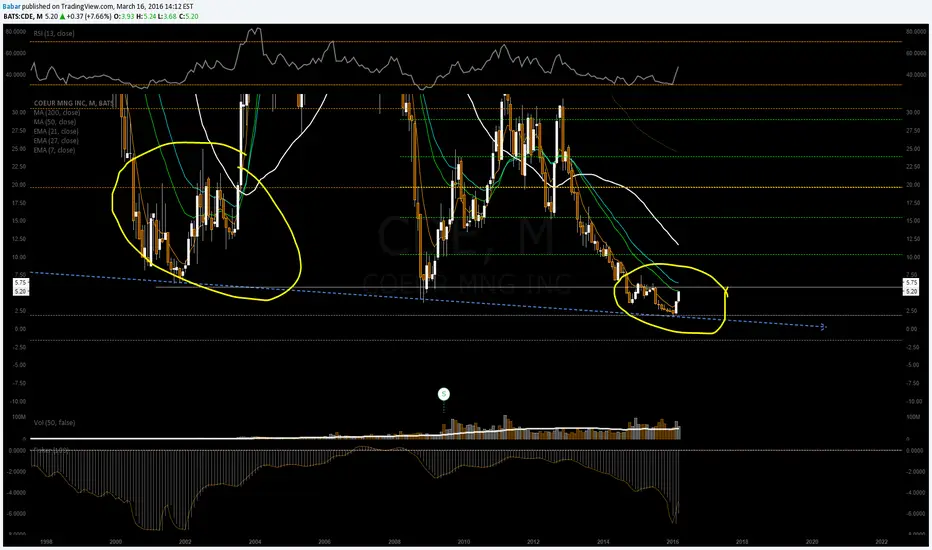
AU - AUMN - CDE / Miners playing upsideOptions are paying pretty good, Waiting for a stretch with stocks resuming sell.
After that probably some consolidation + continuation for metals market, this stage would confirm a bull cycle.
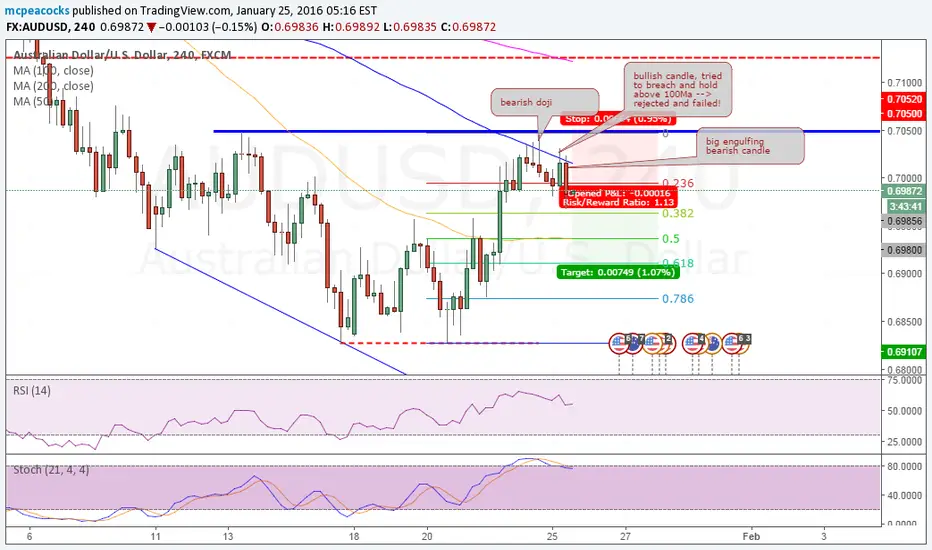
short AUshorting AU due to:
- bearish pin bar on 4hrly, followed by bullish attempt to break and hold above 100Ma (4hr) which FAILED to do so.
Following candle was bearish engulfing 4 hourly candle.
Short with stop above the high of first candle mentioned, Target at 0.618 retracement of last swing up - just above 0.69
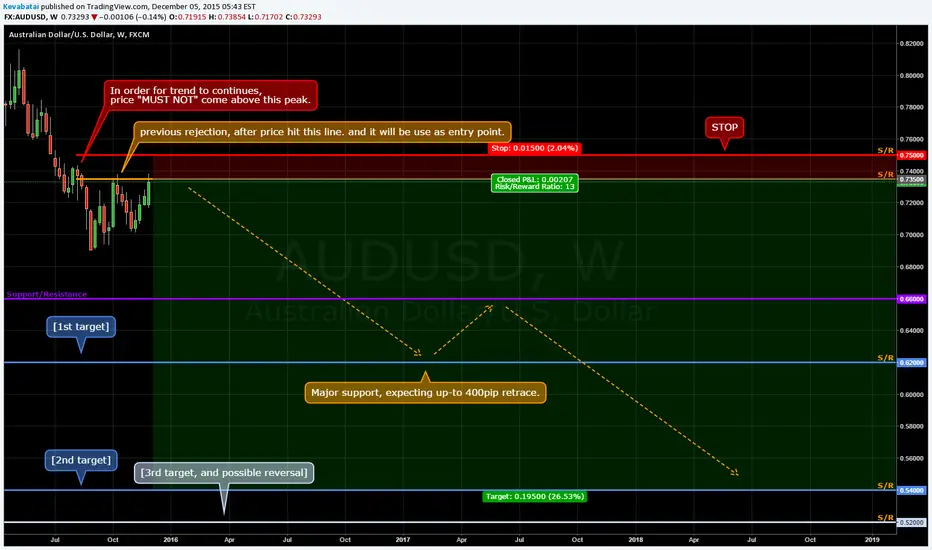
And the drop continues..... Please Look at the secondary chart down below, below for bigger view
This setup are base on the following reason.
1. AUDUSD still in major downtrend (as in alternate chart below). As well as, still moving at high speed (confirm by the how much price has been re-trace in the past when hit support.)
2. Major support/resistance line as shown in the chart below (monthly candle chart). in the chart below indicated major support/resistance where price could be-rejected as reversal point. As in this publish idea (I'am) aim for the maximum bottom @(3rd target).
Setup configuration :: (More info with a bigger views in the follow up monthly chart.)
SHORT @ 0.7350 , (As point by ORANGE box)
his number, come from the recent rejection a few week ago. as well as, mutiple rejection from 1986, 1987, 1989 and seversal rejection as point in Orange arrow.
STOP @ 0.7500 , (As point by RED box)
This number come from the last peak(a few week back). Plus extra pip ( If price go above this level it mean there is not down trend anymore. and short positions should be exited)
TARGET 1 @ 0.62000
This number, come from rejection from support by the years 1986, minor resistance around years 1998 - 1999. as well as major support at years 2008 - 2009.
TARGET 2 @ 0.54000
This number, come from the lowest point on the chart. the last reversal happen in around years 2000 - 2002(pink box text).
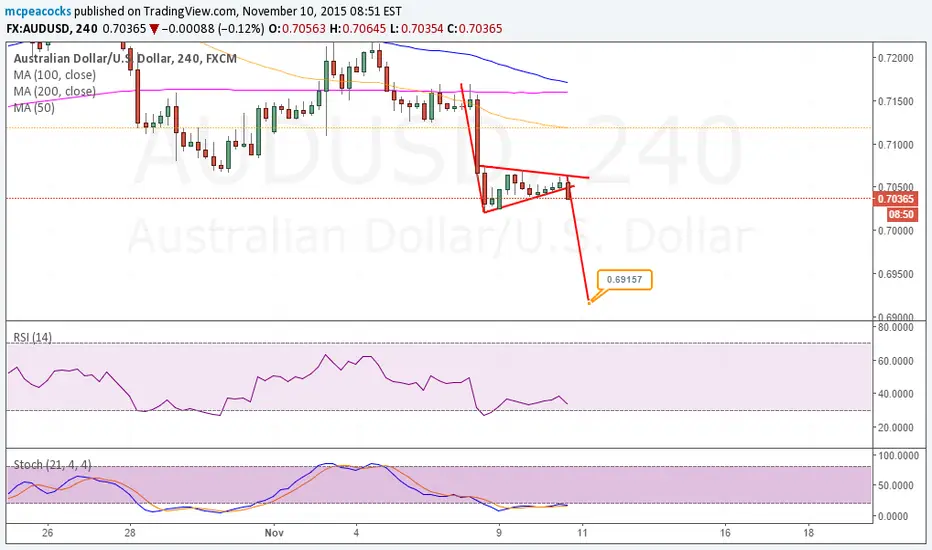
Short AU based on bearflag breakbreak of bear flag on 4hr
target 0.69157
stops above the flag at 0.7080
AJ RIDING SOUTH Business as usual -if market condition remain the same? we are hoping to see AJ decline a little more

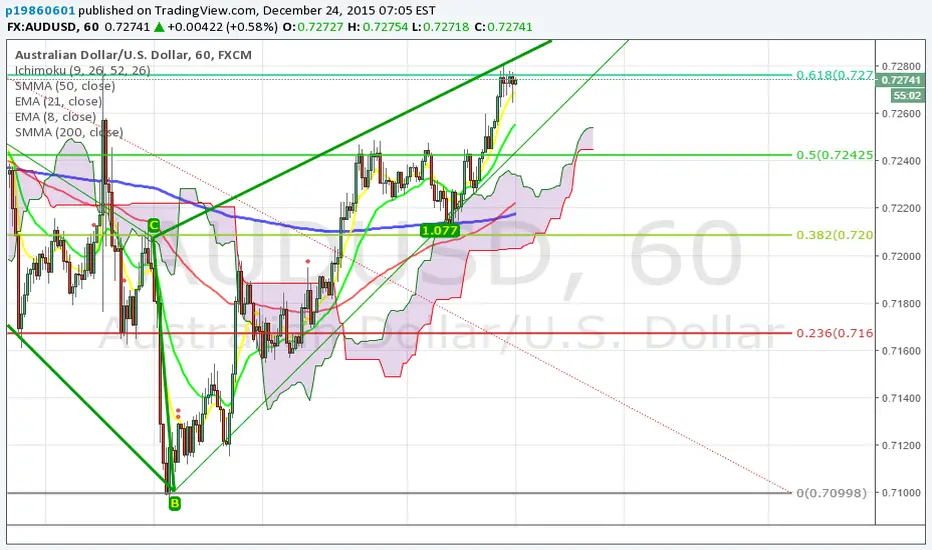
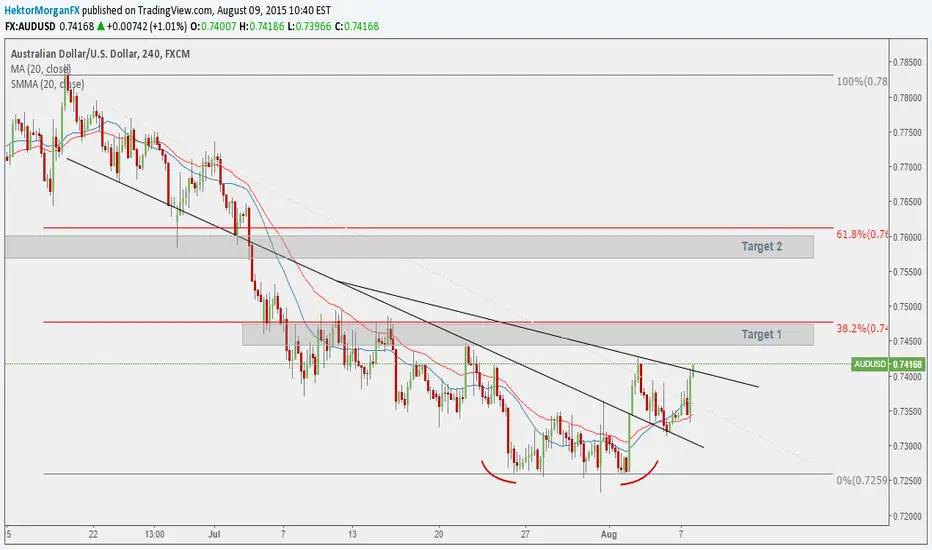
AUDUSD - short term bias - 4hrAfter 52 days of consecutive downside action from the most recent high (daily) , is this now time to go LONG and back the bulls?, here on the 4 hour chart we have a nice double bottom play out and i believe we are heading back up to retest the 38.2 retracement. in confluence with this particular FIB retracement on the 6th of july we located a minor area of support and we respectively held that level until the following day breaking straight through it, now from this point we had a minor fall in the next few days and went on to retest the support as resistance on the 10th of july and again on the 15th, indeed failing!. As we continue this week keep an eye on this level as we could break the resistance heading higher to the 61.8 or infact be a perfect entry for a sell order.
Happy Pippin
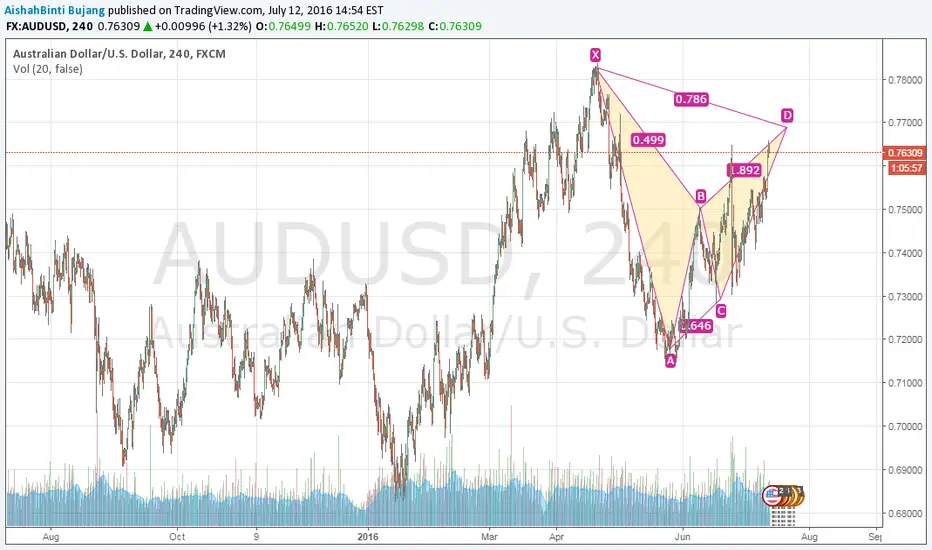
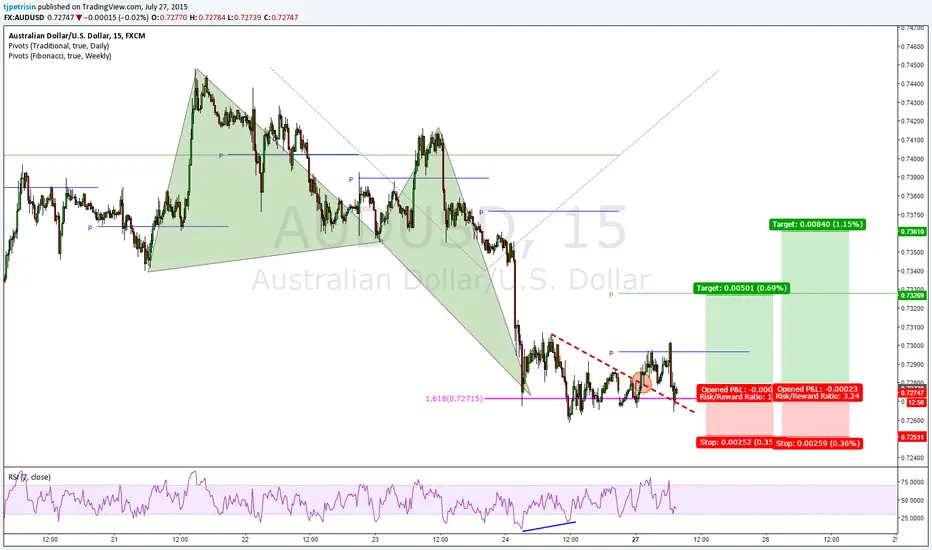
AUD/USD Long1.618 Butterfly pattern with divergence/trend-line break. Taking profit off at the weekly pivot and then B point of the Butterfly pattern.
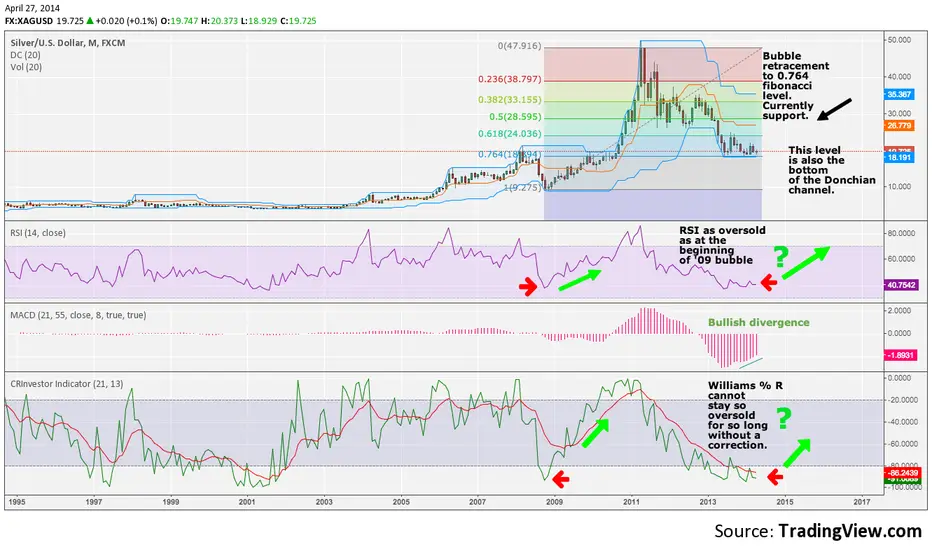
Silver Ready to Sky Rocket I have been adding to my silver position for months and months along this most recent bottom. At this point, silver seems like it has been beaten down to it's absolute bottom. It is currently sitting along the .764 fib level, which also happens to be the bottom of the donchian channels. The RSI is as oversold as it was at the beginning of the '08 bubble. Bullish divergence on the MACD also suggests momentum is changing.
As far as fundamentals, we have an increasing risk of hot war, an extreme bubble in bonds, stocks, and real estate, gold and silver look to be an amazing buy.
Please also see my S&P500 chart as a follow up to this idea.