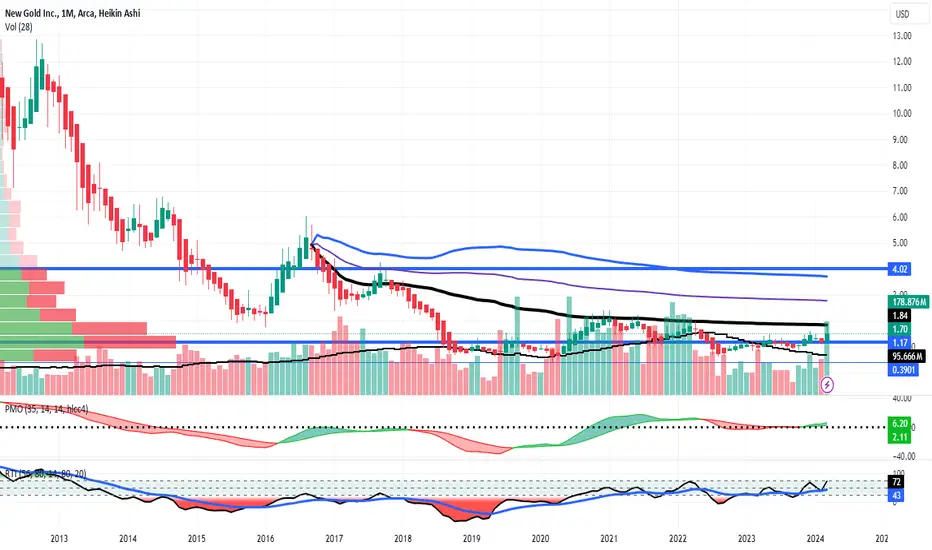
NGD - a gold mining penny stock is bullish LONGNGD on the highly reliable monthly chart has signs of bullish momentum including a cross over
the POC line of the volume profile,a monthly volume bar over the running mean for the first
time in two years price crossing over the mean anchored VWAP and both the trend and
the momentum indicators making reversals. I will open a long trade of both shares as well
as a lot of call options for mid- November striking OTM at $ 1.50. This junior miner
stands to gain earnings when gold prices rise proportionately more than established global
mining operations. My target is 3.5 just under two standard deviations above VWAP. I will
take off 1/3 of the position at 2.7 at the first standard deviation above VWAP in best practices
for risk management.
AU
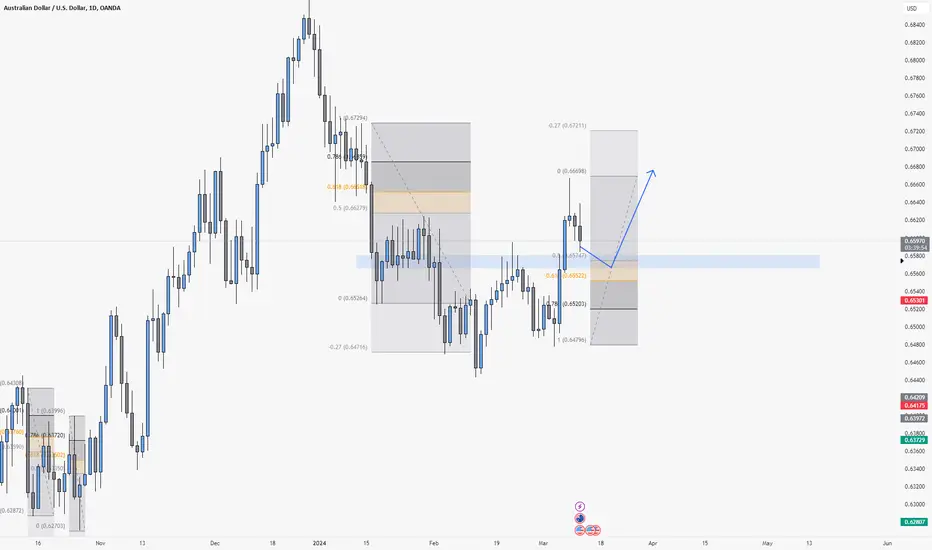
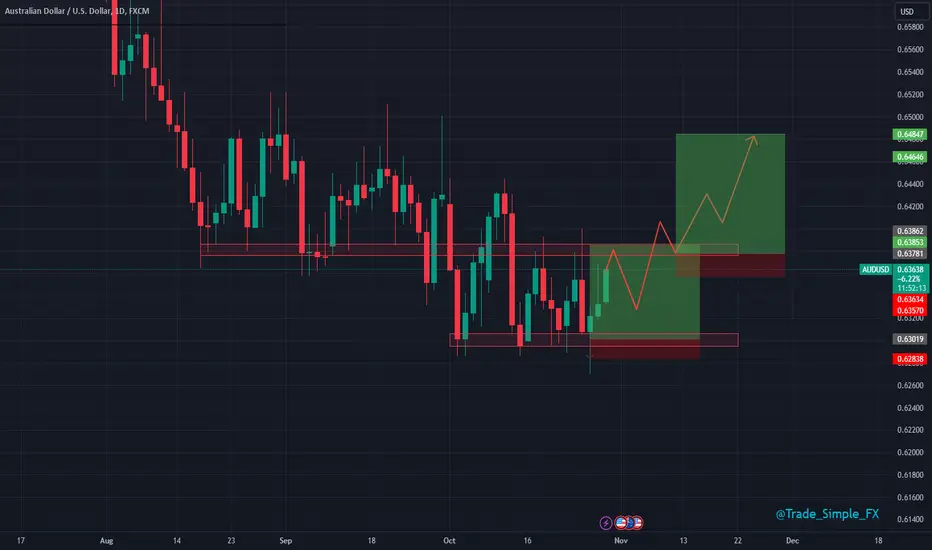
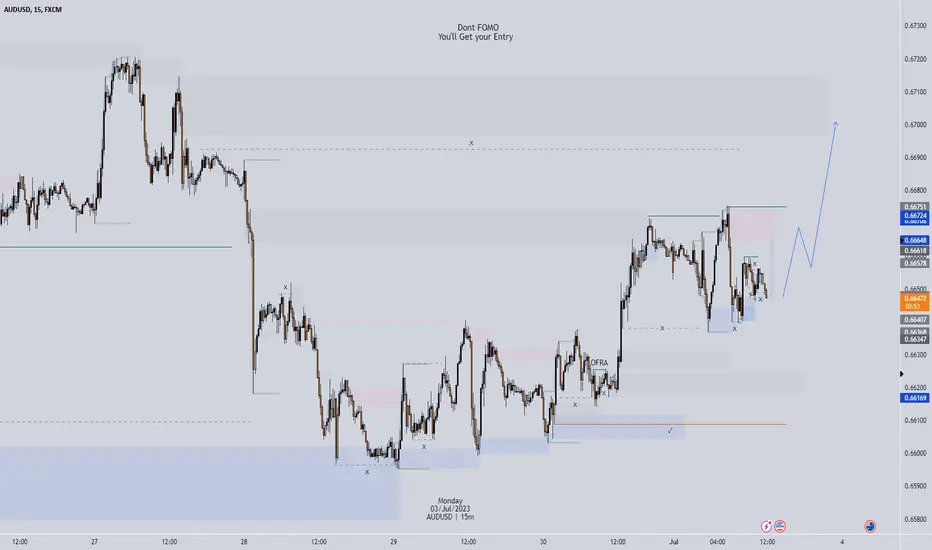
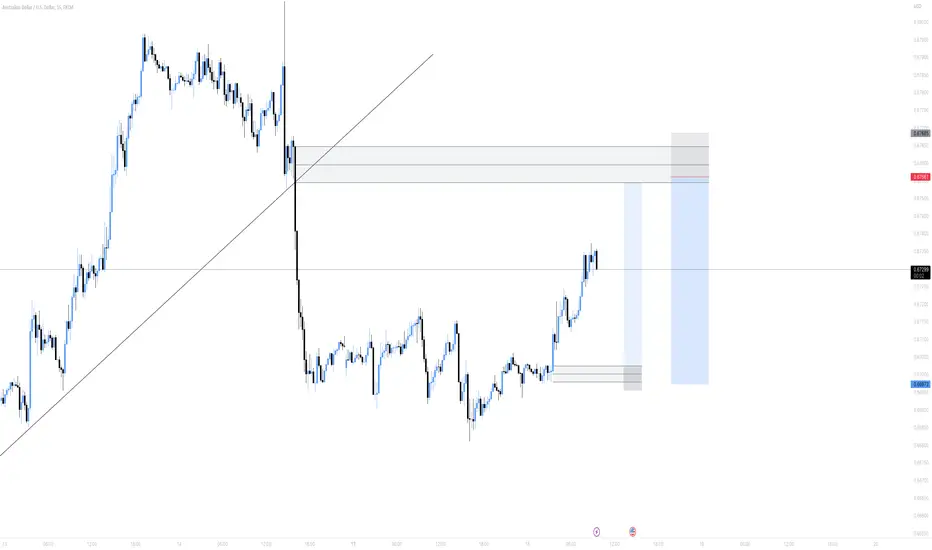
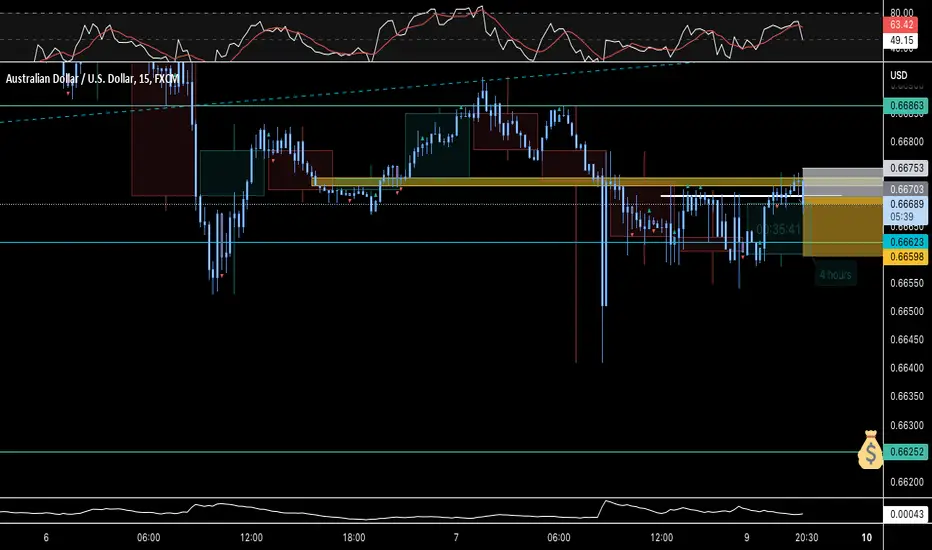
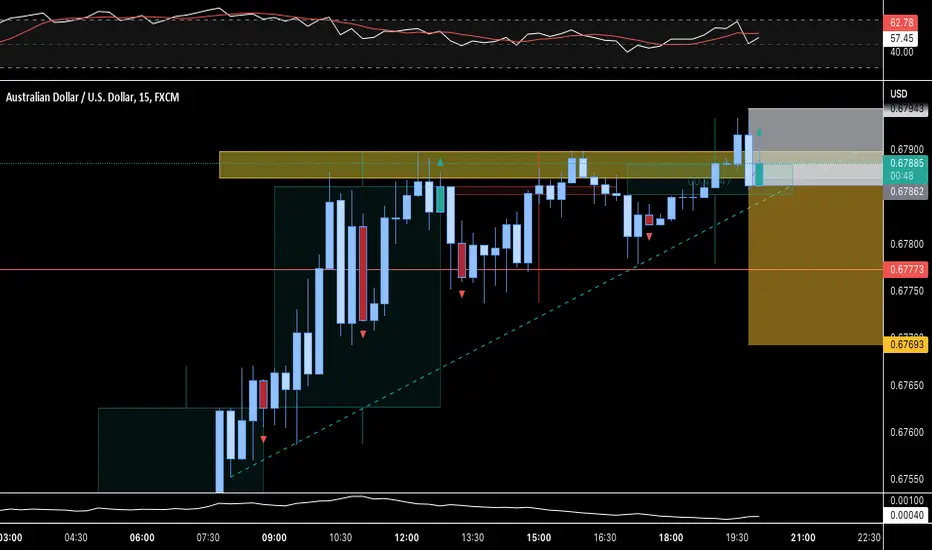
AUDUSD: GET YOUR LONGS READY!We are seeing clean bullish momentum for this pair. Excellent and clear market structure of lower lows and lower highs.
Now looking for trend continuation to take a long trade.
Waiting for at least a 50% retracement into the resistance turned support- then we look for a bullish market structure shift on the 1hr and ATTACK!
This is looking like a very yummy long!
Follow and Stay tuned my friends ;)
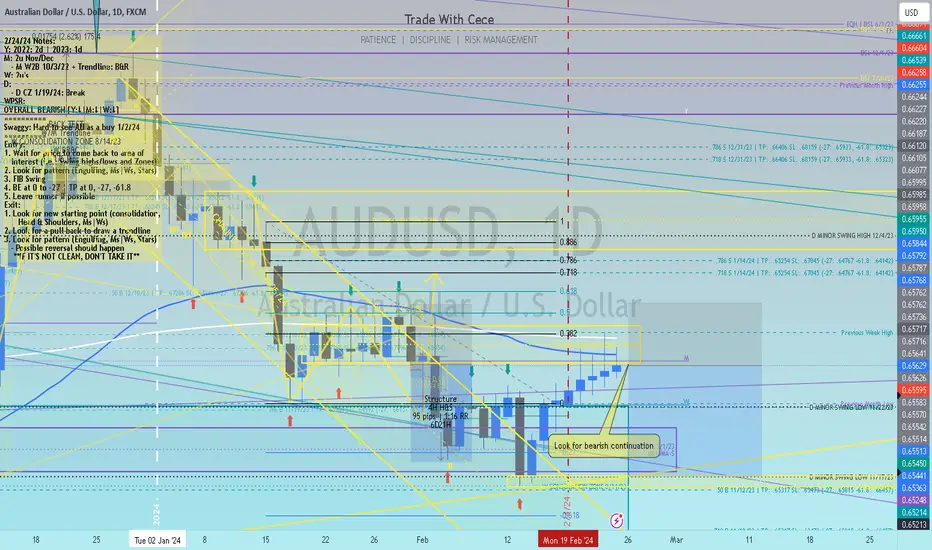
AU D Sell Idea 2/24/24Looking for price to sell down during the upcoming week. There are several inverted hammers leading up to the end of the week with very long wicks.
Price is also under the 200/50 EMA.
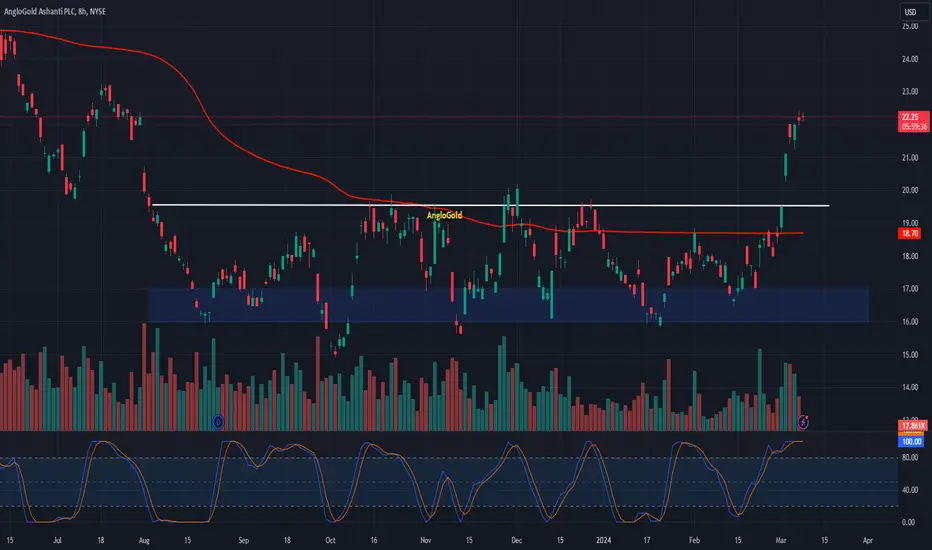
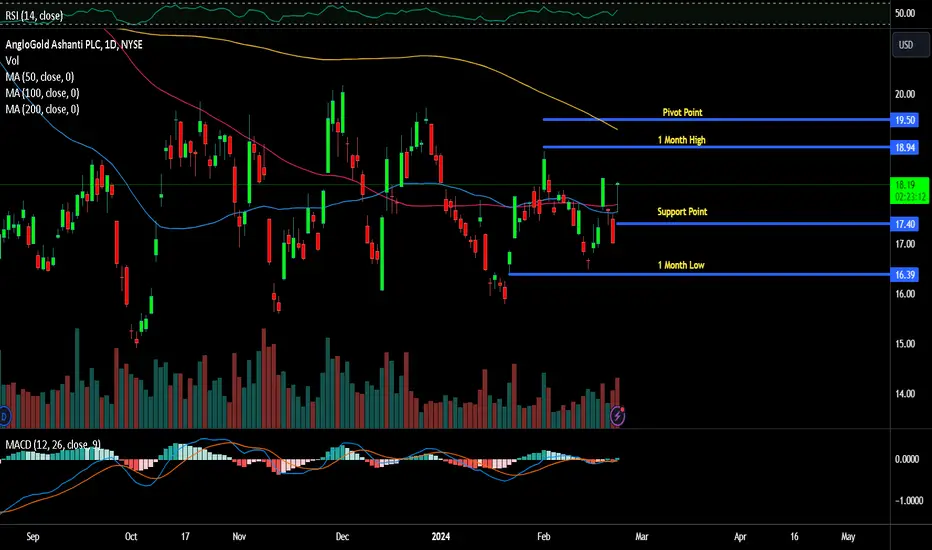
⛏️ AngloGold Ashanti (AU): A Mining Move! 🌍⛏️📊 Analysis:
Strategic Investment: NYSE:AU is making a strategic investment in G2, emphasizing exploration success as a growth driver.
Listing Shift: Plans to switch the primary listing from Johannesburg to New York are underway.
Major Shareholder: AU aims to be a major shareholder in G2.
Cost Management: Commitment to cost management is highlighted.
Bullish Sentiment: The analysis expresses a bullish sentiment on AU.
Entry Strategy: Consider an entry above the $16.00-$17.00 range.
Upside Target: Potential upside target in the $25.00-$26.00 range.
🌐 Note: Stay informed about mining industry trends and any developments in AU's exploration activities.
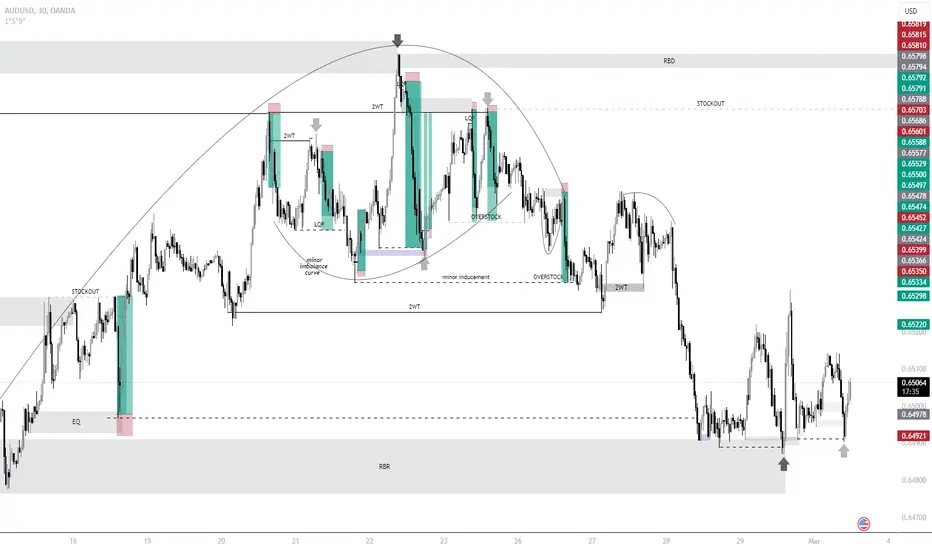
AUDUSD MID TERM VIEW | 1H (update)Yesterday inducement, today inducement. I'm in buys. Hbu?
I'm not happy with the movement of AUDUSD i NZDUSD that's why I'm going with a low lot and already in BE.
2WT = 2 Way Trap
RBR = Rally Base Rally demand zone
Arrows = Inducements
AngloGold Ashanti Surge Despite Production Challenges ReportAngloGold Ashanti (NYSE: NYSE:AU ), one of the leading global gold mining companies, recently disclosed its 2023 full-year results, revealing a 3% decline in gold output compared to the previous year. This setback was attributed to various operational challenges encountered across key mining sites in Tanzania, Guinea, and Ghana. Despite the decline in production and gross profit, the company's dividend payout also experienced a reduction. As investors assess the implications of these developments, it prompts a deeper examination of AngloGold Ashanti's ( NYSE:AU ) operational resilience and strategic outlook.
Production Challenges:
In 2023, AngloGold Ashanti ( NYSE:AU ) faced hurdles stemming from production slippages at crucial mines, notably in Tanzania, Guinea, and Ghana. Factors such as poor ground conditions at the Obuasi mine in Ghana and a carbon-in-leach tank failure at the processing plant in Siguiri, Guinea, significantly impacted gold output and operational costs. These setbacks highlight the inherent risks associated with mining operations, particularly in geologically complex regions. Moreover, the decline in ore tons processed and recovered grades underscores the operational intricacies involved in maintaining consistent production levels.
Financial Performance:
The company's full-year results for 2023 revealed a notable decline in gross profit, which fell by 9% compared to the previous year, amounting to $1.027 billion. This decline reflects the adverse effects of operational disruptions and underscores the financial implications of production challenges on profitability. Additionally, the decision to reduce the dividend payout from $0.23 to $0.19 per share signals a cautious approach by management amidst the operational headwinds. While dividend reductions can be disappointing for investors seeking income, they also indicate a prudent capital allocation strategy aimed at preserving financial stability and supporting future growth initiatives.
Operational Resilience and Mitigation Strategies:
Despite the setbacks faced in 2023, AngloGold Ashanti ( NYSE:AU ) remains committed to enhancing operational resilience and mitigating risks. The company's management has outlined strategic initiatives aimed at addressing the underlying issues that contributed to the production decline. This includes investments in infrastructure upgrades, technology adoption, and operational efficiencies across its mining assets. By prioritizing safety, sustainability, and productivity, AngloGold Ashanti ( NYSE:AU ) aims to optimize its operational performance and deliver long-term value to shareholders.
Investor Considerations:
For investors evaluating AngloGold Ashanti's ( NYSE:AU ) stock, the recent production challenges underscore the importance of conducting thorough due diligence and assessing the company's risk management capabilities. While operational disruptions are inevitable in the mining industry, investors should focus on the company's ability to navigate challenges effectively and execute its strategic objectives.
Conclusion:
AngloGold Ashanti's 3% drop in 2023 gold output, coupled with declines in gross profit and dividend payout, highlights the operational challenges inherent in the mining sector. However, the company's commitment to addressing these challenges through strategic initiatives underscores its resilience and long-term growth potential.
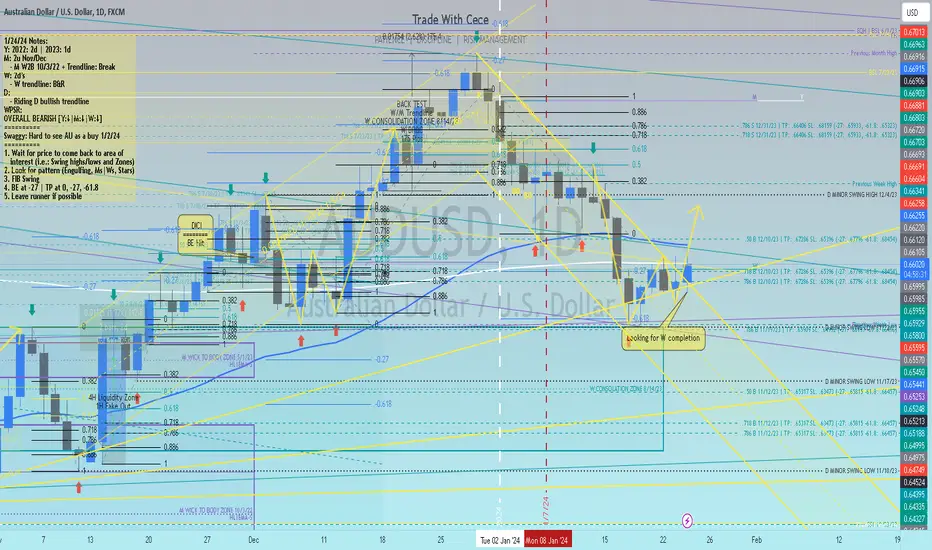
AU D BUY IDEA 1/24/24Price is breaking bullish out of a D Channel + forming a W off a D bullish Trendline. So I am looking for the W to be completed with some bullish continuation before continuing bearish.
#AU AngloGold Ashanti bouncing off bottom of flat top triangle?Anglo Gold seems to be morphing in the form of a flat top triangle but it is obviously very early stages. We have a 3 bar hold off the bottom trendline, which have on both prior occasions resulted in a fierce rally in price. Should we start to see follow through on Monday with a push above the 3 day highs then we have a really good chance of going to test the top of the range at R375.00. A break of R375.00 would then confirm the flat top triangle breakout with much higher targets in place.

AUDUSD D1 - Long SignalAUDUSD D1
Similar setup here for the aussie/dollar. We managed to get off the ground a little bit faster here as compared to cable. That being said, we also got caught with that liquidity dump and spike, which punctured support and stops before flying higher.
I feel we may see some rejection at 0.63800, before then gearing up to break upside, largely depending on the DXY and if this can start to reject that resistance price we have indicated convincingly.
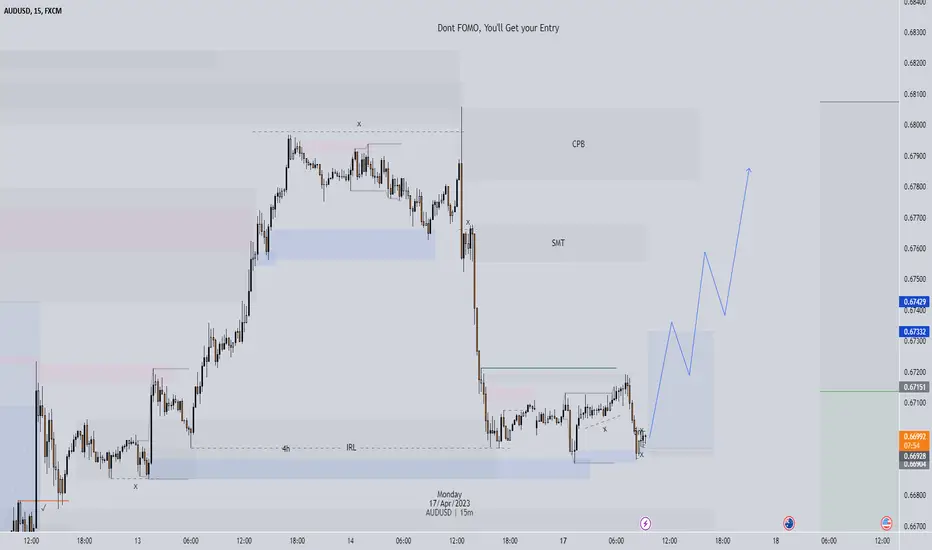
AUDUSD - Long Trade Idea (ICT)My macro bias is still bullish for DXY, therefore bearish for AUDUSD and other XXXUSD pairs. However, I am anticipating further retracement to the upside on the sub-daily timeframe.
Preferably I would like to see the Buyside Liquidity just above the current price to stay untouched or pierced slightly, then to retrace back into the Bisi 2h, 4h (R2F) zone, ideally this move starts to happen after 1am. Then my target would be above the current Buyside Liquidity and into the Sibi 4h above. Confirmation of my trade will be a shift in market structure via a displacement on a lower timeframe and at the specific timing I mentioned.

Looking for Buys after market shiftFirst of all, we know that NFP is in 2h so all this analysis can be invalidated if we are not tagged in before the news and i have to cancel my limit order
Furthermore, this trade idea is based on HTF intention of price action and reading the market structure, so we will break it down starting from the Daily timeframe
1D
4h
1h
15m
and time for our confirmation entry
5m
no need to go lower on 1m bcs 5m is clean

Buying AU following bullish orderflowwe saw price switch back to bullish on the daily TF after that big drop, so we had a sign of buys, and what we always do? we look for confirmations on LTF
1D
4H
1H
15m
5m
1m
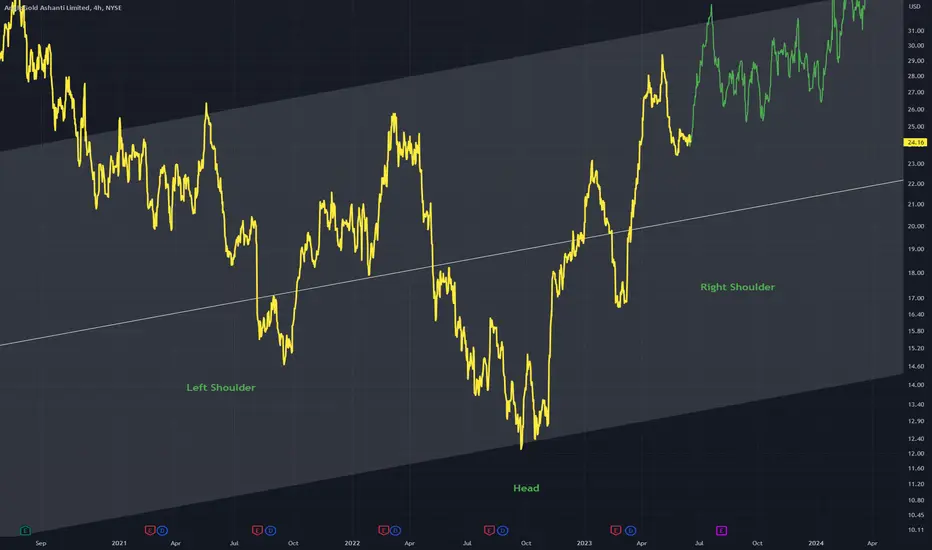
AU - Head and ShouldersHead and Shoulders inverted pattern on the 4Hr chart.
This can be seen to have occurred at the middle line of an up channel.
With each shoulder finding support at the middle line.
I expect continuation up and possibly even breakout of the channel up.
Buying AU Following HTF bullish trendWe saw a trend change on HTF and daily supply failed, so we wanted more confirmation to switch to buys, and its always visible on HTF
4H
as we see, a big up move and we are yet to mitigate HTF supply, so we for sure not looking to take shorts for now
15m
now as we seeing price struggle to go lower and take out the lows and only seeing HH and HL its time to read whats on LTF
5m
everything is mitigated on 5m, so no need for price to go lower (unless it needs more liquidity, or we see major news out)
1m entry
as we see, price is inducing sellers on that HTF weak supply, initiating mini supply chain on 1m JUST TO BUILD LIQUIDITY and then SWEEP IT
will update it as it moves.. lets see
Buys ACTIVE on AUDUSD as anticipated this weekwe got stopped out on monday bcs of news and price had to rebalance itself and create a new demand area and that is where we was looking to take longs from
ofc we waited for our LTF confirmations paired with HTF trend and intention :)
4h
1h
5m
2m entry
AUDUSDSetting up both Long & Short position on AUDUSD.
Analysis based of Supply and Demand, Imbalances and Fair Value Gap.
Looking forward to get a 7R from each from the positions.
Trade Safe
Cheers
Europeanbulls.
Looking for swing long on AUDUSD to higher prices We saw price respect that demand zone and also swept the low inside it and shifted back to bullish breaking supply
and its time to look for our LTF CE
4H
15m
1m
Potential Long Swing Position Following the HTF Bullish MoveWe've been bullish for a while now, but price made a correction of that move just yesterday
and it swept a lot of buy orders so in theory it has the fuel to continue up from here
We are just waiting for it to mitigate a high probability area of demand, and that blue area looks good because it swept liquidity and made a new BOS to the upside on 15m
also, that area mitigated previous demand which gives us more confluences for our trade idea to work out
and since that area looks messy we can't execute on 15m, so we have to wait for LTF confirmations and better RR
4h target
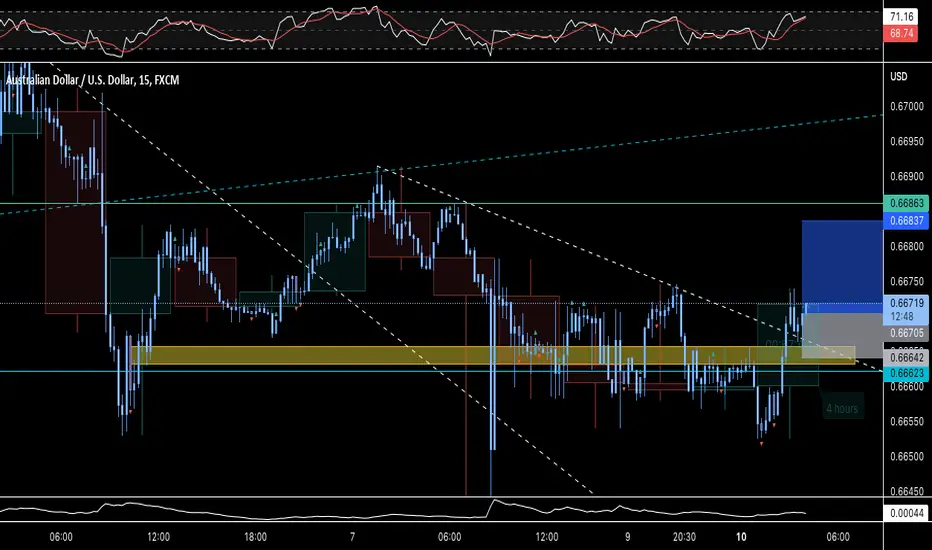
LONDON: AUDUSD - BREAK & RETEST - REJECTIONB&R setup identified in AU and meets the rest our our requirements so I will adapt to what market shows us and go for 2R, lets see if it plays out
ASIA: AUDUSD - B&R/BOBBI SELLSTOP ON MOMENTUMWe missed the entries for short GU gartley, and USDCHF reversal setup buy, but still seem to be in time for AU, lets see market at least gives 1:2RR
ASIA: AUDUSD - BOBBI SETUP - MOMENTUM ENTRYBreak out break back in! after a huge move up lets ride a quick correction down for at least 2R
Daily Update April 3rd 2023Hello Traders!
Here is a short daily update in what I see occurring in AU price action.

AUDUSD TDA for April 2023Hello Traders!
This is my process on breaking down a pair for the next month.
Hope you find this insightful.
