Expected Breakout Higher in AUS200Disclaimer
The views expressed are mine and do not represent the views of my employers and business partners. Persons acting on these recommendations are doing so at their own risk. These recommendations are not a solicitation to buy or to sell but are for purely discussion purposes. At the time publishing, I have a position in AUS200.
Trend Analysis
The main view of this trade idea is on the 1-Hour chart. AUS200 has been in a rangebound move and is expected to breakout in the short to medium term. Based on the market profile, the range is between 7255 and 7325.
Technical Indicators
AUS200 recently crossed above its short (25-SMA), medium (75-SMA) and fractal moving averages and it is currently at the middle of the range. The RSI is above 50 and is heading higher. Moreover, the KST confirmed bullish move with a positive crossover.
Recommendation
The recommendation will be to go long at market. At the time of publishing AUS200 is trading around 7293. The medium-term target price is observed around the 7400 price level. A stop loss is set at 7200.
AUSTRALIA 200

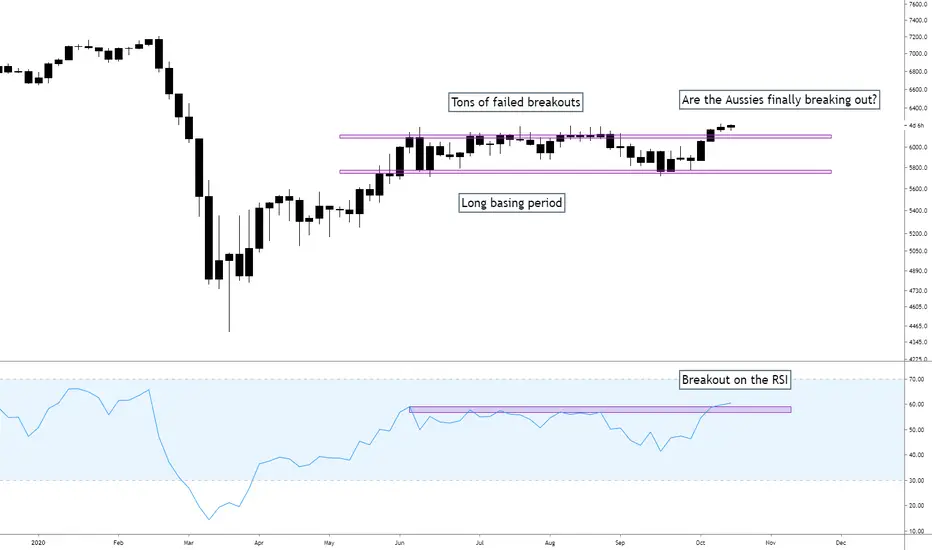
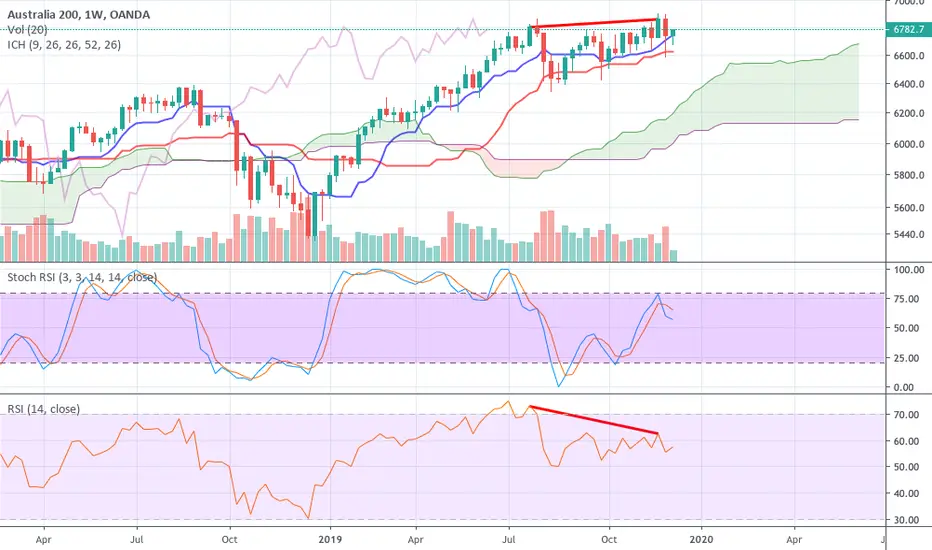
Another Country Breaking Out - Australia!When we look around the world, it often feels like the sky is falling if you tune into financial media. Well here, we look at the charts and see if we can find trends. We have a new breakout in an important commodity economy. Australia! Let’s have a look at the chart.
So here we have Australia going nowhere since June. Tons of failed breakouts with the wicks not being able to stay above 6130. We finally get the breakout with follow through as well. Not only do we have the breakout in price, we also have a breakout in RSI terms. This is bullish. Right now we are looking for stuff to buy. We have made that clear. Now we can add Australia to the list of markets that are breaking out.
Happy Trading!
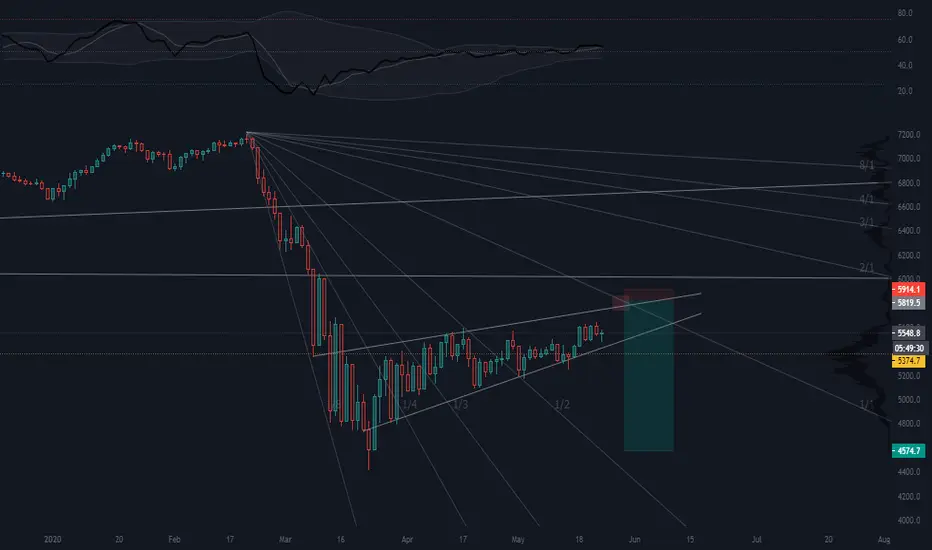
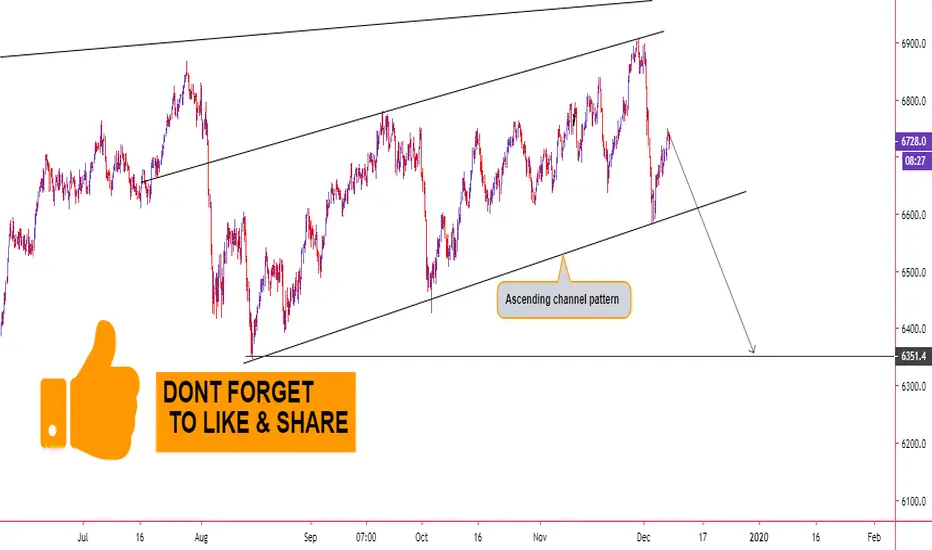
WE MIGHT SEE A DOWN AFTER GETTING INSIDE THE RANGE CHANNELPlease share with me your thoughts,
Kind regards,

Aussie coiling for breakoutIn my opinion, at least. Could have one more wave down but it looks pinned to this high timeframe level that has been a key mirror level in the past. A break could send it soaring.
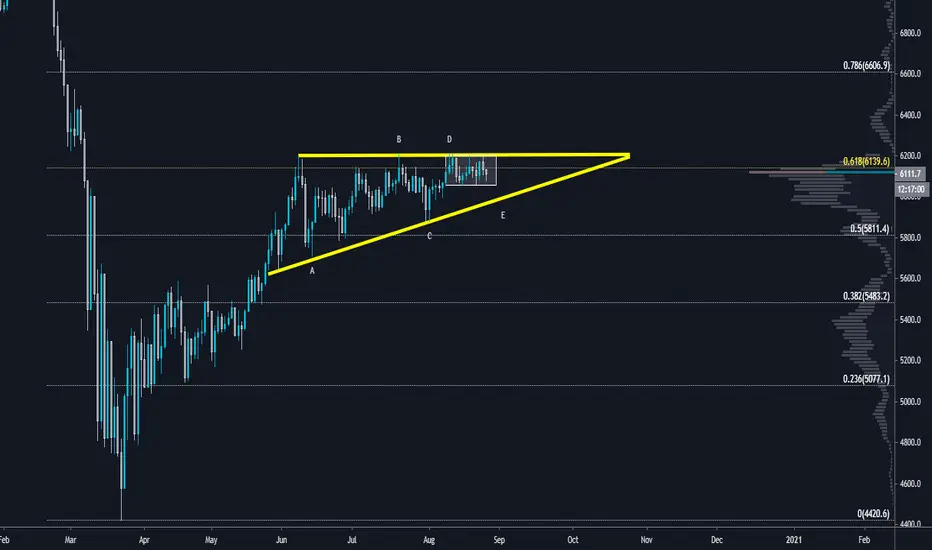
Completion of an Ascending Triangle _ LongHi there,
This wave analysis is based merely on the elliot wave. We have Identified that our wave 4 is in a form of ascending triangle and will soon complete the XY wave. Our extensions shows that we at full completion of XY wave, this why we advice you to look carefully at the price action in order to get a good trading opportunity.
Good-luck

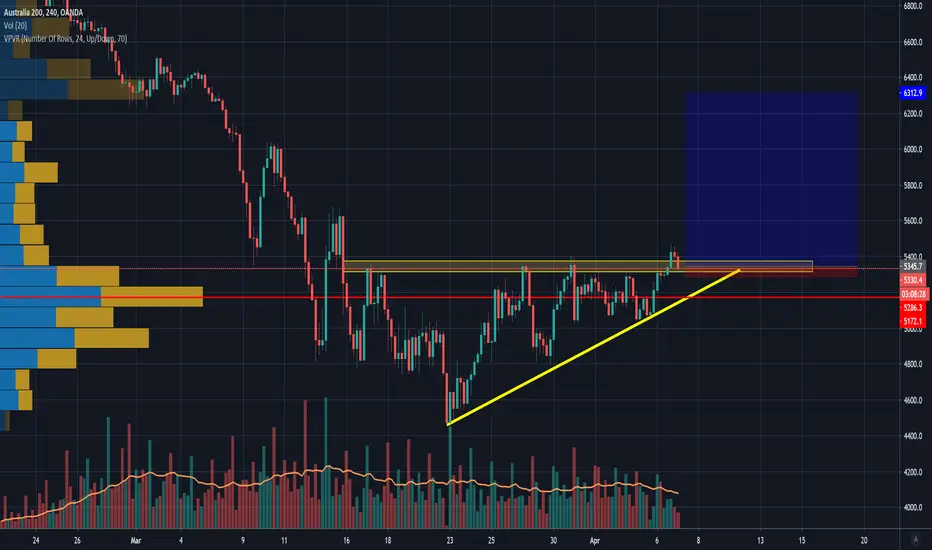
Room for Aussie shares to catch up after RBAThe RBA will restart buying Australia bonds as of tomorrow. With new curfew rules keep virus under bay in Melbourne - could be enough....

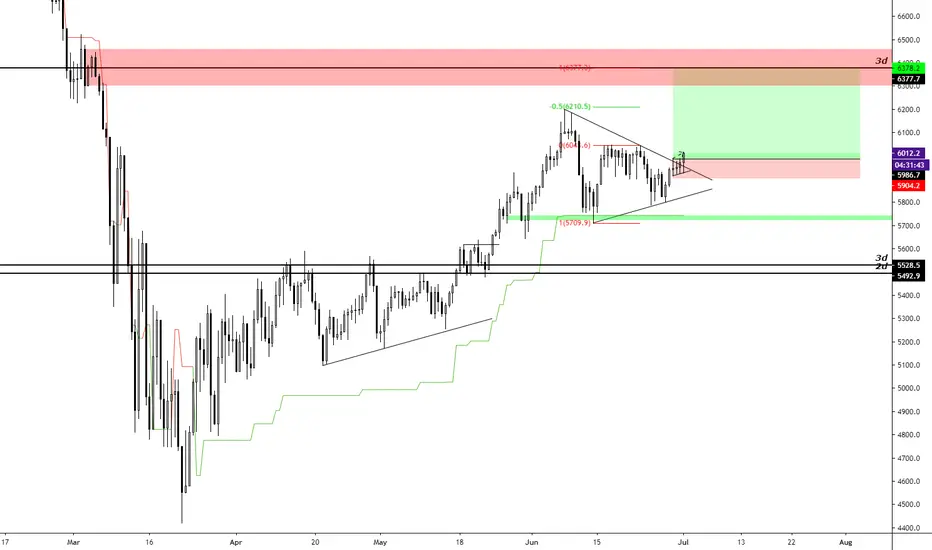
AU200Welcome to this analysis on AU200.
Australian stocks have been in a bullish trend since March.
Looking at the 12HR chart, It looks like it just broke out of a month-long symmetrical triangle consolidation which should act as a continuation pattern in this case.
The target of the pattern is around 6380$ as long as the price holds above the support of the pattern.
There is a long term horizontal resistance and an Order Block around the target zone in the 6300$ to 6400$ which has confluence with the patterns target. The price can get to those levels as long as it stays above 5900$.
This trade idea has 4.5 Rewards to the Risk ratio.
Good luck trading.
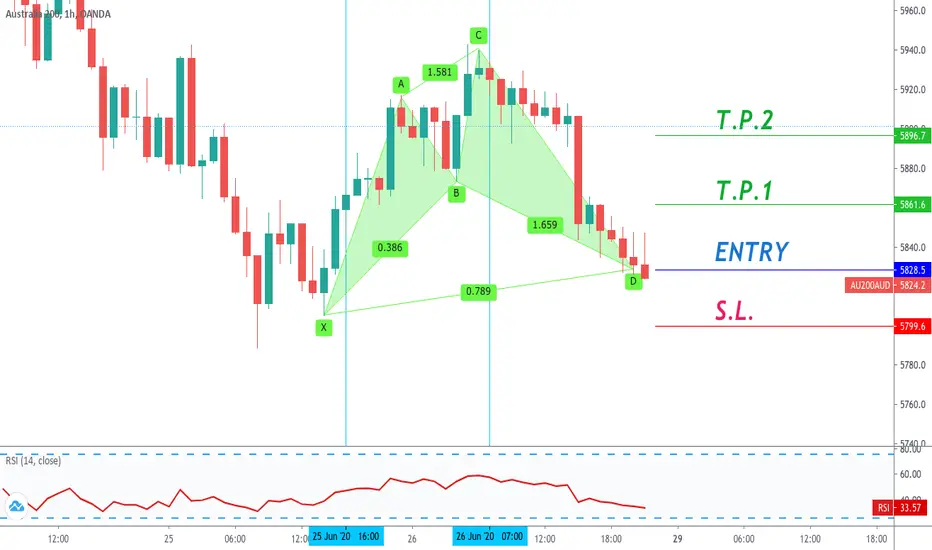
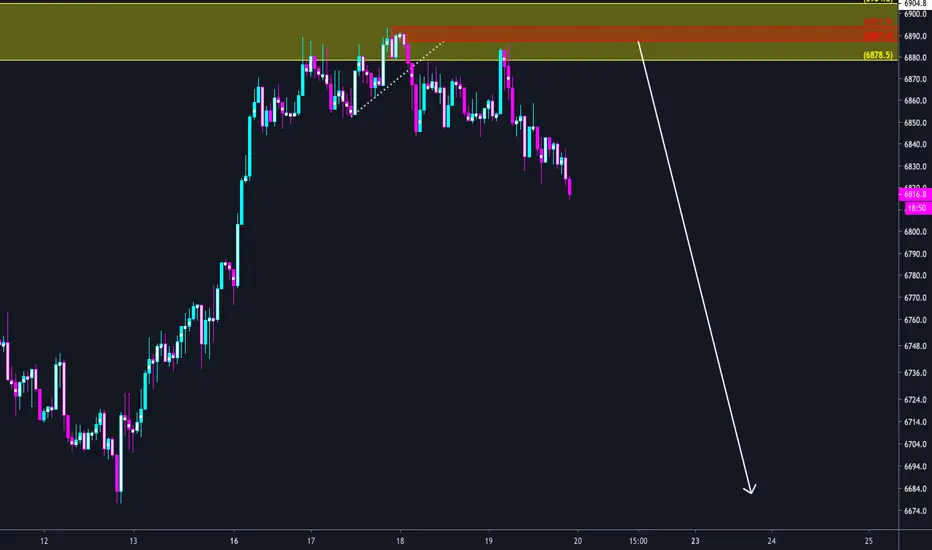
#Australia 200 #Long #Bullish #Shark #PatternBullish shark pattern near completion on the Australia 200 index.
T.P.1) R/R = 1.35%
T.P.2) R/R = 2.4%
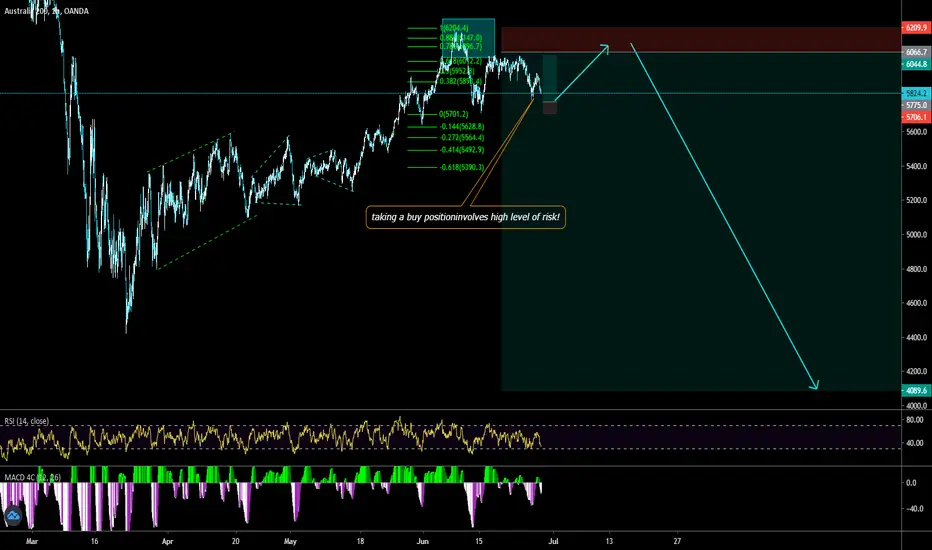
AUSTRALIA200's next BIG SHORT is on the wayThis indicies has a high potential to make a down move/Wave/ on more time,from the technical side. On the fundamental side Covid-19 pandemic 2nd wave is about to start around the world.
Anyway I'd like to suggest you a short position on this instrument, of course you need a risk to reward ratio and risk percentage. Good Luck
Trade Idea on AU200 (ASX) by ThinkingAntsOkMain items we can see on the chart
a) The price is on an ascending Wedge
b) Currently, we can observe a clear corrective Structure (Yellow lines)
c) The next resistance zone we have is a weekly one (light blue rectangle)
d) Based on the technical elements we have our conclusion is: If the price breaks above the corrective Structure, that will give us a high-quality scenario for long trades towards the next resistance zone
e) The Risk-Reward Ratio of this trade is 1 : 2
f) We will move our stop to break even at 6200.00
WEEKLY CHART: (Understanding why we choose that target)


AU200 Short Trade Setup! Welcome to Profitlio Trading!
What's up traders! Thanks for Jumping back on my Analysis, 👨💻 Trader champ is here on your Service, Also hit thumbs up 👍 and support the work
AU200 showing a trend breakout which is a good sign for AUD pairs to crush. Expecting a nice sell on this index. Sketch up your own trade setup and make sure you meet with the required confirmations first before you make your move!
⭕️ ✅ Scroll Down 👇 ⬇️ to signature section for 📲 contact details 💰💰💰
Profitlio Trading ( Since 2014 in Financial Markets )
________________________________________________
Traders Disclaimer: Non of our analysis or trade setups being shared here on trading view is a trading advice. As we keep on weekly updates with our predictions and expectations. We may take them as a trade only if trade setup meets the required criteria ( Confirmations ). Unless we will never take them as a trade if it never reach our trading requirements.
Take them at your own risk as trading is highly risky and you may loss your investments. Our trades are based on Swinging and Mid to long term approaches. All trades executed will be handled under the name of Profitlio Trading only.

ASX Consolidation Fluff,P Action Task For The Week = A DirectionLooking for some confidence or lack of, anything really, to move this market out of this range of chop. Price at Mondays open will be APEXing, so hopefully traders can push this in a direction up or down for some clear trading sentiment. If positive during the week an upward carrell channel could form for the following weeks to respect.Taking sentiment away from the charts and to the global economy there could be down side to come as it can’t keep being prop’d up considering this recession. A direction is needed shortly and the market will show that this week…. or next :P
📈Support & Resistance📉*
Support Levels
1st Support Zone: 5283.0
2nd Support Zone: 5185.5
3rd Support Zone: 21718.4
Resistance Levels:
1st Resistance Zone: 5478.2
2nd Resistance Zone: 5624.5
3rd Resistance Zone: 5943.8
Price Level Consideration
ATH: 7208.2
All Time High Half Way Point: 3604.1
Previous High: 5568.6
Previous Low: 4392.7
🐃 Bulls Verse Bears 🐻
🐃 Bullish above: 6880.9
🐻 Bearish below: 5397.8
Monthly & Weekly Opens
Monthly Open: 5520.6
Weekly Open: 5386.9
If P action can break above the present consolidation it would still show strength to get caught up with this previous zone…

AU200 going up Ascending triangle breakout, similar to many other asset class at the moment, there's major shift of sentiment going on.
###This is not an investment advice, trade with care with your own risk!###
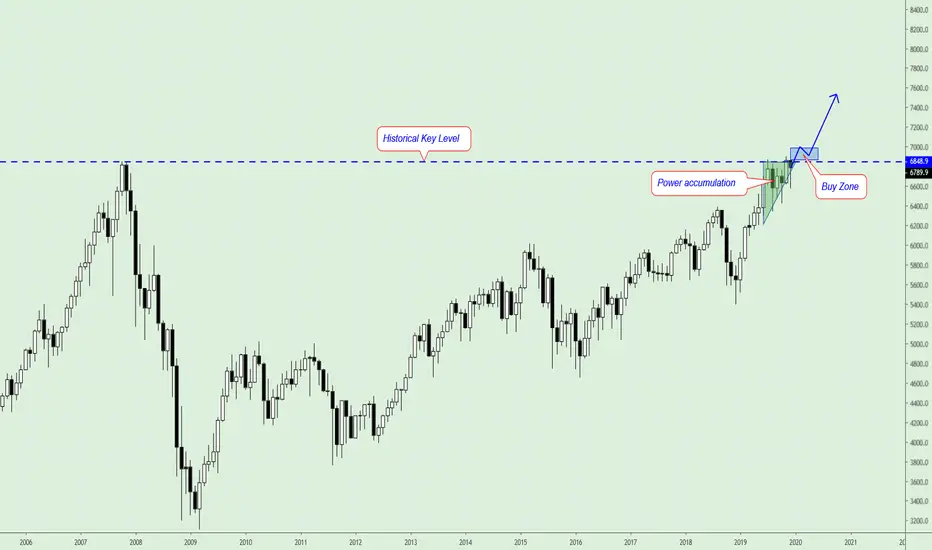
AU200 AUD, Buy after pullback!The price is accumulate it's power under the Historical Key Level.
We can open Buy after it will be crossed and pullback to Buy Zone.
Push like if you think this is a useful idea!
Before to trade my ideas make your own analyze.
Write your comments and questions here!
Thanks for your support!
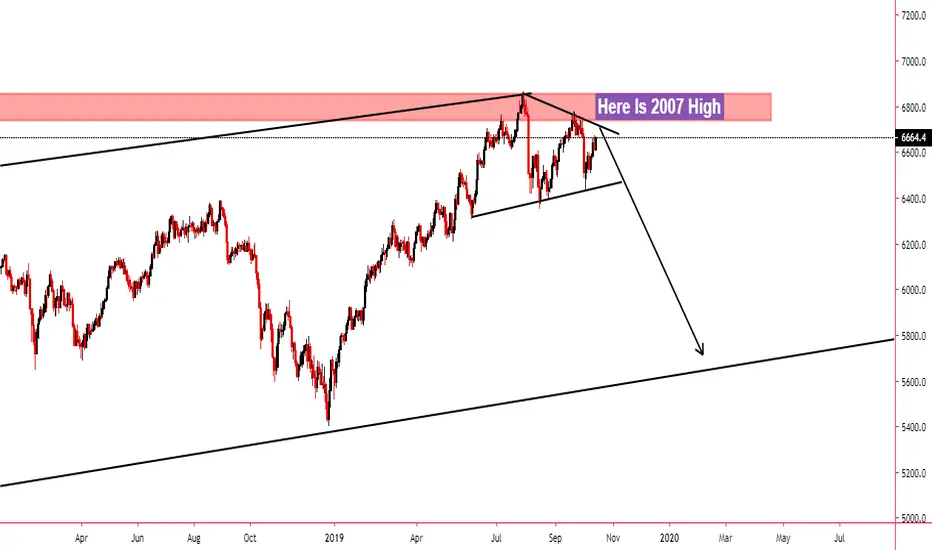
Australia! A Bogans ParadiseHello Traders,
Looking at the chart we can see price has been in a well defined channel for the last 10 years.
It has taken that long for the price to crawl back up to the previous 2007 top and I mean crawl. From an Elliot Wave perspective these are some unhealthy looking waves with deep retracements each time basically invalidating the EW principle. Either way, you can see some kind of 5 waves impulse pattern.
The price reached the previous market top which just so happened to coincide with the top of the channel. The price has tried again to push higher but failed and now looks like a double top and is printing bearish divergence on the RSI.
Can they just keep pushing this with QE?
I think we all know by now the economy is floating on a debt time bomb.
Australia's housing market is one of the biggest bubbles out there which has been fueled through terrible financial practices.
I think this economy is going Down Under!
Bearish on stralia.

AU200AUD Mid-Term PlanAU200AUD along with the other indices is nearing to a correction more than 5 percent.
Entry: 6800
Stop: 6900
First target: 6537
Second target: 6450.
Have a profitable week. Follow to hear more.
AU200AUD: BEARISH MOVE IS COMING.In the name of Allah, the Most Gracious, the Most Merciful.
AU200AUD: BEARISH MOVE IS COMING.
Market following Ascending channel pattern Plus major trend is also bearish.
IT IS HIGHLY RECOMMENDED TO FOLLOW RISK MANAGEMENT STRATEGY.
HOW TO TRADE ON OUR SIGNALS.
We Explain above you use that lot size whatever Capital you have.
Let say, for example; you have 4000 Dollars Capital.
We Posted Trade which has 4 Take Profit.
We will use 0.20 Total lot size We will divide it
in 4 Orders.
0.20 lot Divided by 4 Take profit = 0.05 Lot size.
So we will open 4 Trade with 0.05 Lot size for each trade.
Let See How We will do.
1st Trade 0.05 Lot: Stop loss Same >> Take profit will set to First target.
2nd Trade 0.05 Lot: Stop loss Same >> Take profit will set to Second target.
3rd Trade 0.05 Lot: Stop loss Same >> Take profit will set to the Third target.
4th Trade 0.05 Lot: Stop loss Same >> Take profit will set to the fourth target.
Let Say Our First Target Hitted Then you need to Move All Remaining Trade stop loss to Entry.
If Our Second Target Hitted Then You Need to move All Remaining Trade stop loss to First Target.
If our Third Target Hitted then You need to move All Remaining Trade stop loss to Second Target and So On.
Note: This is only for Educational purposes; this is not investment advice.
Thanks
Adil Khan.
AU200AUD Big Crash is Coming. In the name of Allah, the Most Gracious, the Most Merciful
AU200AUD Big Crash is Coming.
Note: This is only for Educational Purpose this is not Investment advice.
Thanks
Adil Khan.