AUCTION/USDT — Major Accumulation or Bearish Continuation?🔎 Overview
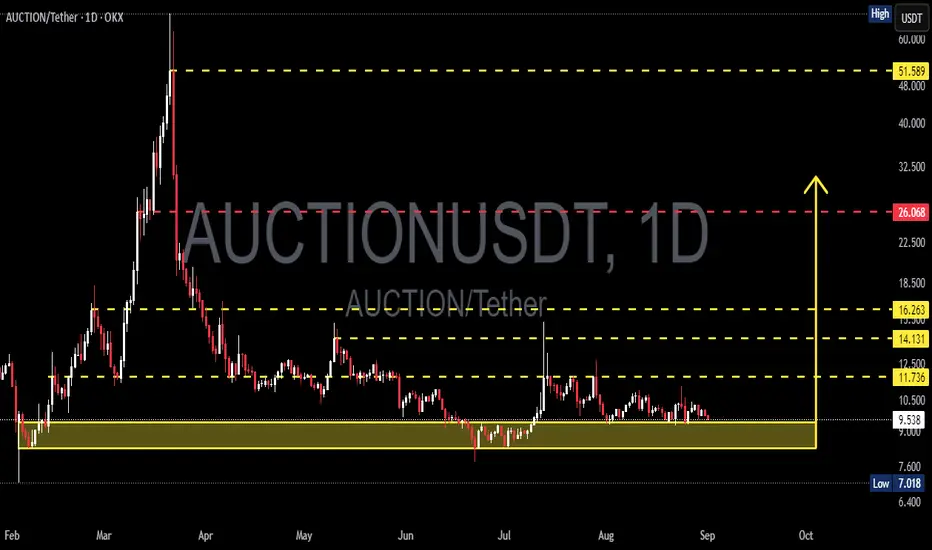
The AUCTION/USDT pair is currently moving sideways within the critical demand zone of $7.02 – $9.55 (yellow box). This area has acted as a strong accumulation level since July, serving as the last line of defense for buyers before potential continuation to the downside.
The mid-term structure remains bearish, as price continues to print lower highs since the peak at $51.59. However, this prolonged consolidation opens the possibility of forming a strong base for a reversal, should buyers hold this key zone.
---
🧩 Price Structure & Pattern
Main Trend (1D): Bearish → consistent lower highs from the ATH.
Current Pattern: Sideways within demand zone. Potential formation of an Accumulation Base or Double Bottom (W pattern) if a bullish breakout occurs.
Key Support: $9.55 → $7.02 (demand zone).
Step-by-Step Resistances: $11.736 → $14.131 → $16.263.
Major Resistance: $26.068 (psychological level & strong supply).
---
📈 Bullish Scenario
If price holds the demand zone and breaks above $11.736, upside targets become more realistic:
First target: $11.736 (minor resistance).
Second target: $14.131.
Third target: $16.263 (major barrier and liquidity zone).
With strong momentum + volume, retest towards $26.068 becomes possible.
👉 Bullish confirmation = daily close above $11.736 with volume expansion.
👉 Entry ideas:
Spot accumulation in the $7.0–$9.5 range with a stop below $7.0.
Breakout entry above $11.7 after retest confirmation.
---
📉 Bearish Scenario
If buyers fail to defend the zone, especially on a daily close below $7.02, the selling pressure could accelerate:
Possible continuation into lower liquidity areas ($6.4 – $5.5 range).
Breakdown from this base may trigger panic selling, as long-term demand zones often lead to sharp moves when invalidated.
👉 Bearish confirmation = daily close below $7.02.
👉 Entry idea: Short after confirmed breakdown and failed retest of the demand zone.
---
⚖️ Key Notes & Risk Management
The $7.0 – $9.5 zone is the battlefield between bulls and bears. As long as it holds, reversal potential remains.
Breakdown = bearish bias takes over.
Risk management:
For longs → stop below $7.0.
For shorts → stop above $9.5 (if breakdown is valid).
Beware of false breaks — always wait for daily close confirmation.
---
📝 Conclusion
AUCTION is at a make-or-break level. Will the $7.0–$9.5 demand zone become the foundation for a bullish reversal towards $11.7 → $14.1 → $16.2, or will it collapse into a bearish continuation towards deeper lows?
➡️ Patience is key — wait for confirmation before committing.
➡️ This zone will decide the next major direction for AUCTION in the coming weeks.
#AUCTION #AUCTIONUSDT #CryptoAnalysis #AltcoinSetup #PriceAction #SupportResistance #BreakoutOrBreakdown #CryptoTA #SwingTrade
Auctionlong
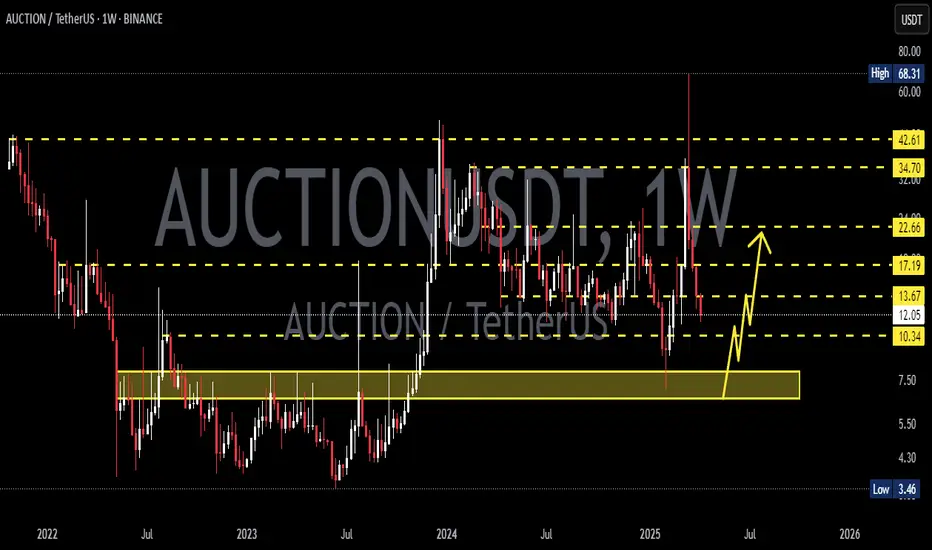
AUCTIONUSDT 1WAUCTION ~ 1W Analysis
#AUCTION Buy back when testing this support with a short -term target of at least 20%+.
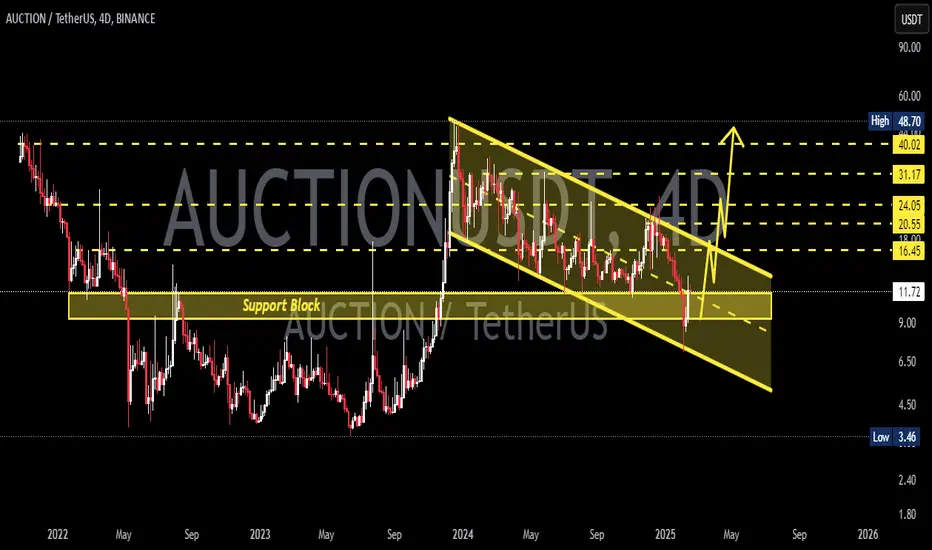
AUCTIONUSDT 4DAUCTION ~ 4D Analysis
#AUCTION This trade is at high risk. But if you still have a Conviction on this coin,. Maybe this support you can consider to start buying again.
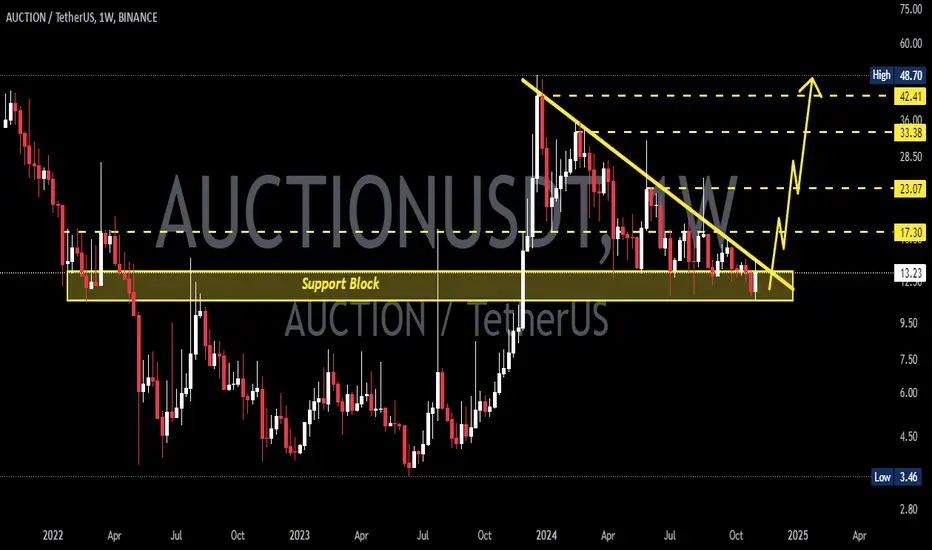
AUCTIONUSDTAUCTION ~ 1W
#AUCTION Retest this support block. if you have Conviction on this coin,. This support block would be a good buying place for now,. with a minimum target of 20%++
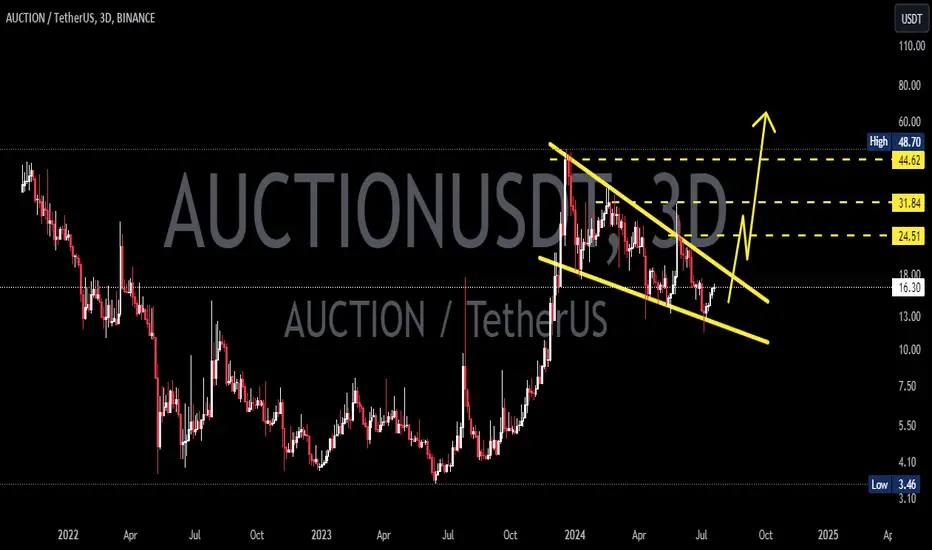
AUCTIONUSDT 3DAUCTION ~ 3D
#AUCTION This is a bullish pattern, it is only a matter of time until this resistance line is broken.
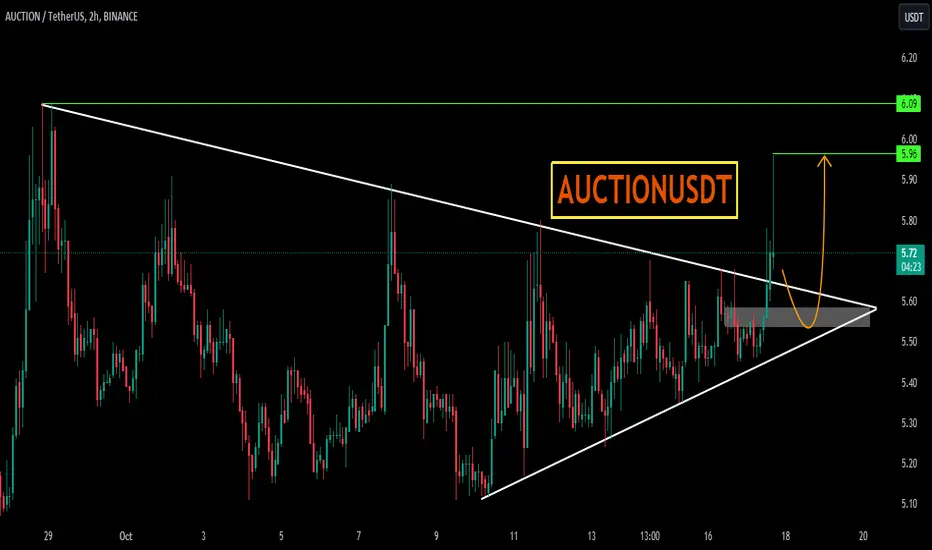
AUCTIONUSDTAUCTIONUSDT is trading in symmetrical triangle pattern. The price is reacting well the support and resistance of triangle.
Currently the price has given the breakout of triangle and now retesting the broken level where it is also forming a local support zone and seems like the price may go for another leg higher.
If the breakout sustain to upside the optimum target could be 5.9 followed by 6
What you guys think of this idea?