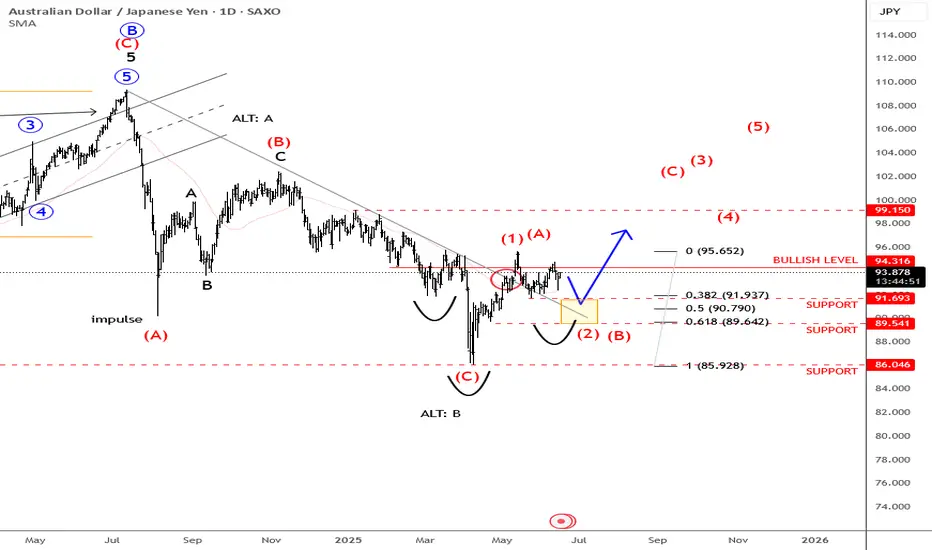
AUDNZD Trading Opportunity! SELL!
My dear followers,
This is my opinion on the AUDNZD next move:
The asset is approaching an important pivot point 1.0786
Bias - Bearish
Technical Indicators: Supper Trend generates a clear short signal while Pivot Point HL is currently determining the overall Bearish trend of the market.
Goal - 1.0770
About Used Indicators:
For more efficient signals, super-trend is used in combination with other indicators like Pivot Points.
Disclosure: I am part of Trade Nation's Influencer program and receive a monthly fee for using their TradingView charts in my analysis.
———————————
WISH YOU ALL LUCK
AUD (Australian Dollar)
SHORT ON AUD/JPYAUD/JPY has given us a choc (change of character) from up to down at a major resistance zone.
I will be selling AUD/JPY to the next demand level looking to catch 100-200 pips
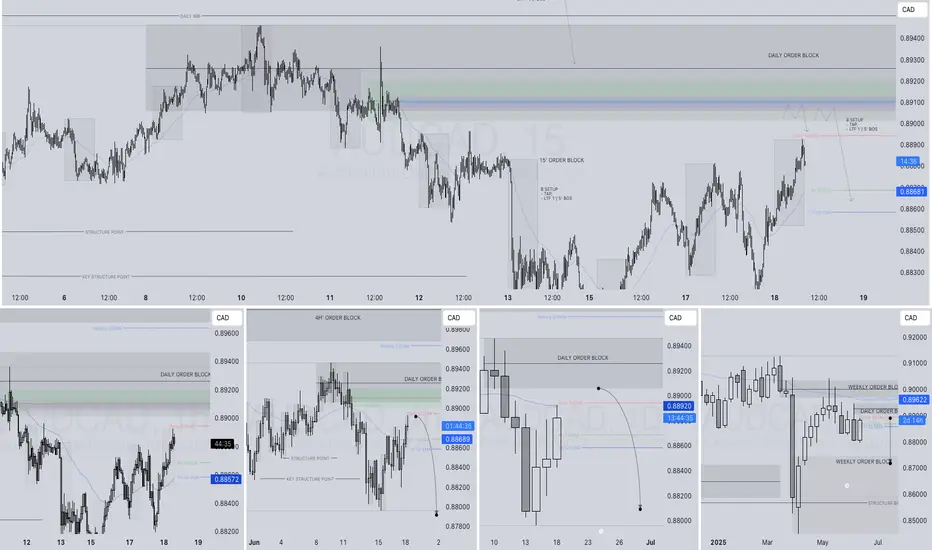
AUDCAD SHORT FORECAST Q2 W25 D18 Y25AUDCAD SHORT FORECAST Q2 W25 D18 Y25
Professional Risk Managers👋
Welcome back to another FRGNT chart update📈
Diving into some Forex setups using predominantly higher time frame order blocks alongside intraday confirmation breaks of structure.
💡Here are some trade confluences📝
✅Weekly 50 EMA
✅Weekly order block rejection
✅Daily order block rejection
✅15’ order block identification
🔑 Remember, to participate in trading comes always with a degree of risk, therefore as professional risk managers it remains vital that we stick to our risk management plan as well as our trading strategies.
📈The rest, we leave to the balance of probabilities.
💡Fail to plan. Plan to fail.
🏆It has always been that simple.
❤️Good luck with your trading journey, I shall see you at the very top.
🎯Trade consistent, FRGNT X
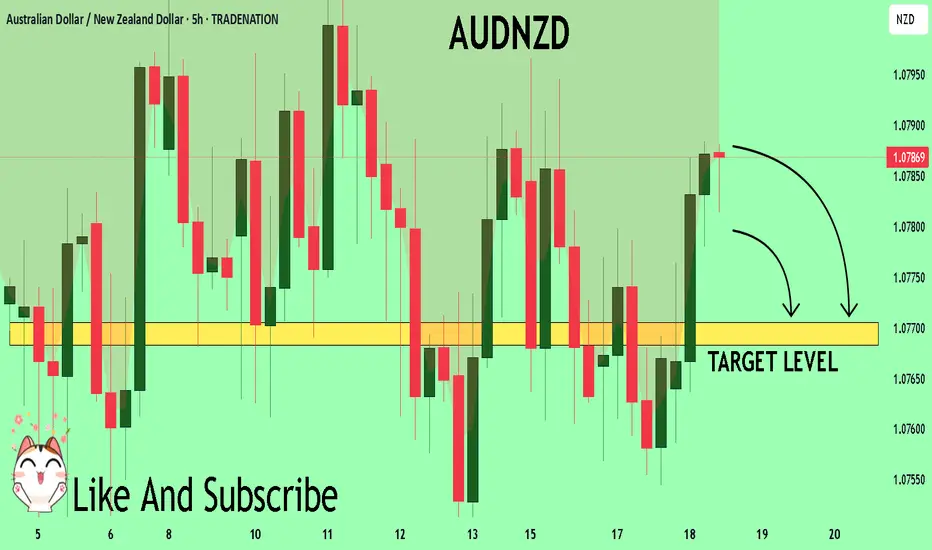
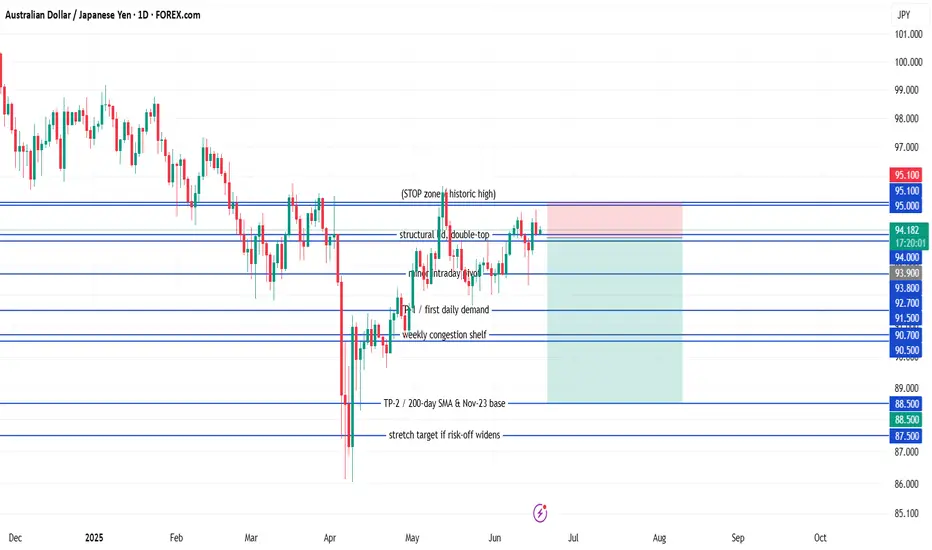
AUD/JPY ShortSell-limit (primary) 93.90 — front-runs the twin highs at 94.00 (May and again last week).
Stop-loss 95.10 — just above the 2024 YTD peak and round-number 95; if price closes above, the breakout is real.
Take-profit 1 91.50 — first daily support shelf; locks ~240 pips (≈ 1.6 R) and is often the first bounce zone.
Take-profit 2 88.50 — November-2023 base / 200-day SMA; full mean-reversion target (~540 pips, ≈ 3.6 R).
Filter to keep order Only leave the order active while the daily candle closes ≥ 93.80 (shows the lid is still respected).
GTC Cancel the order if unfilled after 5 trading days; reassess next week.
Quick rationale
Fundamentals: RBA leaning dovish; JPY could firm on BoJ hawkish hints & intervention risk.
Technical: Double-top near 94; bearish RSI divergence on daily; room down to 91s/88s.
Risk-reward: 120-pip risk vs. 240 / 540-pip reward = 1.6 R and 3.6 R pay-offs.
Place the limit, set the filter alert on daily closes, and let the trade come to you—no need to babysit intraday moves.
AUD-CHF Bullish Bias! Buy!
Hello,Traders!
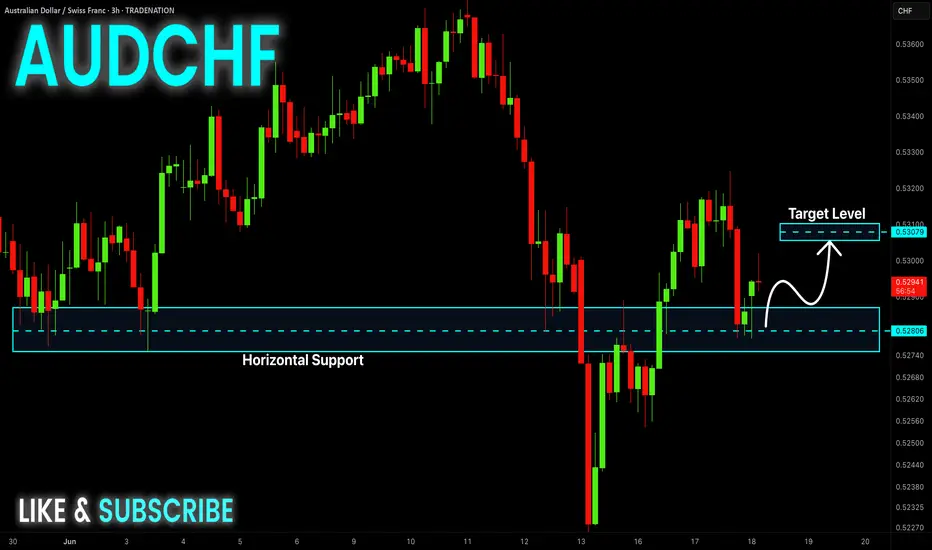
AUD-CHF is trading in an
Uptrend and the pair made
A bullish breakout of the
Key horizontal level of 0.5280
Which is now a support and
Went up sharply then made a
Retest of the new support level
And we are already seeing a
Bullish rebound so we are
Bullish biased and we wil
Be expecting a further
Bullish move up
Buy!
Comment and subscribe to help us grow!
Check out other forecasts below too!
Disclosure: I am part of Trade Nation's Influencer program and receive a monthly fee for using their TradingView charts in my analysis.
GBPAUD: Bullish Continuation & Long Trade
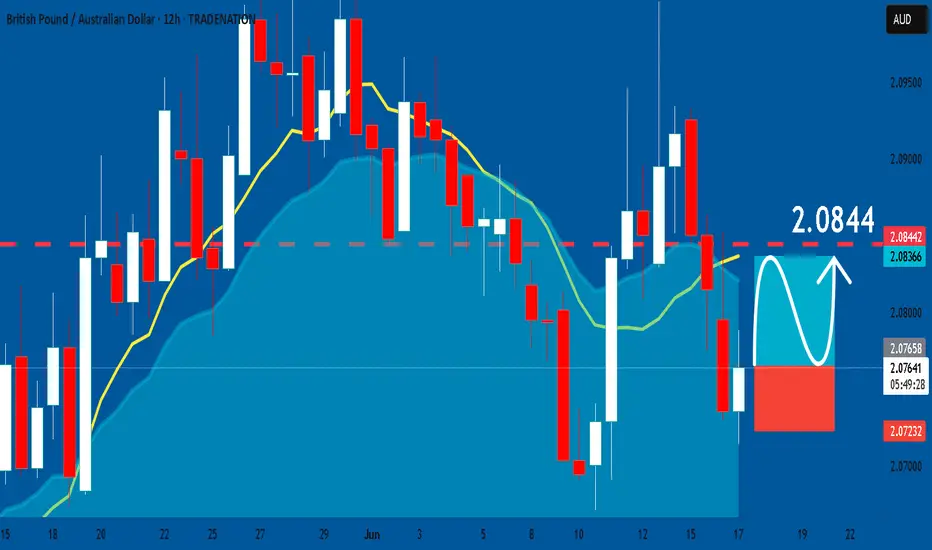
GBPAUD
- Classic bullish formation
- Our team expects growth
SUGGESTED TRADE:
Swing Trade
Buy GBPAUD
Entry Level - 2.0766
Sl - 2.0723
Tp - 2.0844
Our Risk - 1%
Start protection of your profits from lower levels
Disclosure: I am part of Trade Nation's Influencer program and receive a monthly fee for using their TradingView charts in my analysis.
❤️ Please, support our work with like & comment! ❤️
AUDJPY Will Go Higher! Buy!
Here is our detailed technical review for AUDJPY.
Time Frame: 6h
Current Trend: Bullish
Sentiment: Oversold (based on 7-period RSI)
Forecast: Bullish
The market is approaching a significant support area 94.496.
The underlined horizontal cluster clearly indicates a highly probable bullish movement with target 95.595 level.
P.S
The term oversold refers to a condition where an asset has traded lower in price and has the potential for a price bounce.
Overbought refers to market scenarios where the instrument is traded considerably higher than its fair value. Overvaluation is caused by market sentiments when there is positive news.
Disclosure: I am part of Trade Nation's Influencer program and receive a monthly fee for using their TradingView charts in my analysis.
Like and subscribe and comment my ideas if you enjoy them!

GBPAUD Will Go Up! Long!
Take a look at our analysis for GBPAUD.
Time Frame: 2h
Current Trend: Bullish
Sentiment: Oversold (based on 7-period RSI)
Forecast: Bullish
The market is on a crucial zone of demand 2.074.
The oversold market condition in a combination with key structure gives us a relatively strong bullish signal with goal 2.083 level.
P.S
We determine oversold/overbought condition with RSI indicator.
When it drops below 30 - the market is considered to be oversold.
When it bounces above 70 - the market is considered to be overbought.
Disclosure: I am part of Trade Nation's Influencer program and receive a monthly fee for using their TradingView charts in my analysis.
Like and subscribe and comment my ideas if you enjoy them!

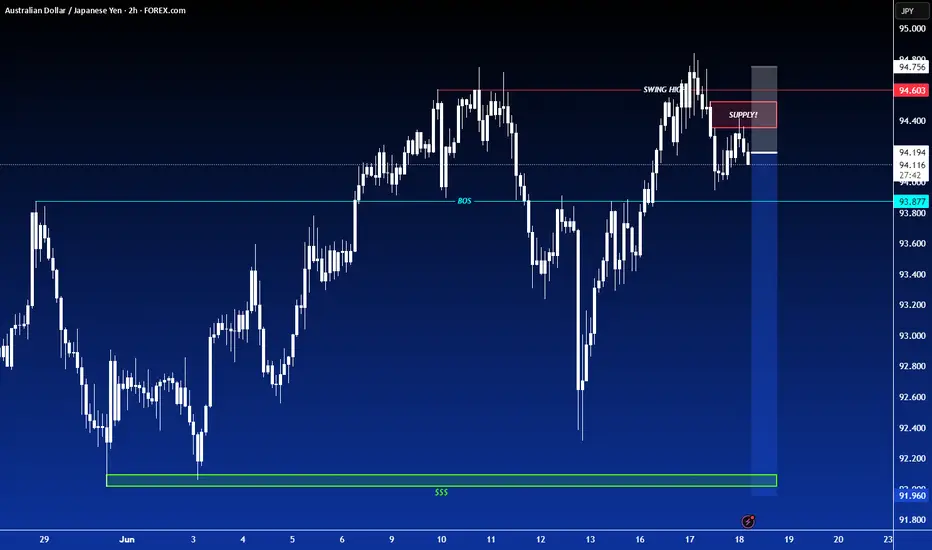
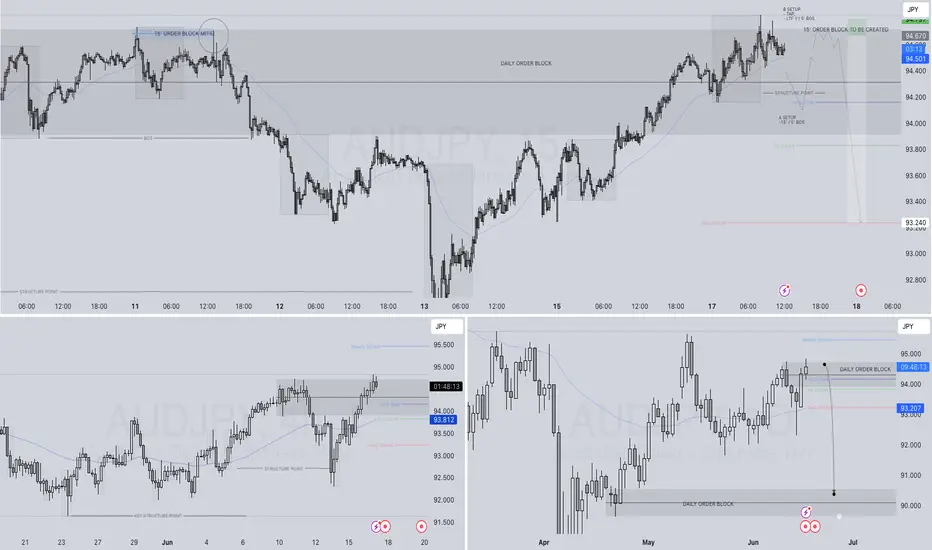
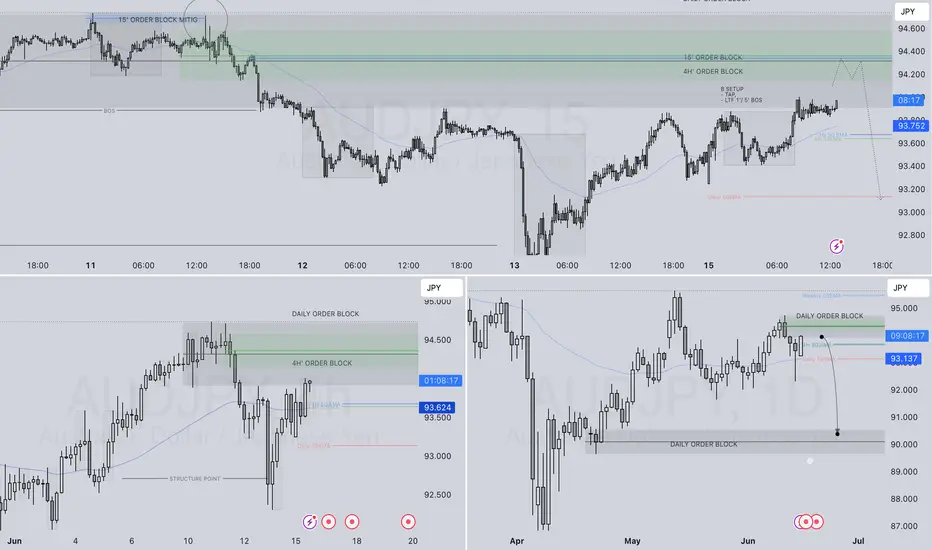
AUDJPY SHORT FORECAST Q2 W25 D17 Y25AUDJPY SHORT FORECAST Q2 W25 D17 Y25
Professional Risk Managers👋
Welcome back to another FRGNT chart update📈
Diving into some Forex setups using predominantly higher time frame order blocks alongside confirmation breaks of structure.
Let’s see what price action is telling us today! 👀
💡Here are some trade confluences📝
✅Weekly Order block rejection
✅15' Order block
✅Daily order block identified
🔑 Remember, to participate in trading comes always with a degree of risk, therefore as professional risk managers it remains vital that we stick to our risk management plan as well as our trading strategies.
📈The rest, we leave to the balance of probabilities.
💡Fail to plan. Plan to fail.
🏆It has always been that simple.
❤️Good luck with your trading journey, I shall see you at the very top.
🎯Trade consistent, FRGNT X
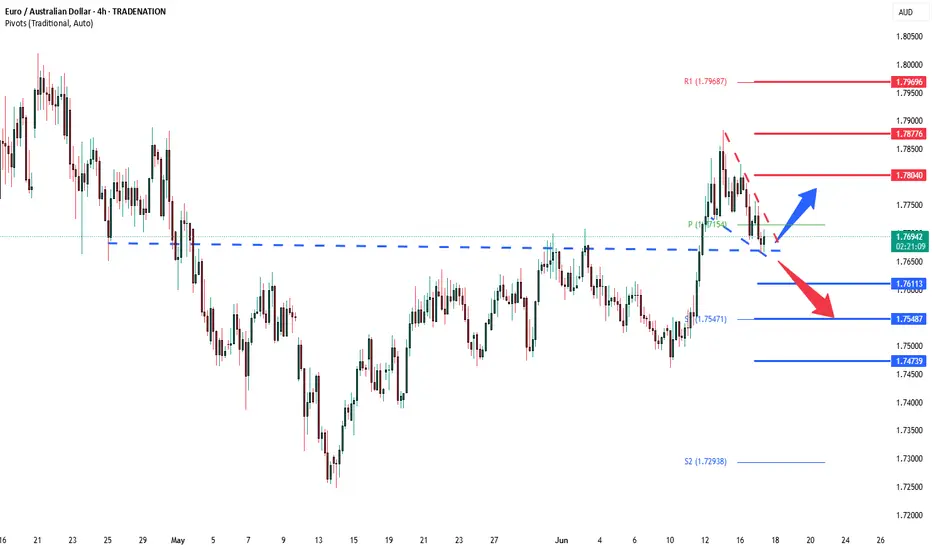
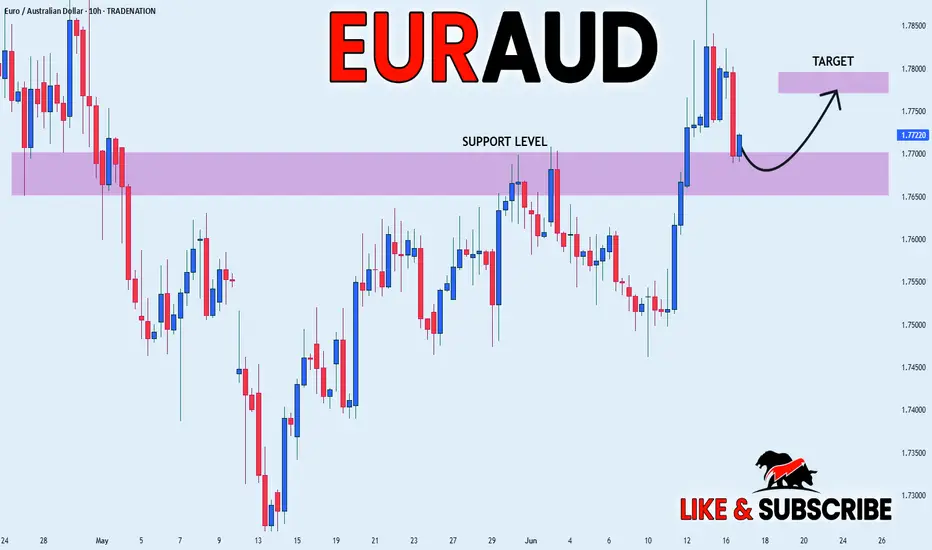
EURAUD breakout level retest at 1.7660Trend Overview:
EURAUD is currently exhibiting a bullish trend, with recent price action reflecting a retest of former resistance (now acting as support)—a classic bullish continuation pattern.
Key Support Level:
1.7660 – A pivotal zone representing the previous consolidation area. This level now serves as key support and a decision point for the next directional move.
Bullish Scenario (Primary Bias):
A corrective pullback to the 1.7660 area followed by a bullish bounce would signal trend continuation.
Upside targets are:
1.7800 – Near-term resistance.
1.7880 – Mid-term target aligned with prior highs.
1.7970 – Long-term resistance zone.
Bearish Scenario (Invalidation):
A confirmed break and daily close below 1.7660 would invalidate the current bullish bias.
This would open the door for further downside toward:
1.7610 – Initial retracement support.
1.7550 – Deeper pullback level within a broader range.
Conclusion:
EURAUD remains bullishly biased, supported by both structure and momentum. The 1.7660 level is crucial—holding this level would maintain the upside potential toward 1.7970. However, a decisive break below it would signal weakness and increase the likelihood of a deeper retracement.
This communication is for informational purposes only and should not be viewed as any form of recommendation as to a particular course of action or as investment advice. It is not intended as an offer or solicitation for the purchase or sale of any financial instrument or as an official confirmation of any transaction. Opinions, estimates and assumptions expressed herein are made as of the date of this communication and are subject to change without notice. This communication has been prepared based upon information, including market prices, data and other information, believed to be reliable; however, Trade Nation does not warrant its completeness or accuracy. All market prices and market data contained in or attached to this communication are indicative and subject to change without notice.
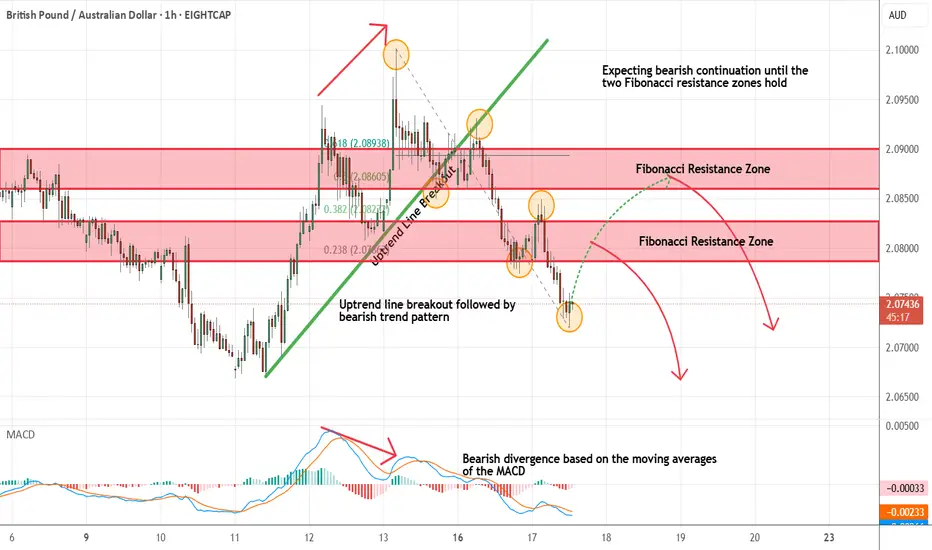
GBPAUD - Expecting Bearish Continuation In The Short TermM15 - Bearish divergence followed by the most recent uptrend line breakout.
Clean bearish trend with the price creating series of lower highs, lower lows.
No opposite signs.
Expecting further continuation lower until the two Fibonacci resistance zones hold.
If you enjoy this idea, don’t forget to LIKE 👍, FOLLOW ✅, SHARE 🙌, and COMMENT ✍! Drop your thoughts and charts below to keep the discussion going. Your support helps keep this content free and reach more people! 🚀
--------------------------------------------------------------------------------------------------------------------
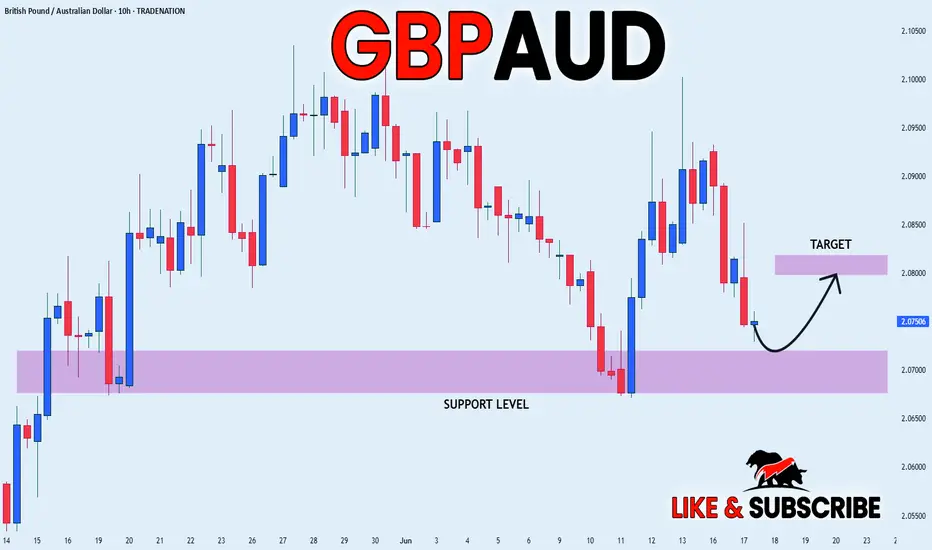
GBP_AUD LONG FROM SUPPORT|
✅GBP_AUD will soon retest a key support level of 2.0700
So I think that the pair will make a rebound
And go up to retest the supply level above at 2.0800
LONG🚀
✅Like and subscribe to never miss a new idea!✅
Disclosure: I am part of Trade Nation's Influencer program and receive a monthly fee for using their TradingView charts in my analysis.
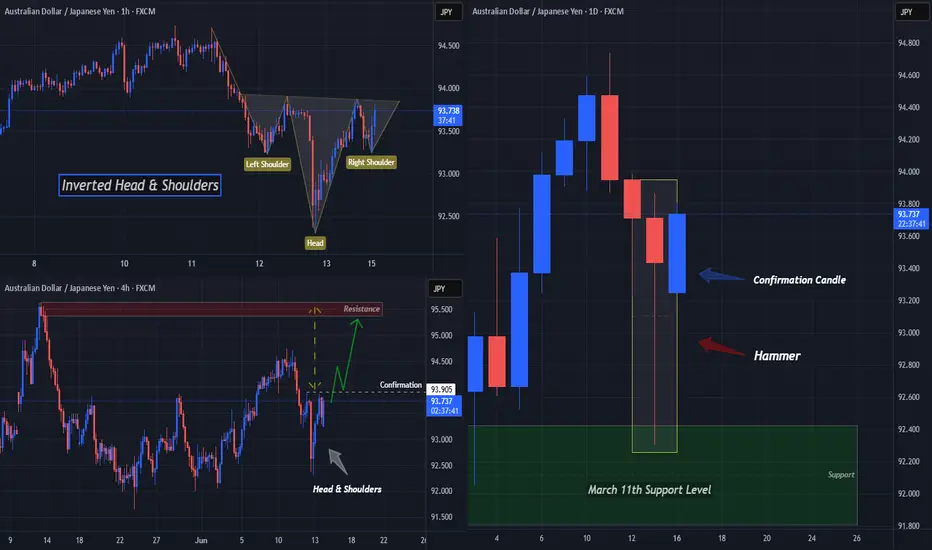
Could BOJ's "HOLD" on Rates Turn AUDJPY "On Its Head"?Here I have a Multi-Timeframe analysis on OANDA:AUDJPY which is giving multiple signs of Higher Prices potentially to come!!
First on the Daily we can see that Price formed a Hammer Candle after testing the March 11th Support Zone and as the next Daily candle forms (Today), we are already seeing a Bullish Confirmation candle begin!
*Bullish Engulfing would be a textbook Confirmation Candle!
Now zooming into the 4Hr / 1 Hr Charts, this Hammer is formed by what looks to be a very Strong Reversal Pattern, the Inverted Head and Shoulders!
Now we are still waiting for the Confirmation of the Pattern where Price needs to rise to the "Neckline" or Resistance Level.
Once Confirmed, we will look for a Breakout of the Pattern and if Validated, could deliver great Long Opportunities as a Breakout and Retest of the Inverted Head and Shoulders Pattern!
If the Pattern is Successful, we could expect the Price Target to be at the next level of Resistance being the 95.3 - 95.6 Area!
Fundamentally, the BOJ begins the week with Policy Rate decision Monday evening where they forecast a HOLD on Interest Rates, staying at .5%. This could have drastic implications on the JPY, potentially weakening it.
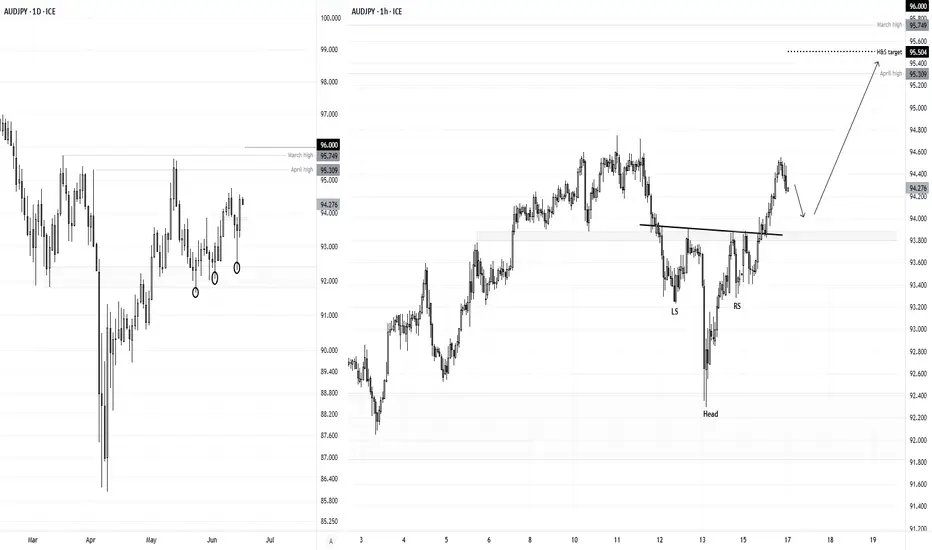
AUD/JPY Bulls Eye 95+ After Bullish ReversalAUD/JPY bounced sharply on Thursday, snapping a 3-day losing streak with a solid bullish-range session. The rally kicked off from a bullish pinbar above 92, where the higher low reinforces support and the broader bullish case.
The 1-hour chart shows a clean breakout from an inverted head and shoulders pattern, pointing to a target around 95.50. With resistance at the April high (95.30), March high (95.75), and the 96 handle, there’s still room for bulls to run.
Dips toward 94 may offer opportunities to join the trend — but a break back below the neckline would shift the tone back to risk-off.
Matt Simpson, Market Analyst at City Index and Forex.com
EUR_AUD WILL GROW|LONG|
✅EUR_AUD went down to retest
A horizontal support of 1.7572
Which makes me locally bullish biased
And I think that a move up
From the level is to be expected
Towards the target above at 1.7800
LONG🚀
✅Like and subscribe to never miss a new idea!✅
Disclosure: I am part of Trade Nation's Influencer program and receive a monthly fee for using their TradingView charts in my analysis.
AUDJPY Potential UpsidesHey Traders, in today's trading session we are monitoring AUDJPY for a buying opportunity around 93.600 zone, AUDJPY is trading in an uptrend and currently is in a correction phase in which it is approaching the trend at 93.600 support and resistance area.
Trade safe, Joe.

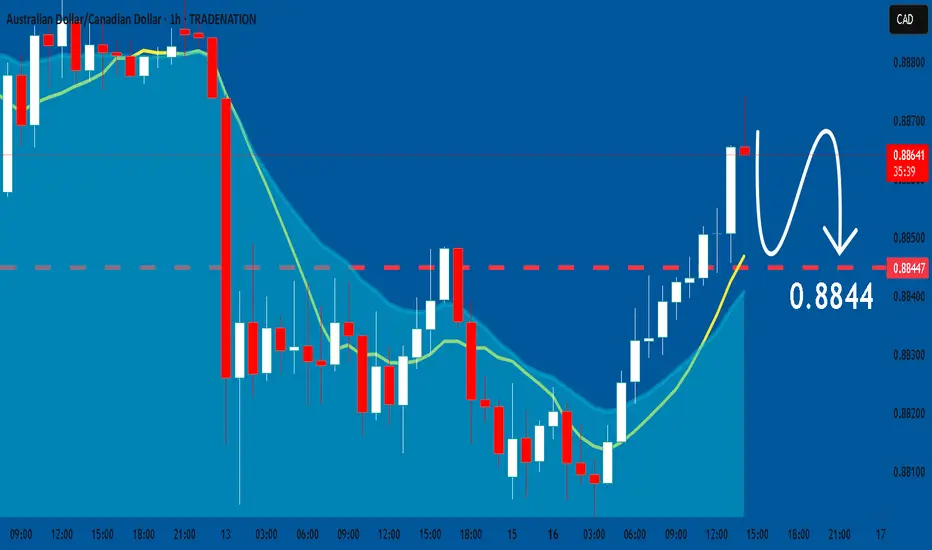
AUDCAD: Will Start Falling! Here is Why:
Looking at the chart of AUDCAD right now we are seeing some interesting price action on the lower timeframes. Thus a local move down seems to be quite likely.
Disclosure: I am part of Trade Nation's Influencer program and receive a monthly fee for using their TradingView charts in my analysis.
❤️ Please, support our work with like & comment! ❤️
AUDJPY SHORT FORECAST Q2 W25 D16 Y25AUDJPY SHORT FORECAST Q2 W25 D16 Y25
Professional Risk Managers👋
Welcome back to another FRGNT chart update📈
Diving into some Forex setups using predominantly higher time frame order blocks alongside confirmation breaks of structure.
Let’s see what price action is telling us today! 👀
💡Here are some trade confluences📝
✅Weekly Order block rejection
✅15' Order block
✅Daily order block identified
🔑 Remember, to participate in trading comes always with a degree of risk, therefore as professional risk managers it remains vital that we stick to our risk management plan as well as our trading strategies.
📈The rest, we leave to the balance of probabilities.
💡Fail to plan. Plan to fail.
🏆It has always been that simple.
❤️Good luck with your trading journey, I shall see you at the very top.
🎯Trade consistent, FRGNT X
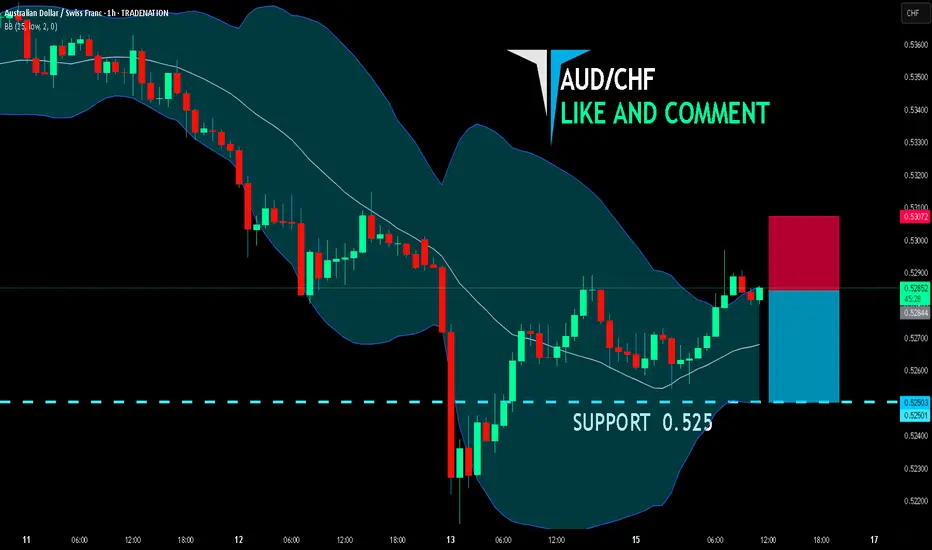
AUD/CHF SENDS CLEAR BEARISH SIGNALS|SHORT
AUD/CHF SIGNAL
Trade Direction: short
Entry Level: 0.528
Target Level: 0.525
Stop Loss: 0.530
RISK PROFILE
Risk level: medium
Suggested risk: 1%
Timeframe: 1h
Disclosure: I am part of Trade Nation's Influencer program and receive a monthly fee for using their TradingView charts in my analysis.
✅LIKE AND COMMENT MY IDEAS✅
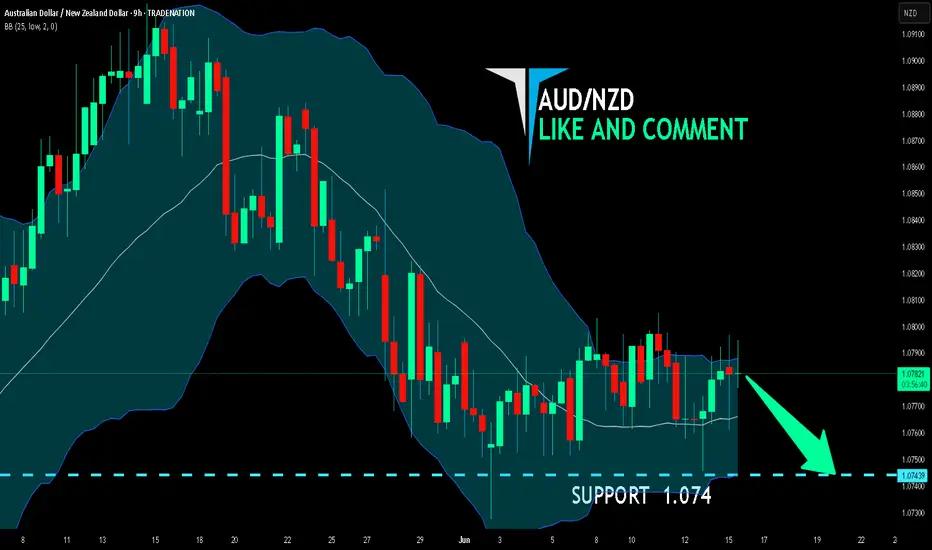
AUD/NZD SELLERS WILL DOMINATE THE MARKET|SHORT
Hello, Friends!
Bearish trend on AUD/NZD, defined by the red colour of the last week candle combined with the fact the pair is overbought based on the BB upper band proximity, makes me expect a bearish rebound from the resistance line above and a retest of the local target below at 1.074.
Disclosure: I am part of Trade Nation's Influencer program and receive a monthly fee for using their TradingView charts in my analysis.
✅LIKE AND COMMENT MY IDEAS✅
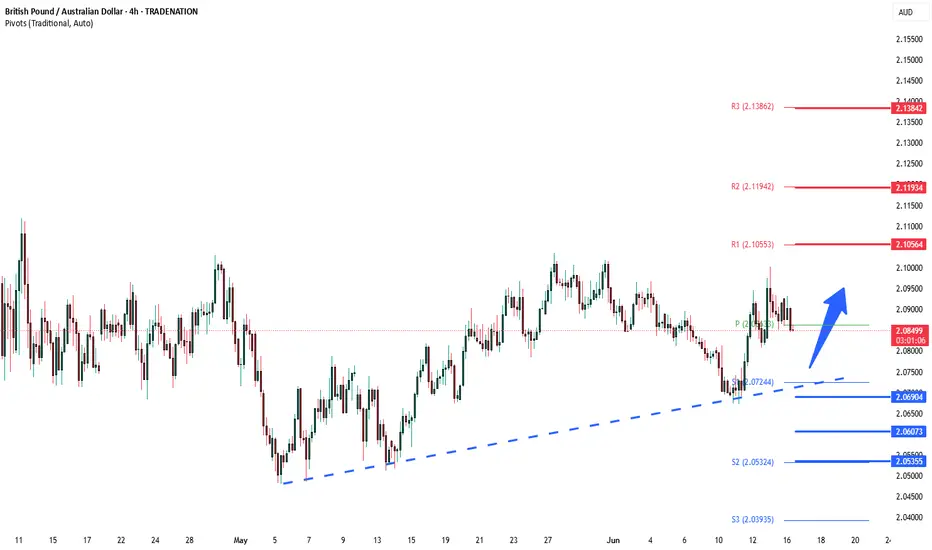
GBPAUD INTRADAY uptrend supported at 2.0690Trend Overview:
The GBPAUD currency price remains in a bullish trend, characterised by higher highs and higher lows. The recent intraday price action is forming a continuation consolidation pattern, suggesting a potential pause before a renewed move higher.
Key Technical Levels:
Support: 2.0690 (primary pivot), followed by 2.0600 and 2.0535
Resistance: 2.1056 (initial), then 2.1190 and 2.1384
Technical Outlook:
A pullback to the 2.0690 level, which aligns with the previous consolidation zone, could act as a platform for renewed buying interest. A confirmed bounce from this support may trigger a continuation toward the next resistance levels at 2.1056, 2.1190, and ultimately 2.1384.
Conversely, a daily close below 2.0690 would suggest weakening bullish momentum. This scenario would shift the bias to bearish in the short term, potentially targeting 2.0600 and 2.0535 as downside levels.
Conclusion:
GBPAUD maintains a bullish structure while trading above the 2.0690 support. A bounce from this level would validate the consolidation as a continuation pattern, with upside potential toward the 2.1056 area. A breakdown below 2.0690, however, would invalidate this view and suggest deeper corrective risk.
This communication is for informational purposes only and should not be viewed as any form of recommendation as to a particular course of action or as investment advice. It is not intended as an offer or solicitation for the purchase or sale of any financial instrument or as an official confirmation of any transaction. Opinions, estimates and assumptions expressed herein are made as of the date of this communication and are subject to change without notice. This communication has been prepared based upon information, including market prices, data and other information, believed to be reliable; however, Trade Nation does not warrant its completeness or accuracy. All market prices and market data contained in or attached to this communication are indicative and subject to change without notice.
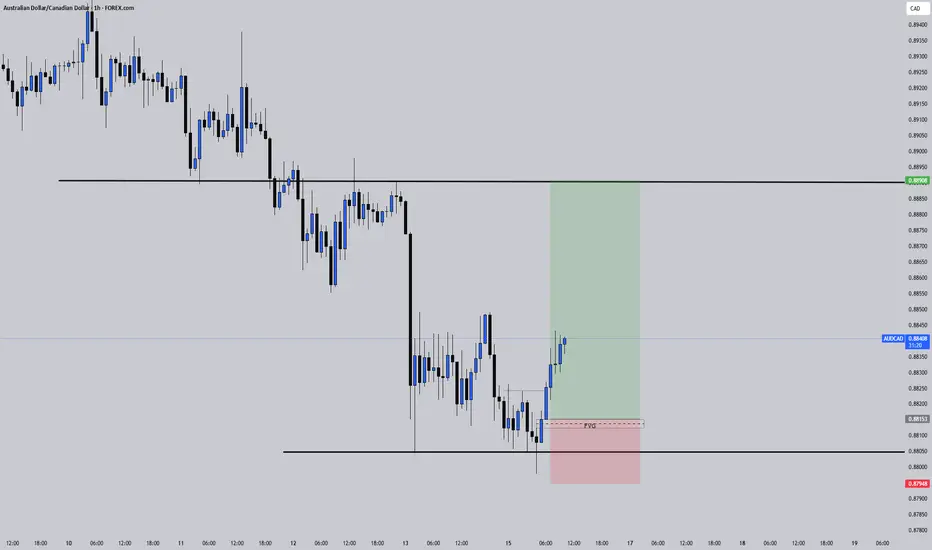
AUDCAD: The Real Move Happens After the TrapNot every trade needs to be flashy.
This one was clean. Simple. Intentional.
And it came after most traders got taken out.
What I Saw :
Price swept PDL: textbook sell-side liquidity.
But instead of jumping in too early, I waited.
Why?
Because I’ve learned something:
👉 The first reaction is often just noise.
👉 The second one, the one that fills into structure. That’s where clarity lives.
My Entry Logic:
After the sweep, price broke minor structure. That was my Change of Character. I will just have to wait for price to pull into the FVG below 50% fibs retracement. Stop below the low. Target at the PDH.
Nothing fancy. Just discipline .
Psychology Check:
I’ve taken this setup before and watched it run without me. Why? Because I used to hesitate. I wanted more confirmation… or feared being wrong.
But here’s the truth:
Your edge is only real if you’re willing to take the shot when it appears .
This wasn’t a guess.
It was system + structure + emotional control.
AUDJPY Forming A Bullish Set-upAUDJPY is recovering very nicely after touching the 86 support level, which goes back to the 2023 low. That was clearly an important zone from there we’ve seen a sharp and impulsive bounce in the last two months, even breaking above the trendline resistance connected down from the 2024 highs. This breakout suggests that bulls may be back in control and could still drive the pair toward the 98–100 area later this year. If we get a retracement in the near term, keep an eye on the 91.70 - 90.00 zone as potential support.
GH