AUD-CHF Local Long! Buy!
Hello,Traders!
AUD-CHF made a bullish
Breakout of the key horizontal
Level of 0.5221 which is now a
Support and the pair is going down
To retest the level from where
We will be expecting a
Further bullish move up
Buy!
Comment and subscribe to help us grow!
Check out other forecasts below too!
Disclosure: I am part of Trade Nation's Influencer program and receive a monthly fee for using their TradingView charts in my analysis.
AUD (Australian Dollar)

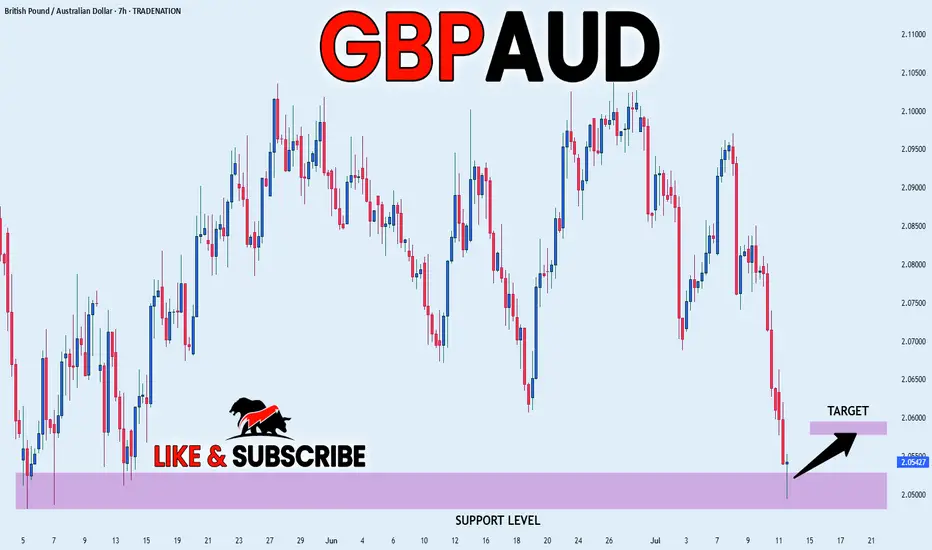
GBP_AUD LONG FROM SUPPORT|
✅GBP_AUD fell down sharply
But a strong support level was hit at 2.0500
Thus I am expecting a rebound
And a move up towards the target of 2.0580
LONG🚀
✅Like and subscribe to never miss a new idea!✅
Disclosure: I am part of Trade Nation's Influencer program and receive a monthly fee for using their TradingView charts in my analysis.
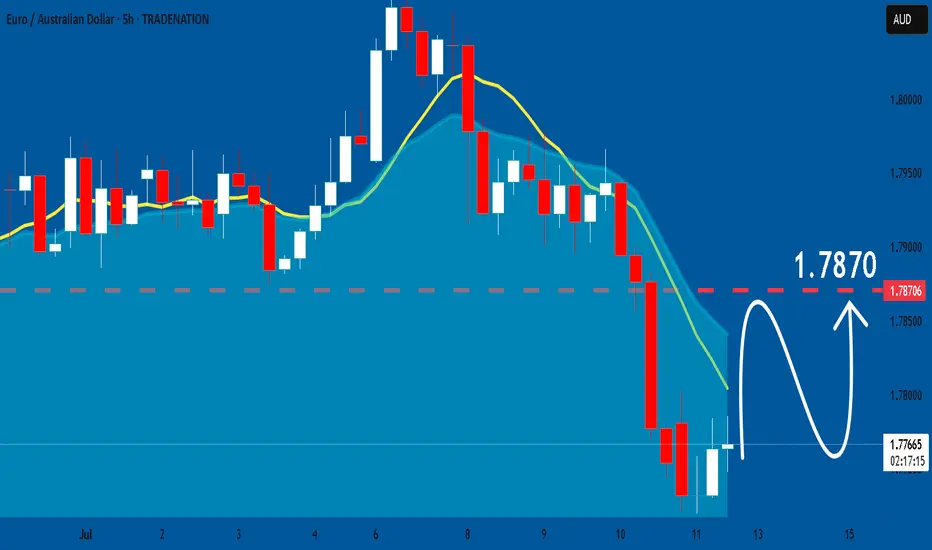
EURAUD: Expecting Bullish Movement! Here is Why:
It is essential that we apply multitimeframe technical analysis and there is no better example of why that is the case than the current EURAUD chart which, if analyzed properly, clearly points in the upward direction.
Disclosure: I am part of Trade Nation's Influencer program and receive a monthly fee for using their TradingView charts in my analysis.
❤️ Please, support our work with like & comment! ❤️
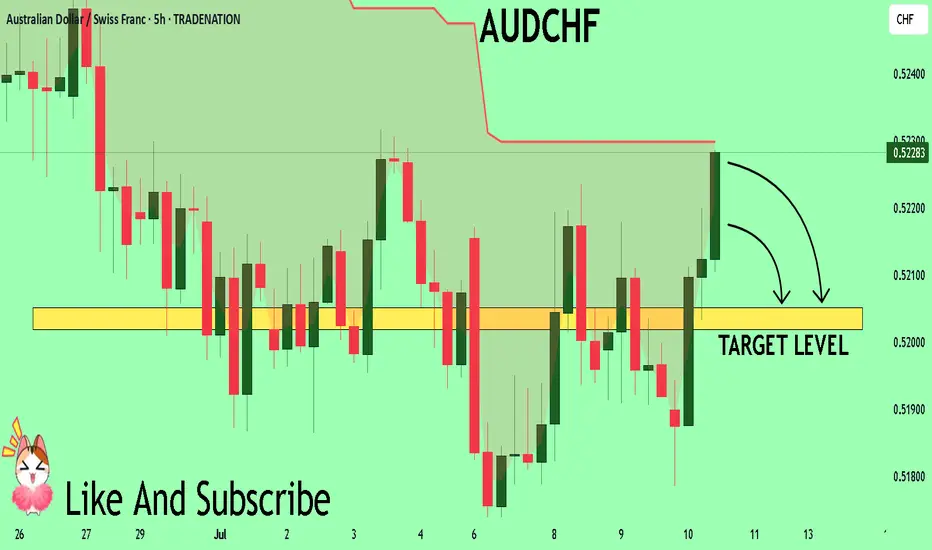
AUD/CHF BEST PLACE TO SELL FROM|SHORT
AUD/CHF SIGNAL
Trade Direction: short
Entry Level: 0.524
Target Level: 0.520
Stop Loss: 0.526
RISK PROFILE
Risk level: medium
Suggested risk: 1%
Timeframe: 3h
Disclosure: I am part of Trade Nation's Influencer program and receive a monthly fee for using their TradingView charts in my analysis.
✅LIKE AND COMMENT MY IDEAS✅

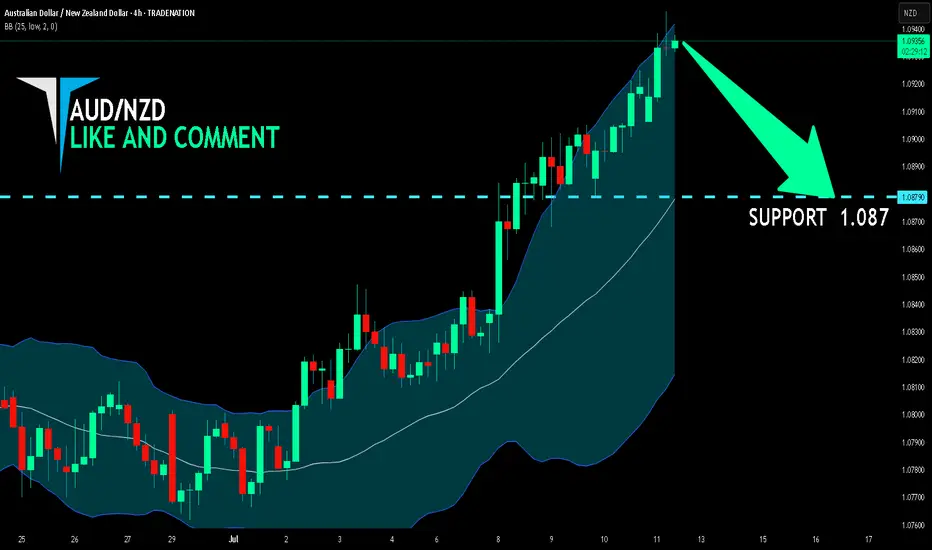
AUD/NZD SHORT FROM RESISTANCE
Hello, Friends!
AUD/NZD pair is in the downtrend because previous week’s candle is red, while the price is clearly rising on the 4H timeframe. And after the retest of the resistance line above I believe we will see a move down towards the target below at 1.087 because the pair is overbought due to its proximity to the upper BB band and a bearish correction is likely.
Disclosure: I am part of Trade Nation's Influencer program and receive a monthly fee for using their TradingView charts in my analysis.
✅LIKE AND COMMENT MY IDEAS✅
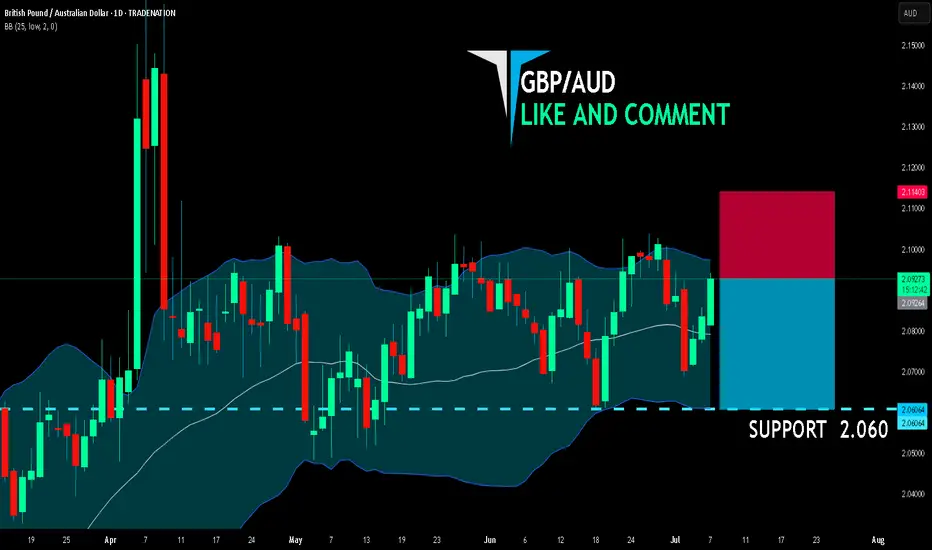
GBP/AUD BEARS ARE STRONG HERE|SHORT
GBP/AUD SIGNAL
Trade Direction: short
Entry Level: 2.092
Target Level: 2.060
Stop Loss: 2.114
RISK PROFILE
Risk level: medium
Suggested risk: 1%
Timeframe: 1D
Disclosure: I am part of Trade Nation's Influencer program and receive a monthly fee for using their TradingView charts in my analysis.
✅LIKE AND COMMENT MY IDEAS✅
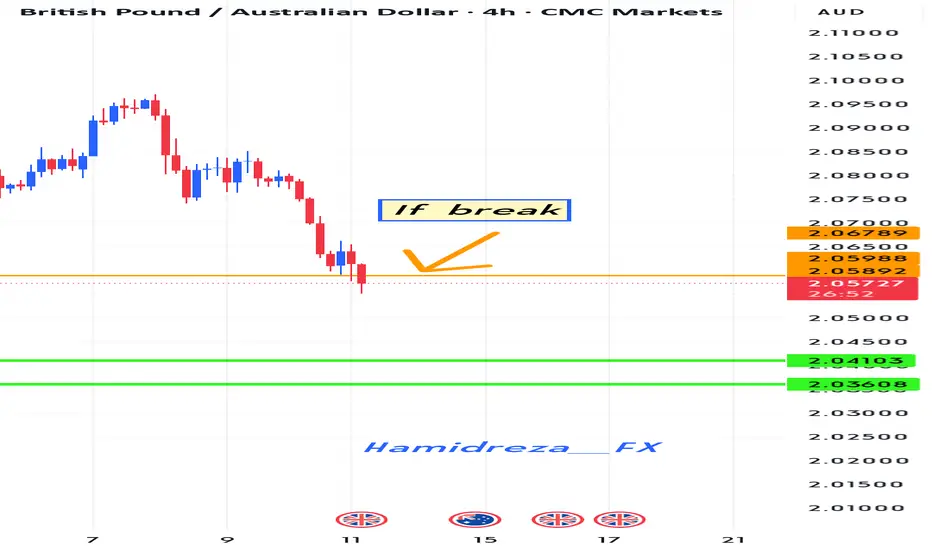
Is the currency GBPAUD depreciating?
Hi dears
I think that if the colored trend line is broken, the downtrend will probably continue until it reaches the target.
Thank you for supporting me by liking, commenting, and subscribing.
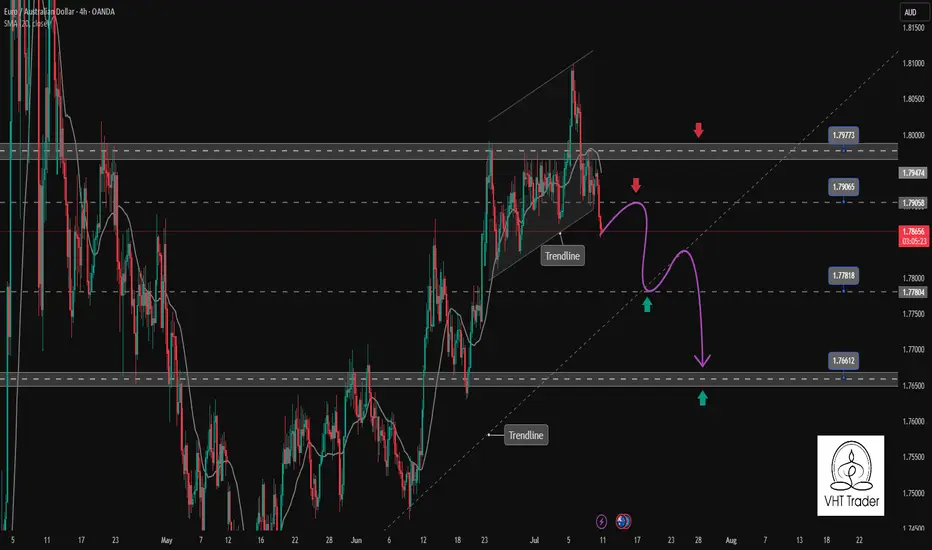
EURAUD confirms the continuation of the bearish correction trendEURAUD has just broken the rising channel to start a downtrend. The confirmation is there with the h4 candle closing completely below the support zone of the Price Channel. This corrective downtrend can now extend to the support of 1.766. The support zone is a Break point at the moment 1.778 is a positive DCA point with a SELL Entry above.
Support: 1.778-1.766
Resistance: 1.790-1.797
Sell now: Resistance zone 1.79000
Target: 1.778 Support zone, followed by 1.766 lower zone
Sell Trigger: Break below 1.778
BUY Trigger: rejection 1.778 Support zone
Leave your comments on the idea. I am happy to read your views.
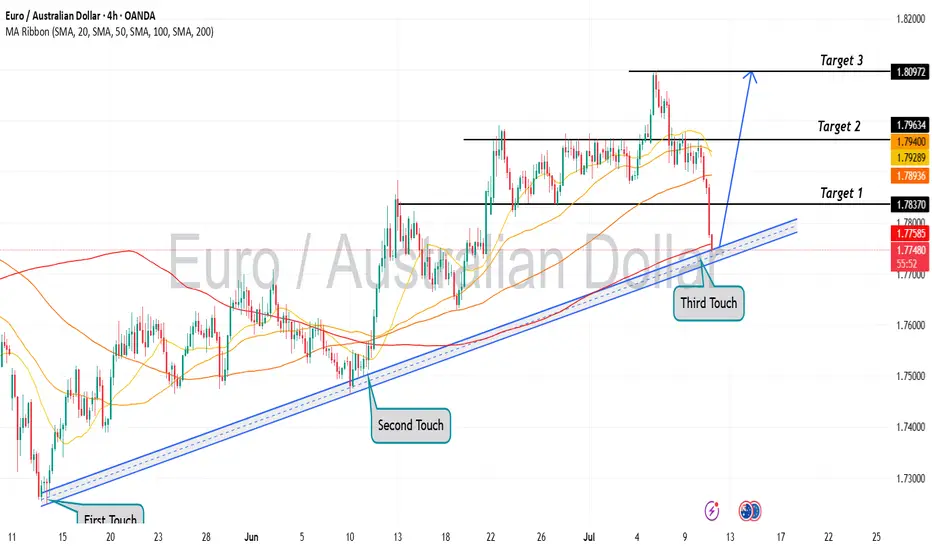
EURUAD is in the Buy direction from the Third Touch Hello Traders
In This Chart EUR/AUD 4 HOURLY Forex Forecast By FOREX PLANET
today EUR/AUD analysis 👆
🟢This Chart includes_ (EUR/AUD market update)
🟢What is The Next Opportunity on EUR/AUD Market
🟢how to Enter to the Valid Entry With Assurance Profit
This CHART is For Trader's that Want to Improve Their Technical Analysis Skills and Their Trading By Understanding How To Analyze The Market Using Multiple Timeframes and Understanding The Bigger Picture on the Charts
AUD_CAD WILL KEEP GROWING|LONG|
✅AUD_CAD is going up
Now and the pair made a bullish
Breakout of the key horizontal
Level of 0.8980 and the breakout
Is confirmed so we are bullish
Biased and we will be expecting
A further bullish move up
LONG🚀
✅Like and subscribe to never miss a new idea!✅
Disclosure: I am part of Trade Nation's Influencer program and receive a monthly fee for using their TradingView charts in my analysis.

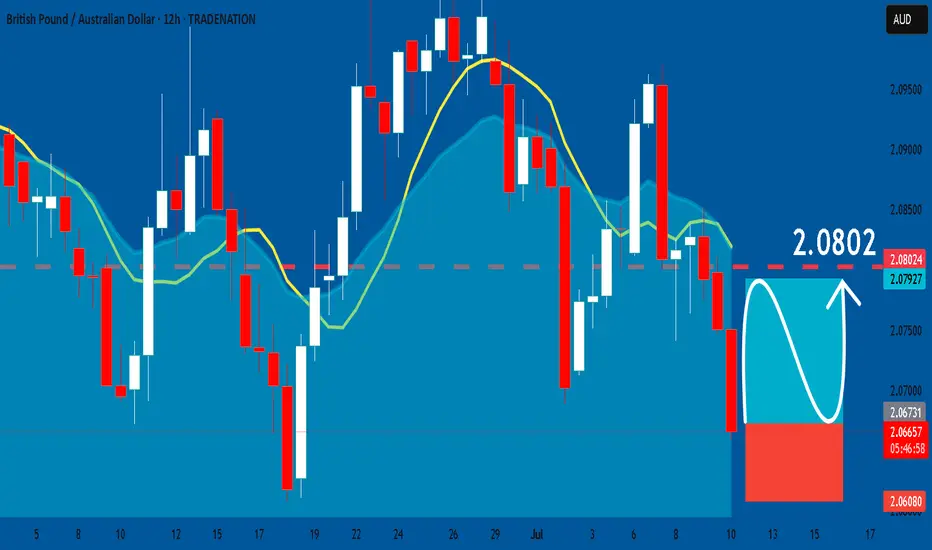
GBPAUD: Long Trade Explained
GBPAUD
- Classic bullish formation
- Our team expects growth
SUGGESTED TRADE:
Swing Trade
Buy GBPAUD
Entry Level - 2.0672
Sl - 2.0608
Tp - 2.0802
Our Risk - 1%
Start protection of your profits from lower levels
Disclosure: I am part of Trade Nation's Influencer program and receive a monthly fee for using their TradingView charts in my analysis.
❤️ Please, support our work with like & comment! ❤️
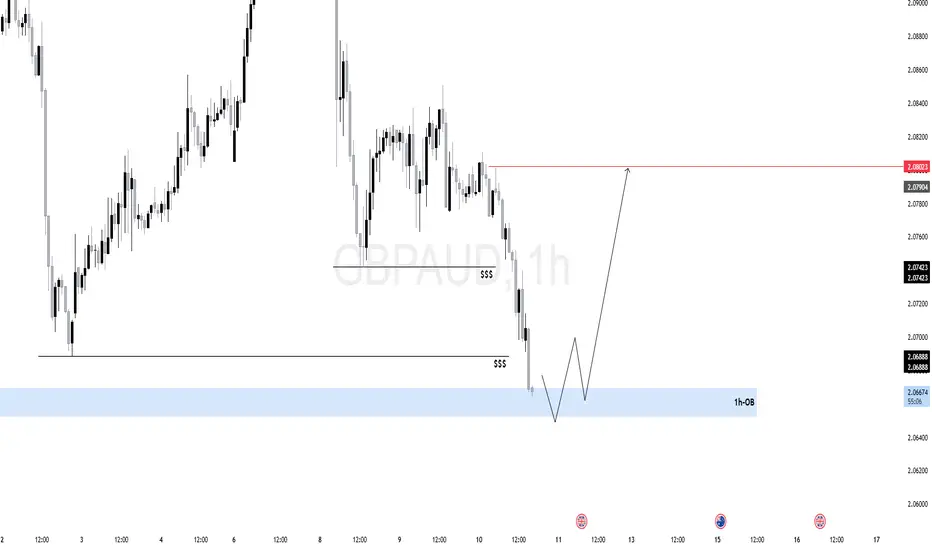
$GA (GBPAUD) 1HIf price holds and reacts from the OB, expect a short-term bullish leg toward:
Internal liquidity first (2.07400), Then external buy-side liquidity above 2.08000.
Price has been in a clear bearish structure, printing lower highs and lower lows.
Recently, price swept multiple layers of internal liquidity (marked as $$$) before tapping into a key Order Block (OB) just above the 2.06500 zone.
The OB zone aligns with a higher timeframe demand area, suggesting this could be a reaccumulation phase.
The OB zone has previously led to strong expansions, making it a valid area for institutional re-entry.
The current liquidity grab beneath the previous lows appears intentional — a trap for breakout sellers.
Smart money often waits for such sweeps to absorb sell-side liquidity before shifting the structure.
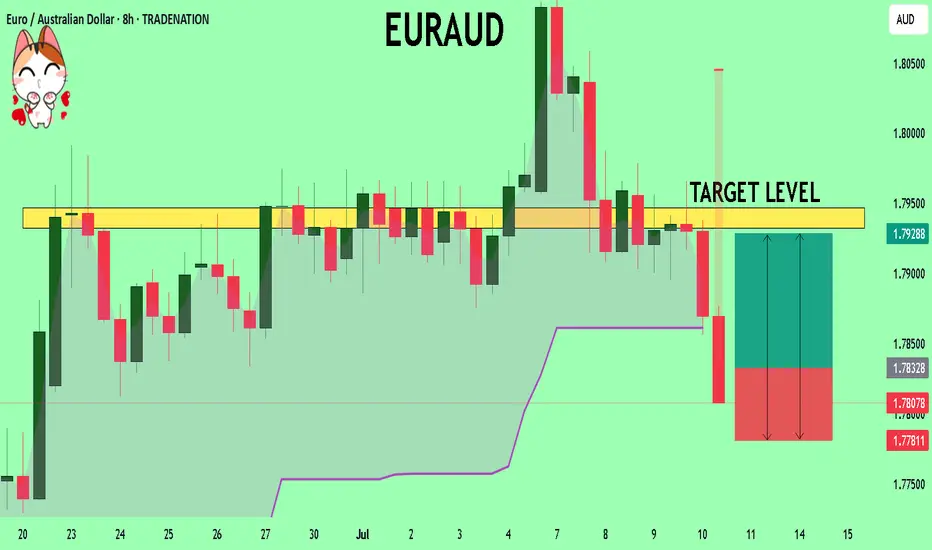
EURAUD Set To Grow! BUY!
My dear followers,
This is my opinion on the EURAUD next move:
The asset is approaching an important pivot point 1.7833
Bias - Bullish
Safe Stop Loss - 1.7781
Technical Indicators: Supper Trend generates a clear long signal while Pivot Point HL is currently determining the overall Bullish trend of the market.
Goal - 1.7932
About Used Indicators:
For more efficient signals, super-trend is used in combination with other indicators like Pivot Points.
Disclosure: I am part of Trade Nation's Influencer program and receive a monthly fee for using their TradingView charts in my analysis.
———————————
WISH YOU ALL LUCK
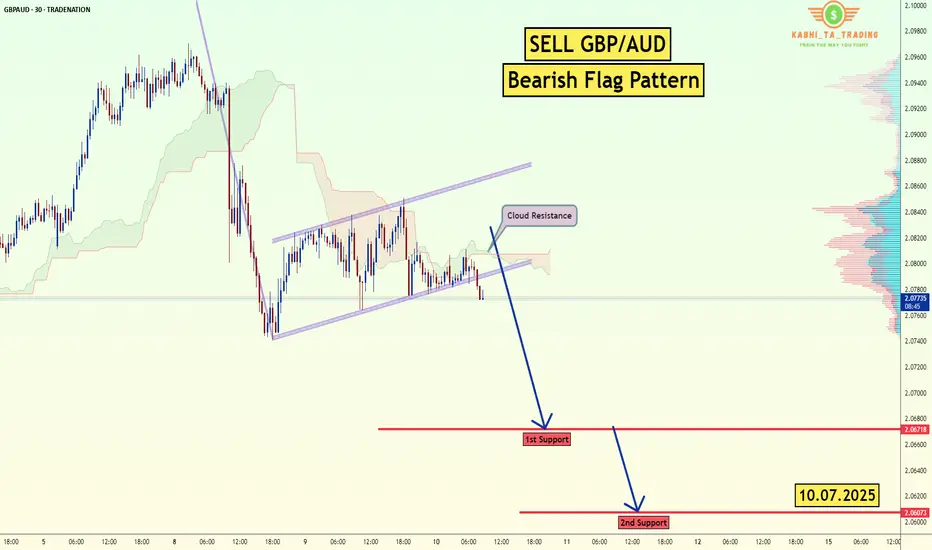
GBP/AUD - Bearish Flag (10.07.2025)The GBP/AUD Pair on the M30 timeframe presents a Potential Selling Opportunity due to a recent Formation of a Bearish Flag Pattern. This suggests a shift in momentum towards the downside in the coming hours.
Possible Short Trade:
Entry: Consider Entering A Short Position around Trendline Of The Pattern.
Target Levels:
1st Support – 2.0671
2nd Support – 2.0607
🎁 Please hit the like button and
🎁 Leave a comment to support for My Post !
Your likes and comments are incredibly motivating and will encourage me to share more analysis with you.
Best Regards, KABHI_TA_TRADING
Thank you.
Disclosure: I am part of Trade Nation's Influencer program and receive a monthly fee for using their TradingView charts in my analysis.
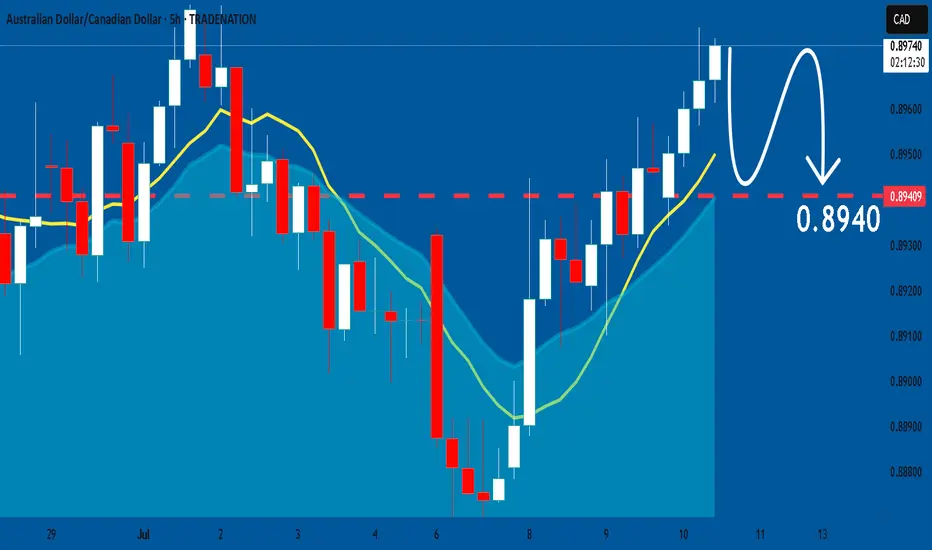
AUDCAD: Weak Market & Bearish Continuation
The recent price action on the AUDCAD pair was keeping me on the fence, however, my bias is slowly but surely changing into the bearish one and I think we will see the price go down.
Disclosure: I am part of Trade Nation's Influencer program and receive a monthly fee for using their TradingView charts in my analysis.
❤️ Please, support our work with like & comment! ❤️
AUDCHF Technical Analysis! SELL!
My dear subscribers,
My technical analysis for AUDCHF is below:
The price is coiling around a solid key level - 0.5226
Bias - Bearish
Technical Indicators: Pivot Points Low anticipates a potential price reversal.
Super trend shows a clear sell, giving a perfect indicators' convergence.
Goal - 0.5205
About Used Indicators:
By the very nature of the supertrend indicator, it offers firm support and resistance levels for traders to enter and exit trades. Additionally, it also provides signals for setting stop losses
Disclosure: I am part of Trade Nation's Influencer program and receive a monthly fee for using their TradingView charts in my analysis.
———————————
WISH YOU ALL LUCK
AUDCHF; Heikin Ashi Trade IdeaOANDA:AUDCHF
In this video, I’ll be sharing my analysis of AUDCHF, using FXAN's proprietary algo indicators with my unique Heikin Ashi strategy. I’ll walk you through the reasoning behind my trade setup and highlight key areas where I’m anticipating potential opportunities.
I’m always happy to receive any feedback.
Like, share and comment! ❤️
Thank you for watching my videos! 🙏

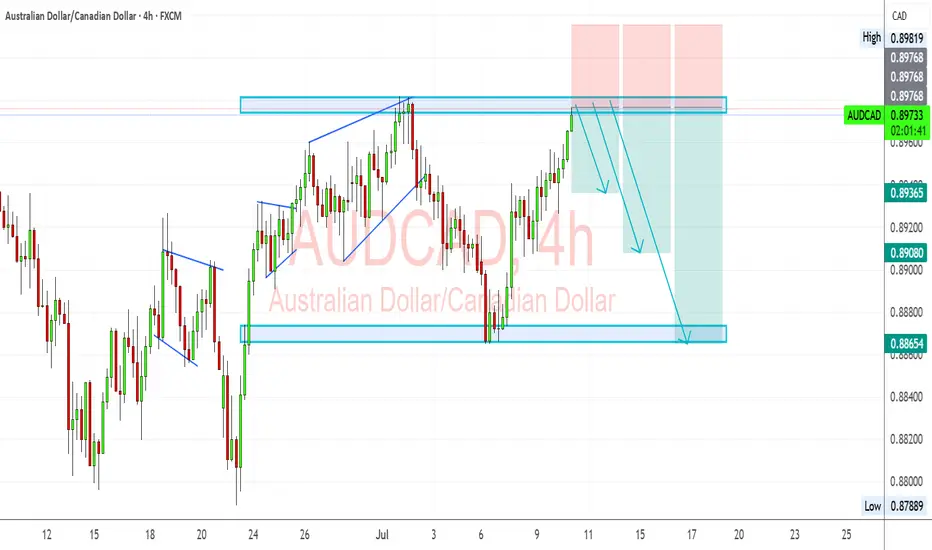
AUDCAD – Bearish Rejection at Key Resistance ZoneAUDCAD is showing signs of weakness near the 0.8980 supply zone after an extended rally. The pair is now reacting to a historically respected resistance area, with bearish momentum building as exhaustion sets in.
🔍 Technical Outlook:
✅ Price rejected at multi-touch resistance around 0.8980
📐 Clean bearish structure forming after wedge-like exhaustion
📉 Expecting a move down toward:
TP1: 0.89365 – recent minor structure
TP2: 0.89080 – key demand zone from early July
TP3: 0.88654 – full measured target from range
📛 Invalidation above: 0.8985
🌍 Fundamental Breakdown:
🇦🇺 Australia:
📉 Softening inflation and retail sales
🏦 RBA cautious with limited appetite for further hikes
🇨🇳 Weak Chinese demand adds pressure on AUD
🇨🇦 Canada:
💪 Supported by rising oil prices and solid employment data
🏦 BoC remains vigilant on inflation, though on hold
🛢️ Strong WTI prices continue to support CAD
⚠️ Risks to the Bearish View:
⚡ Unexpectedly strong China data could boost AUD
📉 Sudden drop in oil prices would hurt CAD
🗣️ Surprise hawkish shift from RBA
🔗 Correlation & Flow:
AUDCAD is a lagging asset, heavily influenced by WTI crude (boosting CAD) and China-linked risk flows (affecting AUD).
Keep an eye on AUDUSD and USDCAD for early signals.
📆 Upcoming Key Events:
🇦🇺 RBA Minutes, Jobs Data, Wages Index
🇨🇦 BoC Business Outlook, CPI Print
🛢️ US Oil Inventories (affects CAD)
🧭 Summary:
🔻 Bias: Bearish
📊 Drivers: Oil strength, RBA caution, CAD resilience
⚠️ Risk: China rebound or oil correction
🕵️ Watch: Canadian CPI + Australian jobs data
📉 Likely to Follow: Oil and AUDUSD/USDCAD macro trends
AUDJPY SHORT FORECAST Q3 D10 W28 Y25AUDJPY SHORT FORECAST Q3 D10 W28 Y25
Professional Risk Managers👋
Welcome back to another FRGNT chart update📈
Diving into some Forex setups using predominantly higher time frame order blocks alongside confirmation breaks of structure.
Let’s see what price action is telling us today! 👀
🔑 Remember, to participate in trading comes always with a degree of risk, therefore as professional risk managers it remains vital that we stick to our risk management plan as well as our trading strategies.
📈The rest, we leave to the balance of probabilities.
💡Fail to plan. Plan to fail.
🏆It has always been that simple.
❤️Good luck with your trading journey, I shall see you at the very top.
🎯Trade consistent, FRGNT X
AUDCAD SHORT DAILY FORECAST Q3 D10 W28 Y25AUDCAD SHORT DAILY FORECAST Q3 D10 W28 Y25
Professional Risk Managers👋
Welcome back to another FRGNT chart update📈
Diving into some Forex setups using predominantly higher time frame order blocks alongside confirmation breaks of structure.
Let’s see what price action is telling us today! 👀
💡Here are some trade confluences📝
✅Daily Order block identified
✅4H Order Block identified
✅1H Order Block identified
🔑 Remember, to participate in trading comes always with a degree of risk, therefore as professional risk managers it remains vital that we stick to our risk management plan as well as our trading strategies.
📈The rest, we leave to the balance of probabilities.
💡Fail to plan. Plan to fail.
🏆It has always been that simple.
❤️Good luck with your trading journey, I shall see you at the very top.
🎯Trade consistent, FRGNT X

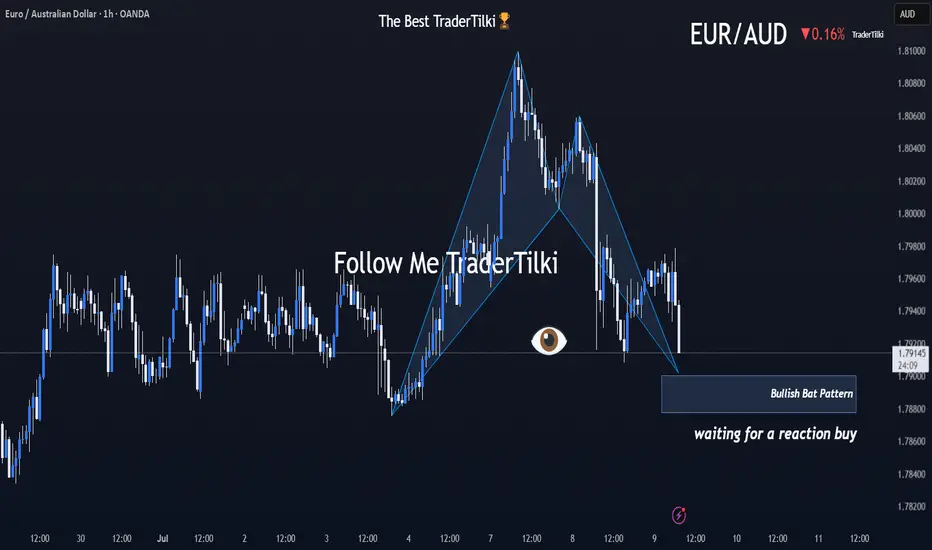
Brace Yourselves: EURAUD’s Harmonic Storm Is Coming!Good morning, Traders ☀️
I've identified a bullish harmonic Bat pattern on the EURAUD pair.
At this stage, I'm only anticipating a reactional buy from the marked zone.
I'll determine my target level after observing the market's response from that area.
📌 I’ll be sharing the target details under this post once the reaction unfolds.
Your likes and support are what keep me motivated to share these analyses consistently.
Huge thanks to everyone who shows love and appreciation! 🙏
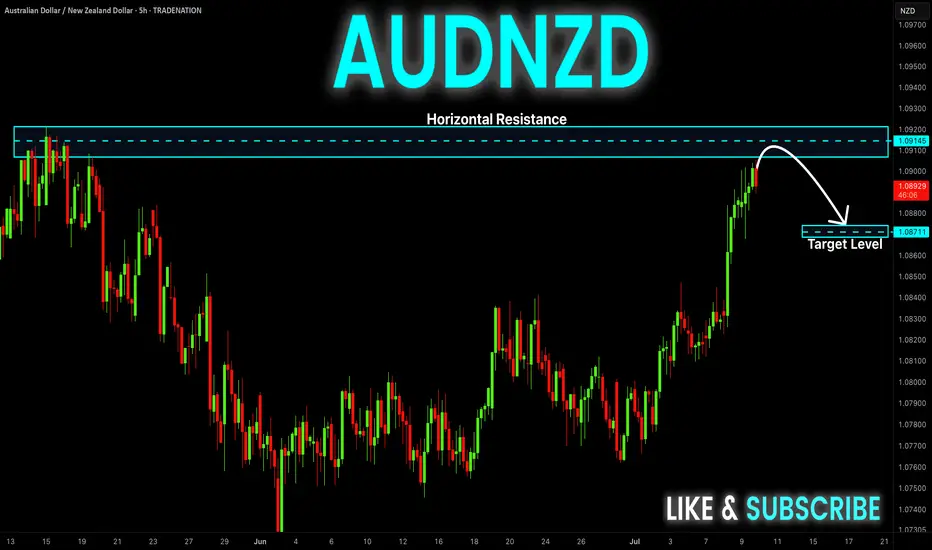
AUD-NZD Short From Resistance! Sell!
Hello,Traders!
AUD-NZD keeps growing
And the pair is overbought
So after it hits the horizontal
Resistance of 1.0921 from
Where we will be expecting
A local bearish correction
Sell!
Comment and subscribe to help us grow!
Check out other forecasts below too!
Disclosure: I am part of Trade Nation's Influencer program and receive a monthly fee for using their TradingView charts in my analysis.
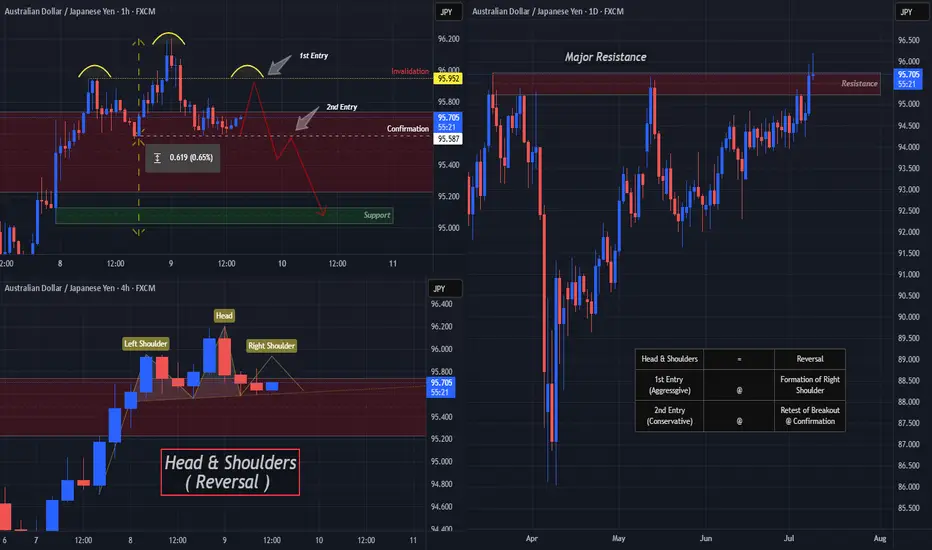
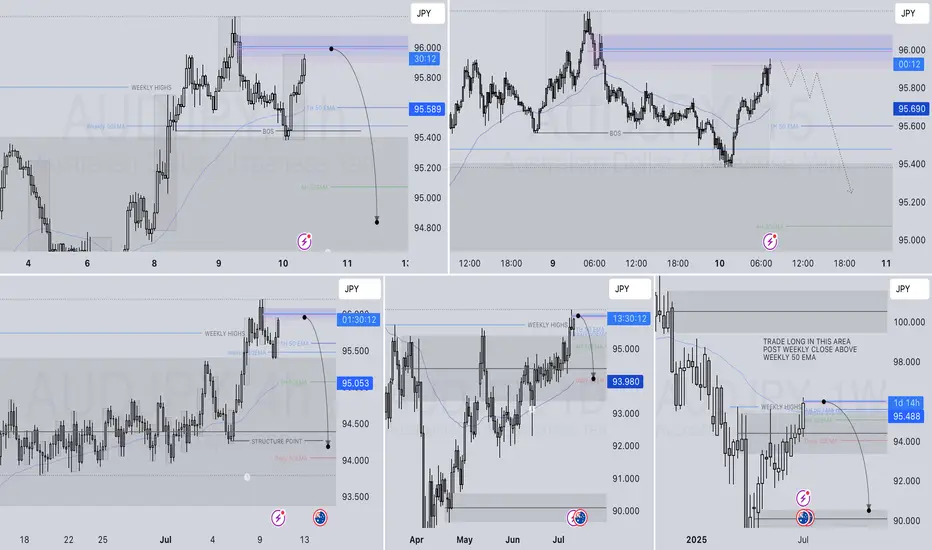
AUDJPY Ready To "Drop A Shoulder"? Multi-Timeframe May Help!OANDA:AUDJPY is beginning to form a very convincingly strong Reversal Pattern, the Head & Shoulders!
Starting with the Daily Chart we can see that Price is Forming a Doji Candle just after trying to Breakout of a Major Resistance Zone created from the Highs of March 18th and if Price is unable to close above this level, this strengthens the Bearish and Reversal Bias.
Now the 4 Hr Chart shows both the "First Shoulder" or Previous Higher High that was surpassed by the "Head" which is the New Higher High, has formed quite quickly with a slightly Ascending "Neckline" or Support Line where Bulls were able to make their Last Stand.
With a Reversal Pattern, you want to see a Change in Trend, in this case, would be a Lower High then that of the Higher High or "Head" @ 96.204.
*If Bulls are able to Push Price above the "Left Shoulder" or Previous Higher High @ 95.952, this will Invalidate the Head & Shoulders Set-up!
**If Bulls are unable to Break Above 95.952 and Price is pushed back down to the Confirmation or "Neckline" for a 3rd time, this Confirms the Head & Shoulders Set-up!!
Based on the Distance between the Head and Neckline, we can project a potential drop down to the next Support Level as a Price Target @ 95.00 once:
1) Pattern is Confirmed
2) Breakout is Validated