GBPAUD SELL/SHORTBy utilizing levels, historical patterns, , we can formulate a hypothesis that the market might follow a similar trajectory if bearish sentiment prevails.
AUD (Australian Dollar)

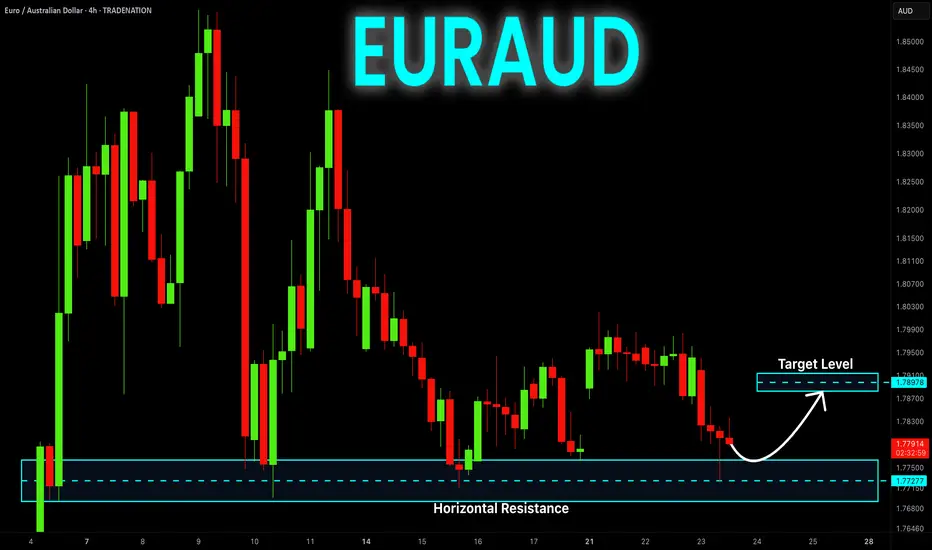
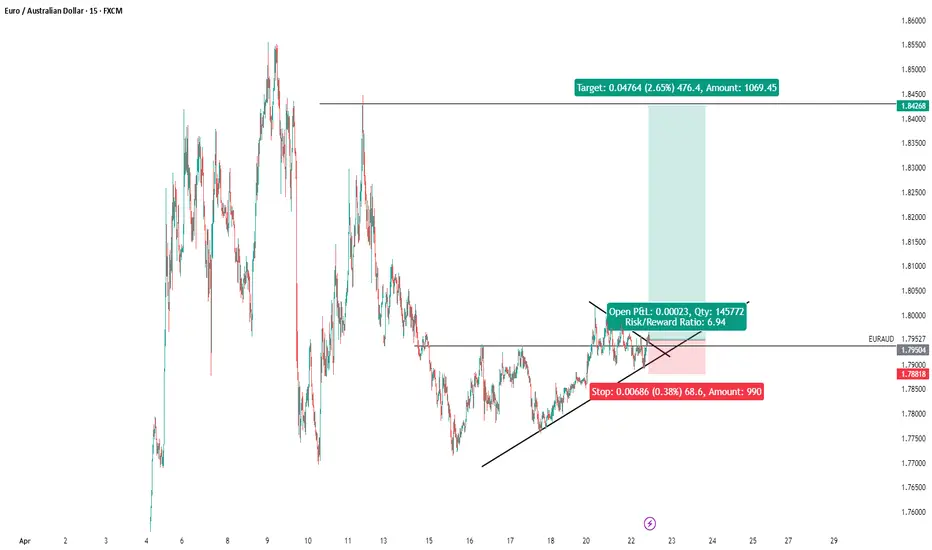
EURAUD to find sellers at previous resistance?EURAUD - 24h expiry
The RSI is trending lower.
Price action looks to be forming a top.
Preferred trade is to sell into rallies.
Risk/Reward would be poor to call a sell from current levels.
Bespoke resistance is located at 1.7915.
We look to Sell at 1.7915 (stop at 1.8000)
Our profit targets will be 1.7660 and 1.7620
Resistance: 1.7890 / 1.7980 / 1.8020
Support: 1.7670 / 1.7500 / 1.7430
Risk Disclaimer
The trade ideas beyond this page are for informational purposes only and do not constitute investment advice or a solicitation to trade. This information is provided by Signal Centre, a third-party unaffiliated with OANDA, and is intended for general circulation only. OANDA does not guarantee the accuracy of this information and assumes no responsibilities for the information provided by the third party. The information does not take into account the specific investment objectives, financial situation, or particular needs of any particular person. You should take into account your specific investment objectives, financial situation, and particular needs before making a commitment to trade, including seeking advice from an independent financial adviser regarding the suitability of the investment, under a separate engagement, as you deem fit.
You accept that you assume all risks in independently viewing the contents and selecting a chosen strategy.
Where the research is distributed in Singapore to a person who is not an Accredited Investor, Expert Investor or an Institutional Investor, Oanda Asia Pacific Pte Ltd (“OAP“) accepts legal responsibility for the contents of the report to such persons only to the extent required by law. Singapore customers should contact OAP at 6579 8289 for matters arising from, or in connection with, the information/research distributed.

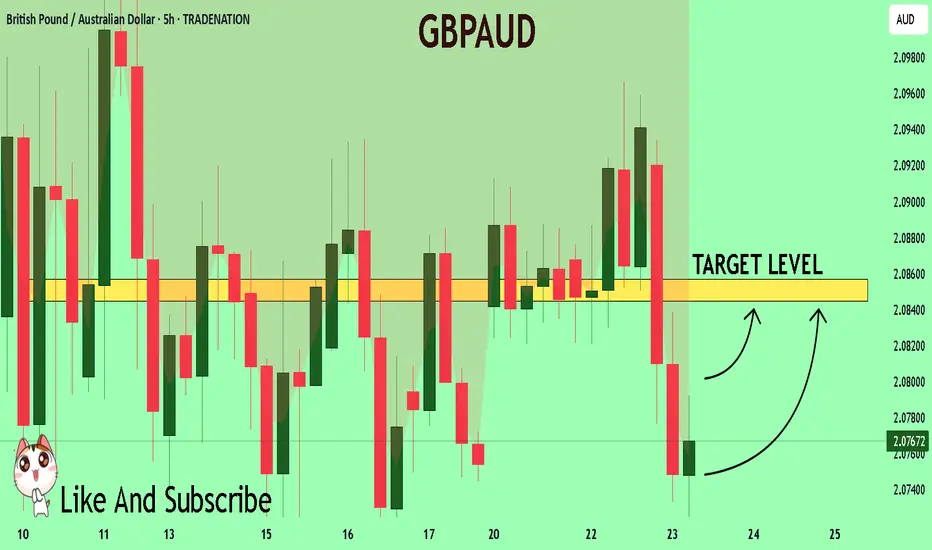
GBPAUD Will Explode! BUY!
My dear friends,
Please, find my technical outlook for GBPAUD below:
The instrument tests an important psychological level 2.0776
Bias - Bullish
Technical Indicators: Supper Trend gives a precise Bullish signal, while Pivot Point HL predicts price changes and potential reversals in the market.
Target - 2.0844
About Used Indicators:
Super-trend indicator is more useful in trending markets where there are clear uptrends and downtrends in price.
Disclosure: I am part of Trade Nation's Influencer program and receive a monthly fee for using their TradingView charts in my analysis.
———————————
WISH YOU ALL LUCK
Daily Price Action: AUDNZD Wednesday 4/23/2025In this video, we will be looking into the potential price action of AUDNZD.

Daily Price Action: AUDCAD Wednesday 4/23/2025In this video, we will be looking into the potential price action of AUDCAD.

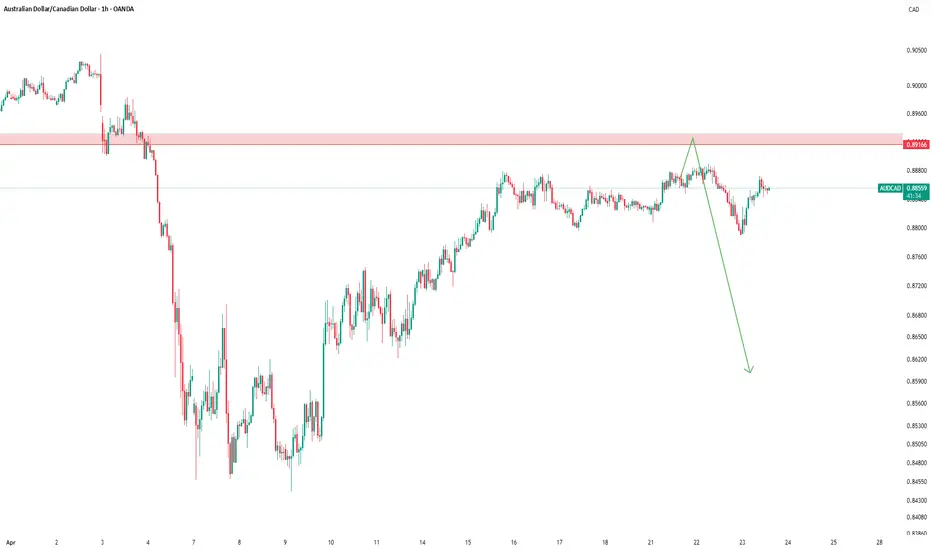
AUDCAD...SHORTOANDA:AUDCAD
Market structure suggests is preparing for its next move. The level will likely play a critical role in the upcoming direction.
If structure breaks and confirms the shift, a new bias might form after the retest.
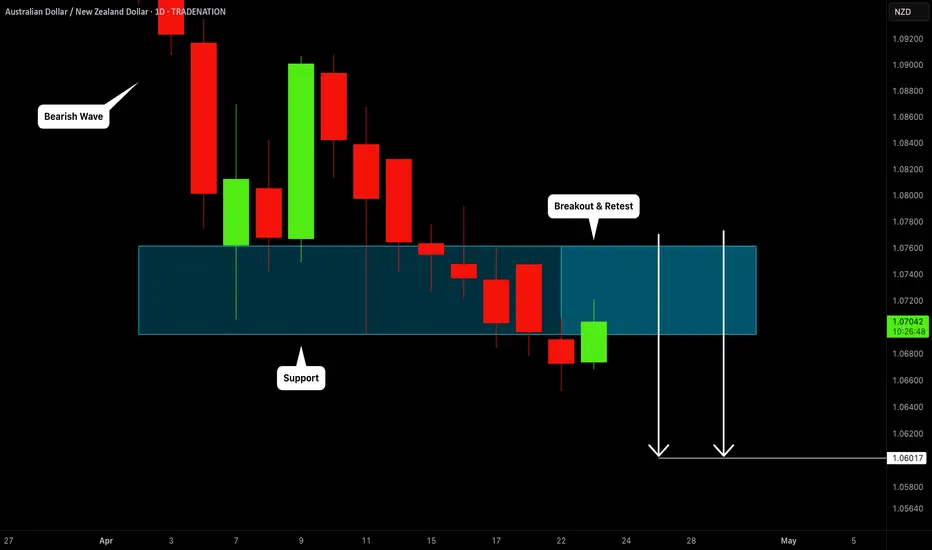
AUDNZD: Bearish Trend Continuation 🇦🇺🇳🇿
AUDNZD violated a significant support cluster on a daily.
Because the pair is trading in a long-term bearish trend,
such a violation signifies a highly probable bearish continuation.
Next support - 1.06
❤️Please, support my work with like, thank you!❤️
I am part of Trade Nation's Influencer program and receive a monthly fee for using their TradingView charts in my analysis.
EUR-AUD Local Long! Buy!
Hello,Traders!
EUR-AUD is about to hit
A horizontal support level
Of 1.7691 from where we
Will be expecting a rebound
And a local bullish move up
Buy!
Comment and subscribe to help us grow!
Check out other forecasts below too!
Disclosure: I am part of Trade Nation's Influencer program and receive a monthly fee for using their TradingView charts in my analysis.
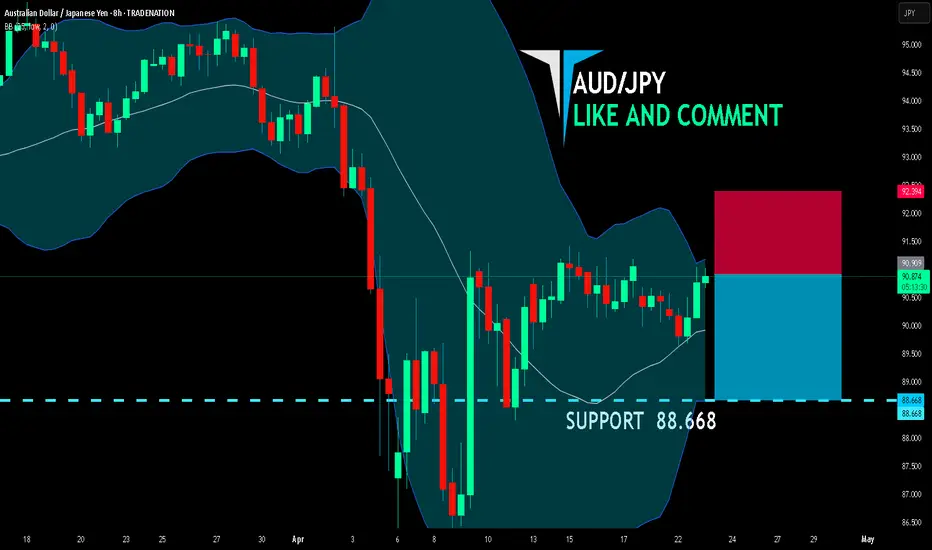
AUD/JPY BEARS ARE GAINING STRENGTH|SHORT
AUD/JPY SIGNAL
Trade Direction: short
Entry Level: 90.909
Target Level: 88.668
Stop Loss: 92.394
RISK PROFILE
Risk level: medium
Suggested risk: 1%
Timeframe: 8h
Disclosure: I am part of Trade Nation's Influencer program and receive a monthly fee for using their TradingView charts in my analysis.
✅LIKE AND COMMENT MY IDEAS✅
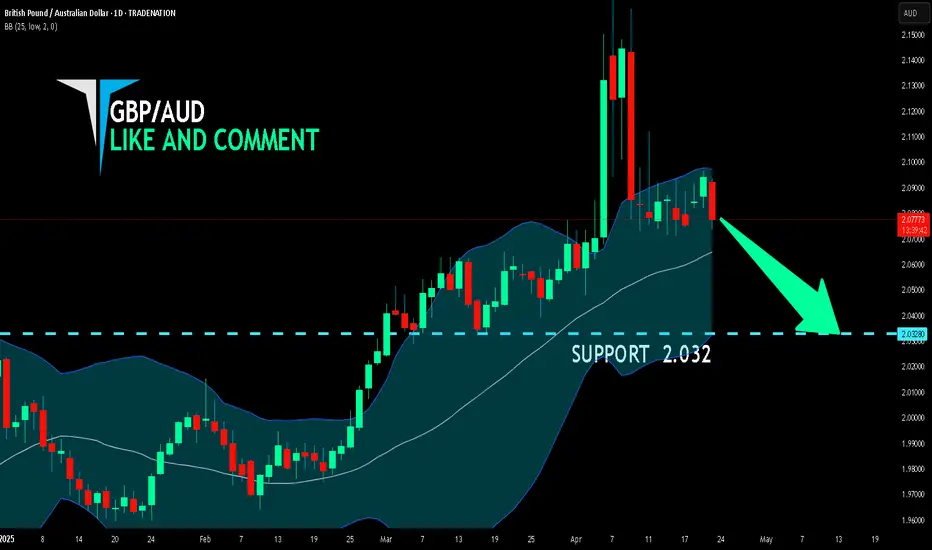
GBP/AUD BEARISH BIAS RIGHT NOW| SHORT
Hello, Friends!
GBP/AUD pair is in the downtrend because previous week’s candle is red, while the price is clearly rising on the 1D timeframe. And after the retest of the resistance line above I believe we will see a move down towards the target below at 2.032 because the pair is overbought due to its proximity to the upper BB band and a bearish correction is likely.
Disclosure: I am part of Trade Nation's Influencer program and receive a monthly fee for using their TradingView charts in my analysis.
✅LIKE AND COMMENT MY IDEAS✅
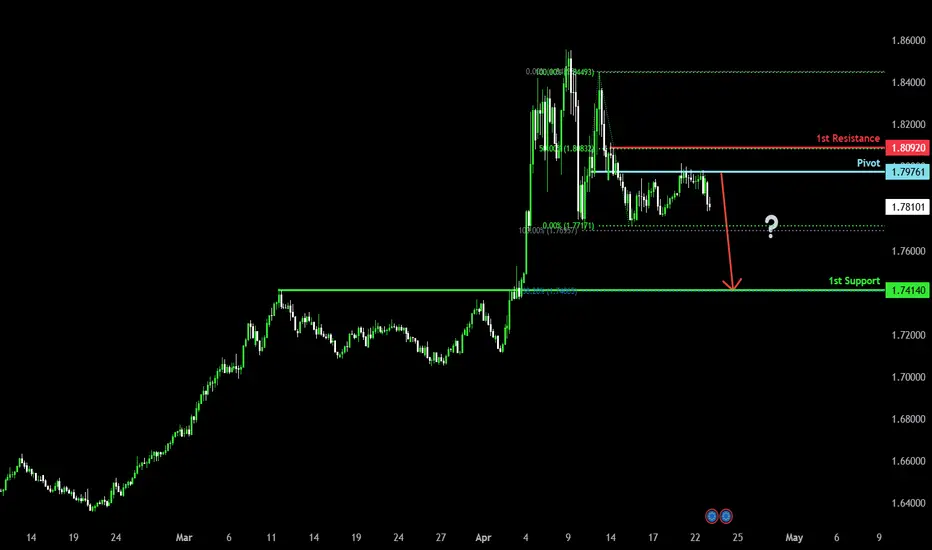
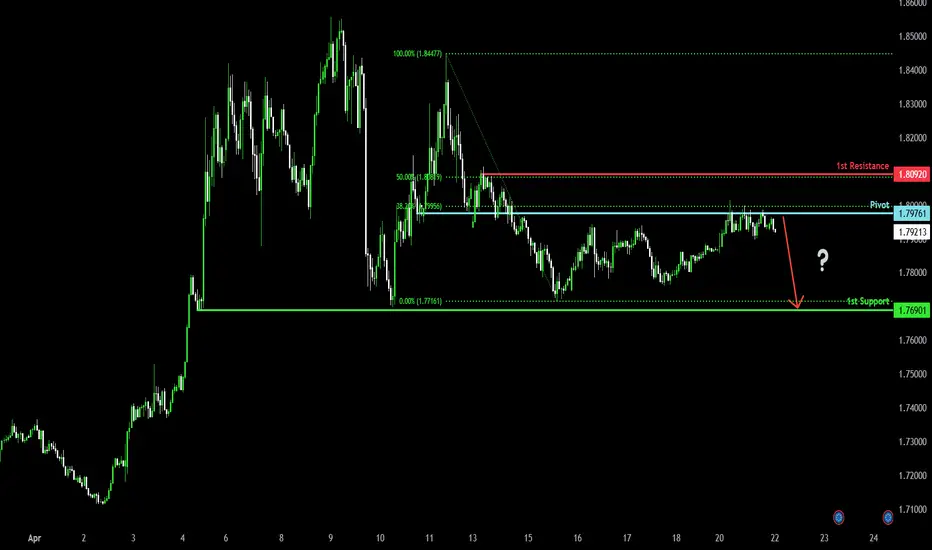
Bearish drop off pullback resistance?EUR/AUD has rejected off the pivot and could drop to the 1st support that lines up with the 138.2% Fibonacci extension.
Pivot: 1.79761
1st Support: 1.74140
1st Resistance: 1.80920
Risk Warning:
Trading Forex and CFDs carries a high level of risk to your capital and you should only trade with money you can afford to lose. Trading Forex and CFDs may not be suitable for all investors, so please ensure that you fully understand the risks involved and seek independent advice if necessary.
Disclaimer:
The above opinions given constitute general market commentary, and do not constitute the opinion or advice of IC Markets or any form of personal or investment advice.
Any opinions, news, research, analyses, prices, other information, or links to third-party sites contained on this website are provided on an "as-is" basis, are intended only to be informative, is not an advice nor a recommendation, nor research, or a record of our trading prices, or an offer of, or solicitation for a transaction in any financial instrument and thus should not be treated as such. The information provided does not involve any specific investment objectives, financial situation and needs of any specific person who may receive it. Please be aware, that past performance is not a reliable indicator of future performance and/or results. Past Performance or Forward-looking scenarios based upon the reasonable beliefs of the third-party provider are not a guarantee of future performance. Actual results may differ materially from those anticipated in forward-looking or past performance statements. IC Markets makes no representation or warranty and assumes no liability as to the accuracy or completeness of the information provided, nor any loss arising from any investment based on a recommendation, forecast or any information supplied by any third-party.
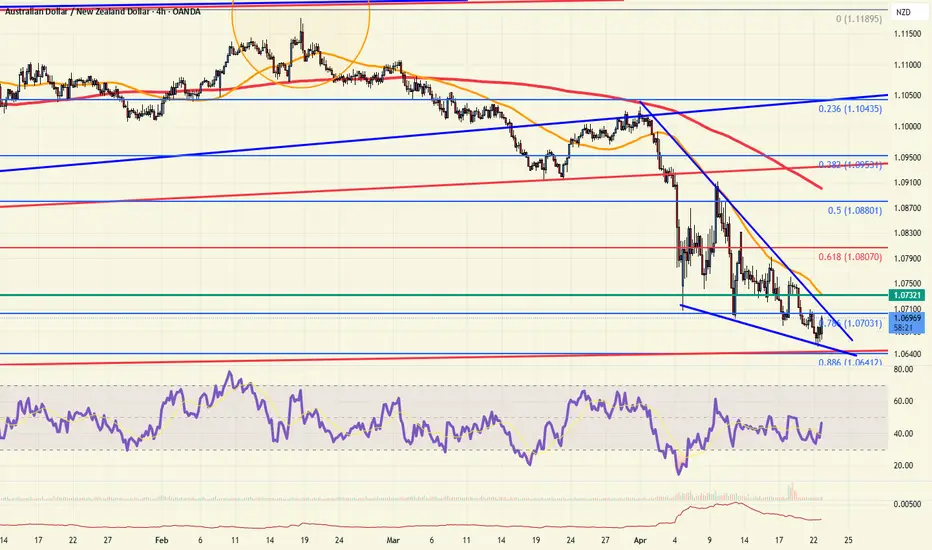
AUDNZD looks to reverse higher nowAsian Session Update: The AUDNZD has found support at the multi year channel as noted yesterday near the 1.0650 level. Now the pair is in a descending wedge, which is typically a reversal pattern (bullish) so a breakout of the 1.0710 level would suggest a move back towards the 1.0800 level.
AUDNZD DOW Theory 1 hour chart Lower Highs and Lower Lows : SellAUDNZD DOW Theory 1 hour chart Lower Highs and Lower Lows : Sell
Risk Reward Your Take Profit Level
Risk Reward 1:1 1.0602
Risk Reward 1:2 1.0522

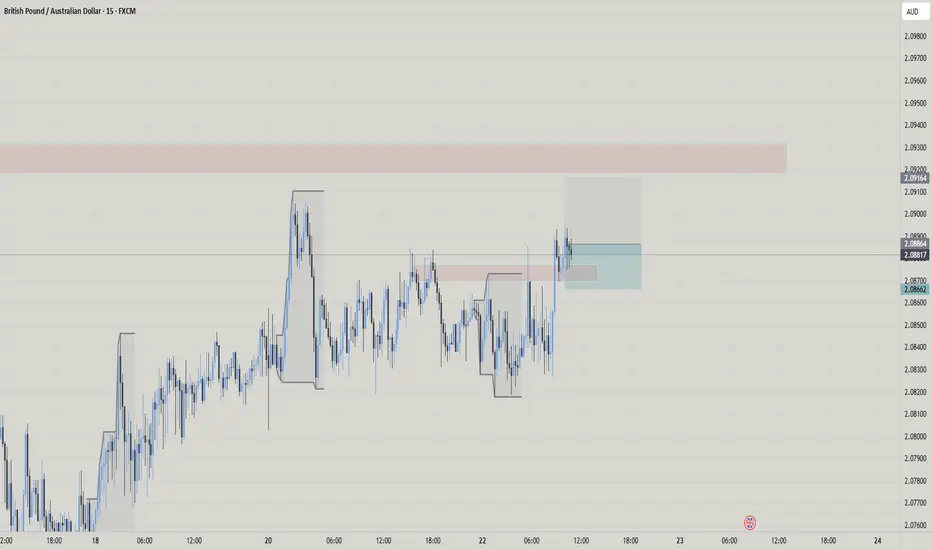
GBPAUD trade ideaFX:GBPAUD
Entered buys on GBPAUD
Reason buy:
1) catch trade towards supply zone above
2) price broke out of supply zone below and retested
3) 1H timeframe created a spinning top on the retested red zone
4) Price created a higher high and came back to retest on 15 min timeframe
5) 15 min created a hammer candle
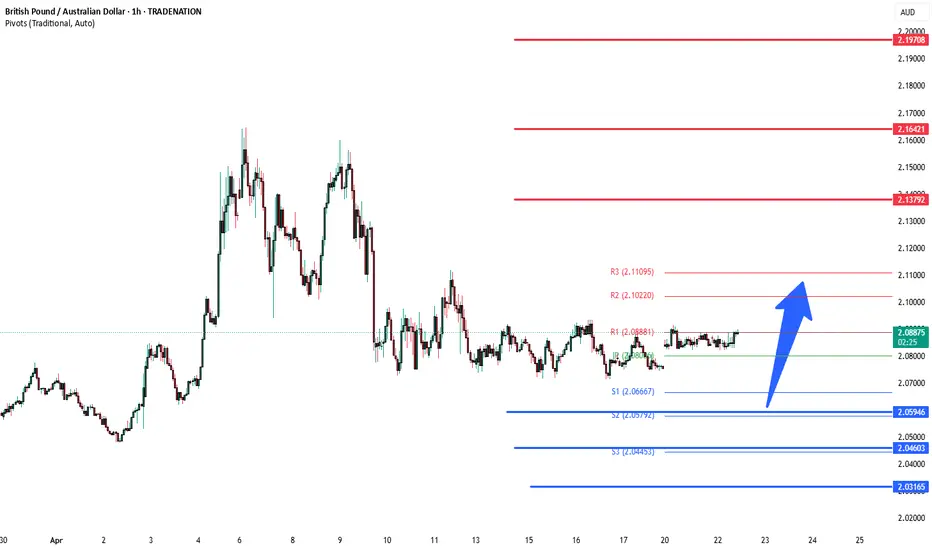
GBPAUD Will Go Up! Buy!
Here is our detailed technical review for GBPAUD.
Time Frame: 1D
Current Trend: Bullish
Sentiment: Oversold (based on 7-period RSI)
Forecast: Bullish
The market is trading around a solid horizontal structure 2.090.
The above observations make me that the market will inevitably achieve 2.149 level.
P.S
We determine oversold/overbought condition with RSI indicator.
When it drops below 30 - the market is considered to be oversold.
When it bounces above 70 - the market is considered to be overbought.
Disclosure: I am part of Trade Nation's Influencer program and receive a monthly fee for using their TradingView charts in my analysis.
Like and subscribe and comment my ideas if you enjoy them!

Daily Price Action AUDNZD Tuesday 4/22/2025In this video, we will be looking into the potential price action of AUDNZD.

Daily Price Action AUDJPY Tuesday 4/22/2025In this video, we will be looking into the potential price action of AUDJPY.

Daily Price Action AUDCAD Tuesday 4/22/2025In this video, we will be looking into the potential price action of AUDCAD.

GBPAUD INTRADAY sideways consolidation supported at 2.0590GBPAUD maintains a bullish bias, supported by the prevailing upward trend. Recent intraday movement indicates a corrective pullback toward a key consolidation zone, offering a potential setup for trend continuation.
Key Support Level: 2.0595 – previous consolidation range and pivotal support
Upside Targets:
2.1380 – initial resistance
2.1642 and 2.1970 – extended bullish targets on higher timeframes
A bullish reversal from 2.0595 would suggest continuation of the uptrend, confirming buying momentum.
However, a decisive break and daily close below 2.0595 would invalidate the bullish structure, opening the door for further retracement toward 2.0460, with additional support at 2.0316 and 2.0134.
Conclusion
GBPAUD remains bullish above 2.0595. A bounce from this level supports further gains. Traders should watch for confirmation signals before positioning for the next move.
This communication is for informational purposes only and should not be viewed as any form of recommendation as to a particular course of action or as investment advice. It is not intended as an offer or solicitation for the purchase or sale of any financial instrument or as an official confirmation of any transaction. Opinions, estimates and assumptions expressed herein are made as of the date of this communication and are subject to change without notice. This communication has been prepared based upon information, including market prices, data and other information, believed to be reliable; however, Trade Nation does not warrant its completeness or accuracy. All market prices and market data contained in or attached to this communication are indicative and subject to change without notice.
euraud buy signal. Don't forget about stop-loss.
Write in the comments all your questions and instruments analysis of which you want to see.
Friends, push the like button, write a comment, and share with your mates - that would be the best THANK YOU.
P.S. I personally will open entry if the price will show it according to my strategy.
Always make your analysis before a trade
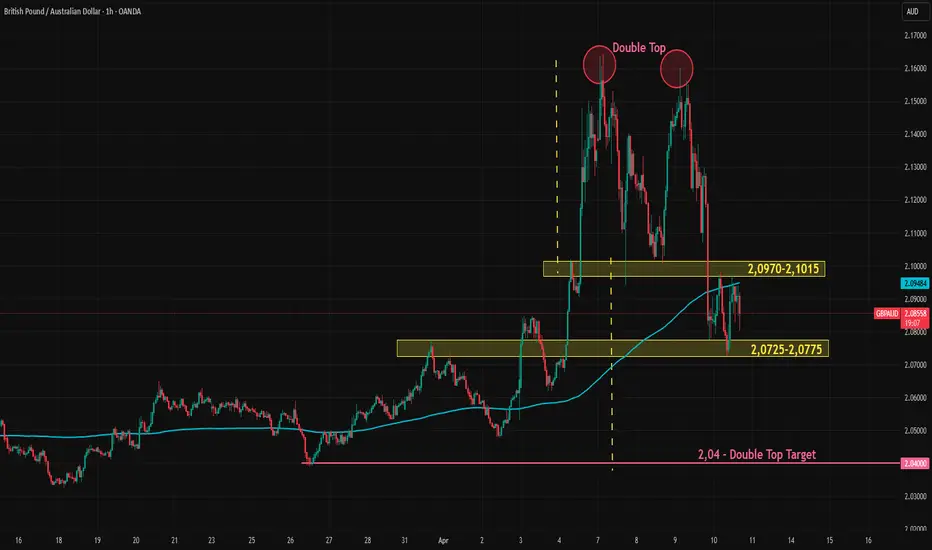
GBPAUD Retests Double Top NecklineGBPAUD has broken the key support level of a double top pattern. The price is now caught between two important zones: the neckline of the double top, which is now acting as resistance, and the former resistance zone at 2.0725–2.0775, which has turned into support.
If this support fails, GBPAUD may continue toward the double top’s projected target near 2.04. However, if the neckline is reclaimed, the bearish setup would be invalidated.
Potential bearish drop?EUR/AUD is reacting off the pivot and could drop to the pullback support.
Pivot: 1.79761
1st Support: 1.76901
1st Resistance: 1.80920
Risk Warning:
Trading Forex and CFDs carries a high level of risk to your capital and you should only trade with money you can afford to lose. Trading Forex and CFDs may not be suitable for all investors, so please ensure that you fully understand the risks involved and seek independent advice if necessary.
Disclaimer:
The above opinions given constitute general market commentary, and do not constitute the opinion or advice of IC Markets or any form of personal or investment advice.
Any opinions, news, research, analyses, prices, other information, or links to third-party sites contained on this website are provided on an "as-is" basis, are intended only to be informative, is not an advice nor a recommendation, nor research, or a record of our trading prices, or an offer of, or solicitation for a transaction in any financial instrument and thus should not be treated as such. The information provided does not involve any specific investment objectives, financial situation and needs of any specific person who may receive it. Please be aware, that past performance is not a reliable indicator of future performance and/or results. Past Performance or Forward-looking scenarios based upon the reasonable beliefs of the third-party provider are not a guarantee of future performance. Actual results may differ materially from those anticipated in forward-looking or past performance statements. IC Markets makes no representation or warranty and assumes no liability as to the accuracy or completeness of the information provided, nor any loss arising from any investment based on a recommendation, forecast or any information supplied by any third-party.
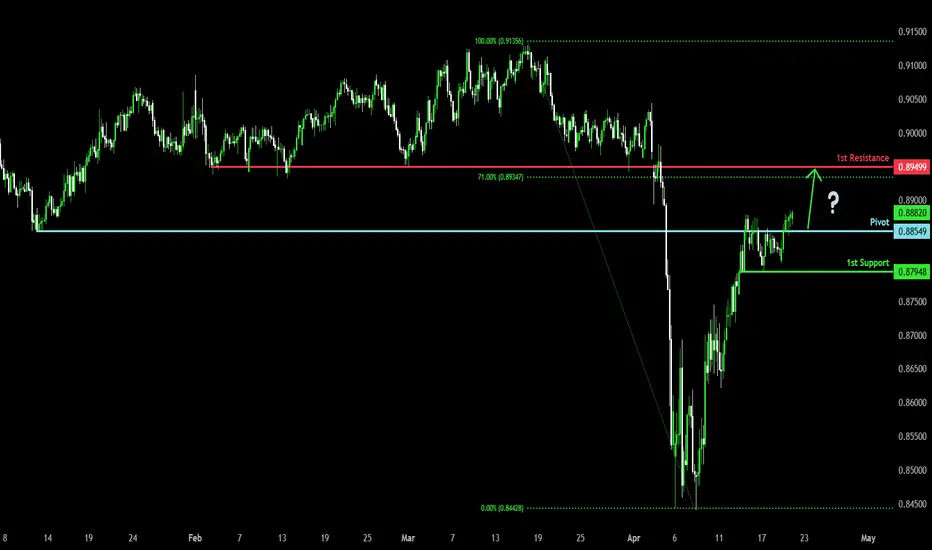
Bullish rise?AUD/CAD is reacting off the pivot and could rise to the 1st resistance.
Pivot: 0.88549
1st Support: 0.87948
1st Resistance: 0.89499
Risk Warning:
Trading Forex and CFDs carries a high level of risk to your capital and you should only trade with money you can afford to lose. Trading Forex and CFDs may not be suitable for all investors, so please ensure that you fully understand the risks involved and seek independent advice if necessary.
Disclaimer:
The above opinions given constitute general market commentary, and do not constitute the opinion or advice of IC Markets or any form of personal or investment advice.
Any opinions, news, research, analyses, prices, other information, or links to third-party sites contained on this website are provided on an "as-is" basis, are intended only to be informative, is not an advice nor a recommendation, nor research, or a record of our trading prices, or an offer of, or solicitation for a transaction in any financial instrument and thus should not be treated as such. The information provided does not involve any specific investment objectives, financial situation and needs of any specific person who may receive it. Please be aware, that past performance is not a reliable indicator of future performance and/or results. Past Performance or Forward-looking scenarios based upon the reasonable beliefs of the third-party provider are not a guarantee of future performance. Actual results may differ materially from those anticipated in forward-looking or past performance statements. IC Markets makes no representation or warranty and assumes no liability as to the accuracy or completeness of the information provided, nor any loss arising from any investment based on a recommendation, forecast or any information supplied by any third-party.