AUDCHF Trading Opportunity! SELL!
My dear friends,
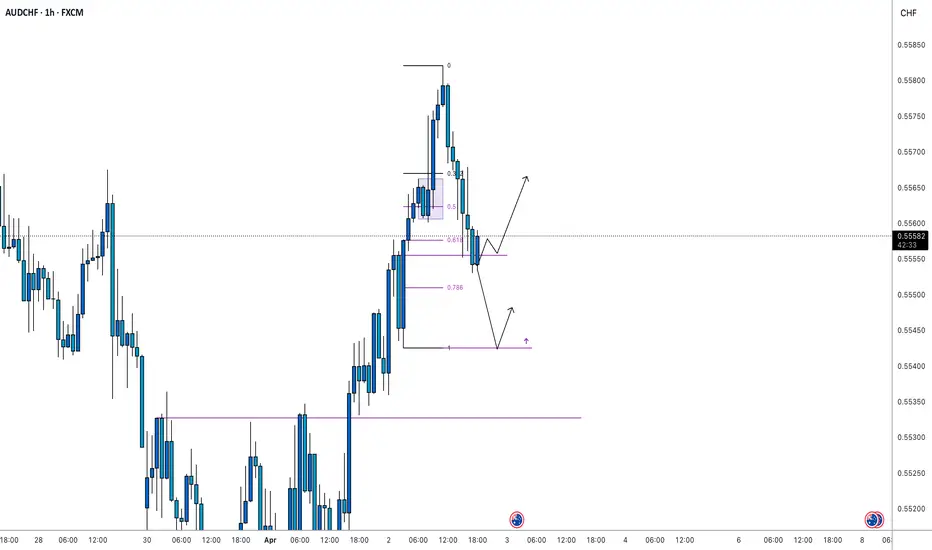
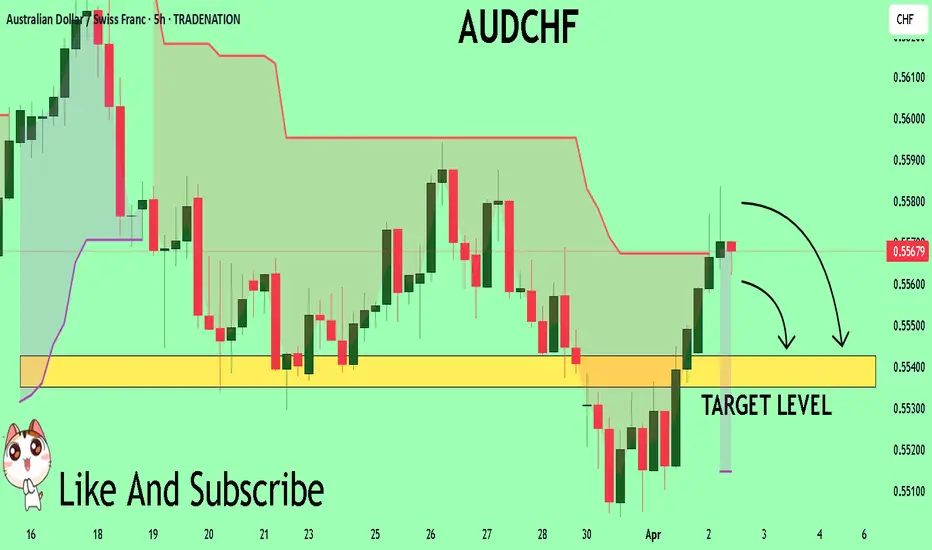
My technical analysis for AUDCHF is below:
The market is trading on 0.5567 pivot level.
Bias - Bearish
Technical Indicators: Both Super Trend & Pivot HL indicate a highly probable Bearish continuation.
Target - 0.5542
About Used Indicators:
A pivot point is a technical analysis indicator, or calculations, used to determine the overall trend of the market over different time frames.
Disclosure: I am part of Trade Nation's Influencer program and receive a monthly fee for using their TradingView charts in my analysis.
———————————
WISH YOU ALL LUCK
AUD (Australian Dollar)
FXAN & Heikin Ashi TradeOANDA:AUDCHF
In this video, I’ll be sharing my analysis of AUDCHF, using FXAN's proprietary algo indicators with my unique Heikin Ashi strategy. I’ll walk you through the reasoning behind my trade setup and highlight key areas where I’m anticipating potential opportunities.
I’m always happy to receive any feedback.
Like, share and comment! ❤️
Thank you for watching my videos! 🙏

GBPAUD Massive Short! SELL!
My dear friends,
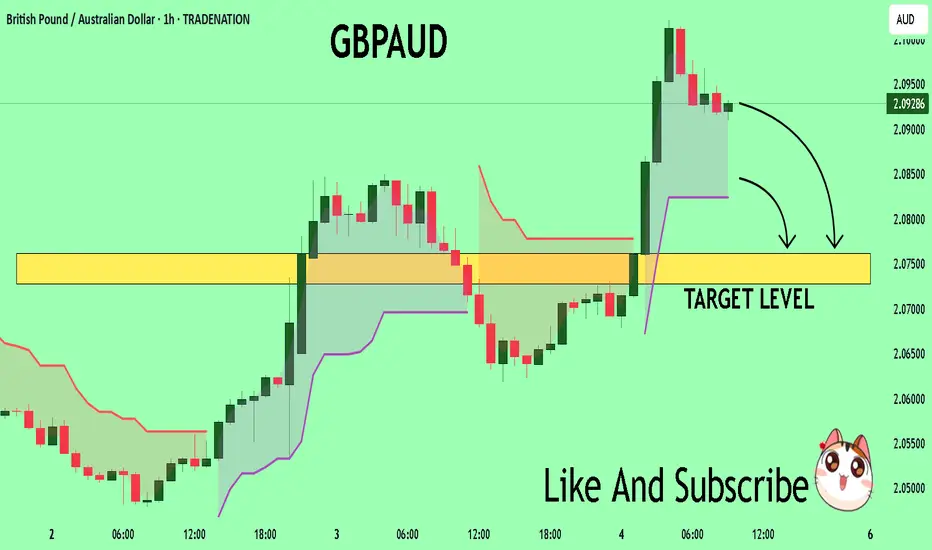
GBPAUD looks like it will make a good move, and here are the details:
The market is trading on 2.0922 pivot level.
Bias - Bearish
Technical Indicators: Supper Trend generates a clear short signal while Pivot Point HL is currently determining the overall Bearish trend of the market.
Goal - 2.0761
About Used Indicators:
Pivot points are a great way to identify areas of support and resistance, but they work best when combined with other kinds of technical analysis
Disclosure: I am part of Trade Nation's Influencer program and receive a monthly fee for using their TradingView charts in my analysis.
———————————
WISH YOU ALL LUCK
AUD/CAD BUYERS WILL DOMINATE THE MARKET|LONG
AUD/CAD SIGNAL
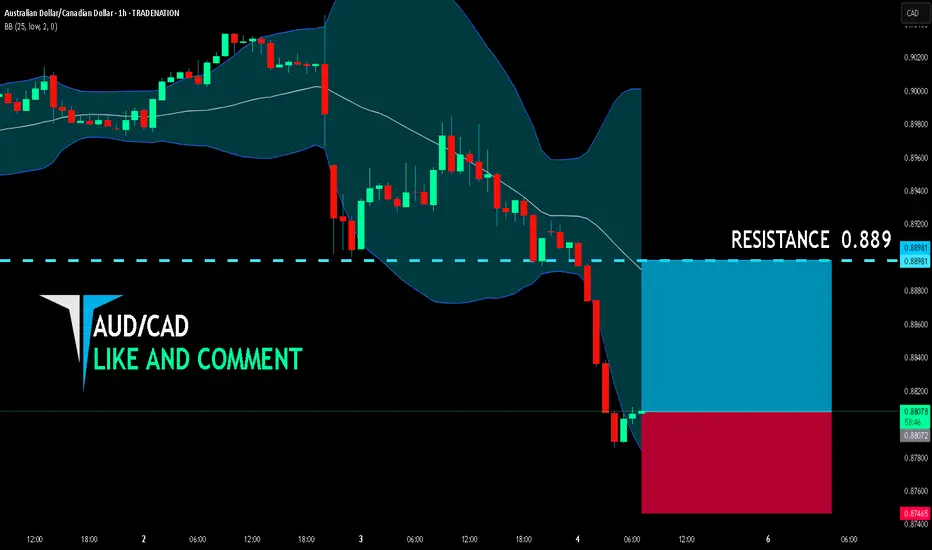
Trade Direction: long
Entry Level: 0.880
Target Level: 0.889
Stop Loss: 0.874
RISK PROFILE
Risk level: medium
Suggested risk: 1%
Timeframe: 1h
Disclosure: I am part of Trade Nation's Influencer program and receive a monthly fee for using their TradingView charts in my analysis.
✅LIKE AND COMMENT MY IDEAS✅
EUR-AUD Free Signal! Buy!
Hello,Traders!
EUR-AUD is trading in a
Strong uptrend and the
Pair made a bullish breakout
And a retest of the key
Horizontal level of 1.7420
And is going up now so
We can enter a long trade
On a local pullback with
The Take Profit of 1.7551
And the Stop Loss of 1.7362
Buy!
Comment and subscribe to help us grow!
Check out other forecasts below too!
Disclosure: I am part of Trade Nation's Influencer program and receive a monthly fee for using their TradingView charts in my analysis.

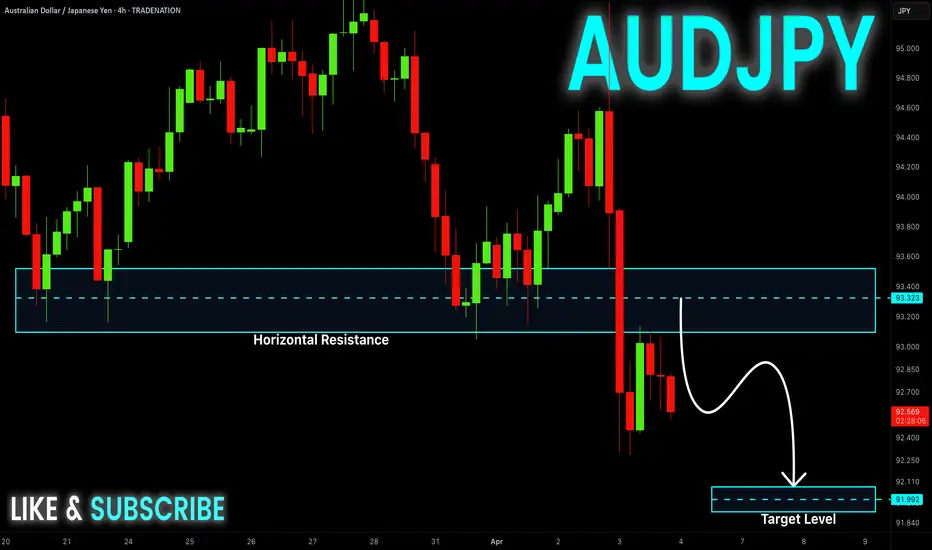
AUD-JPY Will Keep Falling! Sell!
Hello,Traders!
AUD-JPY made a bearish
Breakout then made a retest
And is going down again
So we are bearish biased
And we will be expecting
A further bearish continuation
Sell!
Comment and subscribe to help us grow!
Check out other forecasts below too!
Disclosure: I am part of Trade Nation's Influencer program and receive a monthly fee for using their TradingView charts in my analysis.
AUDJPY INTRADAY capped by resistance at 94.45 The AUDJPY pair is in an overall downtrend, though currently experiencing a short-term oversold bounce back.
Key Resistance: 94.45 – A bearish rejection from this level could push prices lower.
Bearish Scenario: A break below 94.45 could lead to further declines toward 92.70, 92.00, and 91.70.
Alternatively a breakout above 94.45 and a daily close higher would negate a bearish outlook.
Upside Targets: 95.20, 95.70, and 96.20 if the bullish trend continues.
Conclusion: The trend remains bearish unless AUDJPY closes above 94.45, which would signal further upside risk.
This communication is for informational purposes only and should not be viewed as any form of recommendation as to a particular course of action or as investment advice. It is not intended as an offer or solicitation for the purchase or sale of any financial instrument or as an official confirmation of any transaction. Opinions, estimates and assumptions expressed herein are made as of the date of this communication and are subject to change without notice. This communication has been prepared based upon information, including market prices, data and other information, believed to be reliable; however, Trade Nation does not warrant its completeness or accuracy. All market prices and market data contained in or attached to this communication are indicative and subject to change without notice.

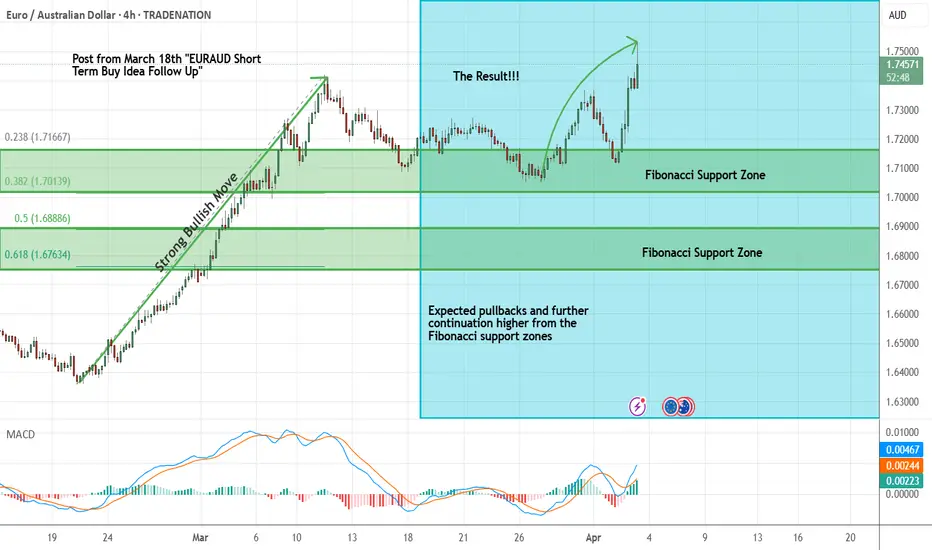
EURAUD Short Term Buy Idea Update!!!Hi Traders, on March 18th I shared this "EURAUD Short Term Buy Idea Follow Up"
I expected pullbacks towards the marked key support zones and then a potential continuation higher. You can read the full post using the link above.
Price reached the first key support zone, respected it and bounced higher as expected!!!
If you enjoy this idea, don’t forget to LIKE 👍, FOLLOW ✅, SHARE 🙌, and COMMENT ✍! Drop your thoughts and charts below to keep the discussion going. Your support helps keep this content free and reach more people! 🚀
---------------------------------------------------------------------------------------------------------------------
Disclosure: I am part of Trade Nation's Influencer program and receive a monthly fee for using their TradingView charts in my analysis.
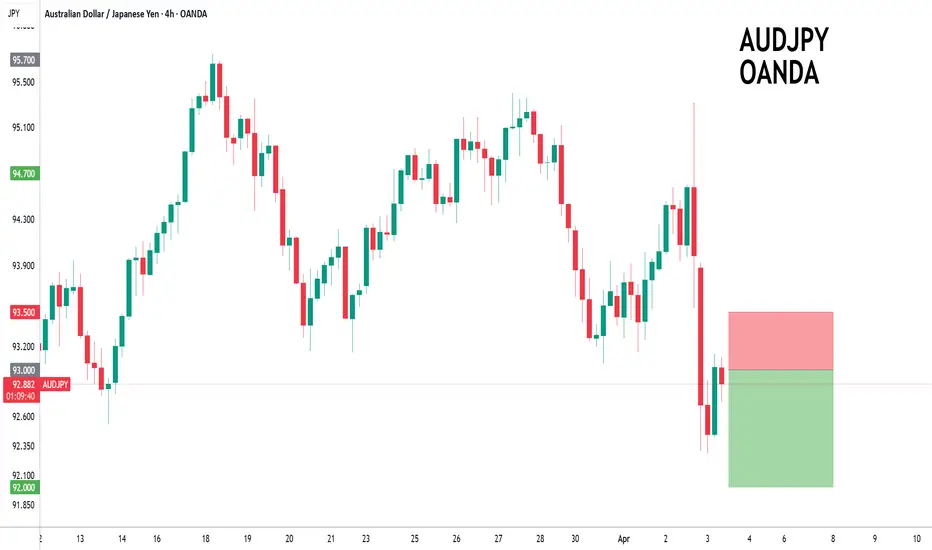
AUDJPY to find sellers at market price?AUDJPY - 24h expiry
There is no indication that the selloff is coming to an end.
Further downside is expected.
Risk/Reward would be poor to call a sell from current levels.
A move through 92.50 will confirm the bearish momentum.
The measured move target is 91.75.
We look to Sell at 93.00 (stop at 93.50)
Our profit targets will be 92.00 and 91.75
Resistance: 92.75 / 93.00 / 93.25
Support: 92.25 / 92.00 / 91.75
Risk Disclaimer
The trade ideas beyond this page are for informational purposes only and do not constitute investment advice or a solicitation to trade. This information is provided by Signal Centre, a third-party unaffiliated with OANDA, and is intended for general circulation only. OANDA does not guarantee the accuracy of this information and assumes no responsibilities for the information provided by the third party. The information does not take into account the specific investment objectives, financial situation, or particular needs of any particular person. You should take into account your specific investment objectives, financial situation, and particular needs before making a commitment to trade, including seeking advice from an independent financial adviser regarding the suitability of the investment, under a separate engagement, as you deem fit.
You accept that you assume all risks in independently viewing the contents and selecting a chosen strategy.
Where the research is distributed in Singapore to a person who is not an Accredited Investor, Expert Investor or an Institutional Investor, Oanda Asia Pacific Pte Ltd (“OAP“) accepts legal responsibility for the contents of the report to such persons only to the extent required by law. Singapore customers should contact OAP at 6579 8289 for matters arising from, or in connection with, the information/research distributed.
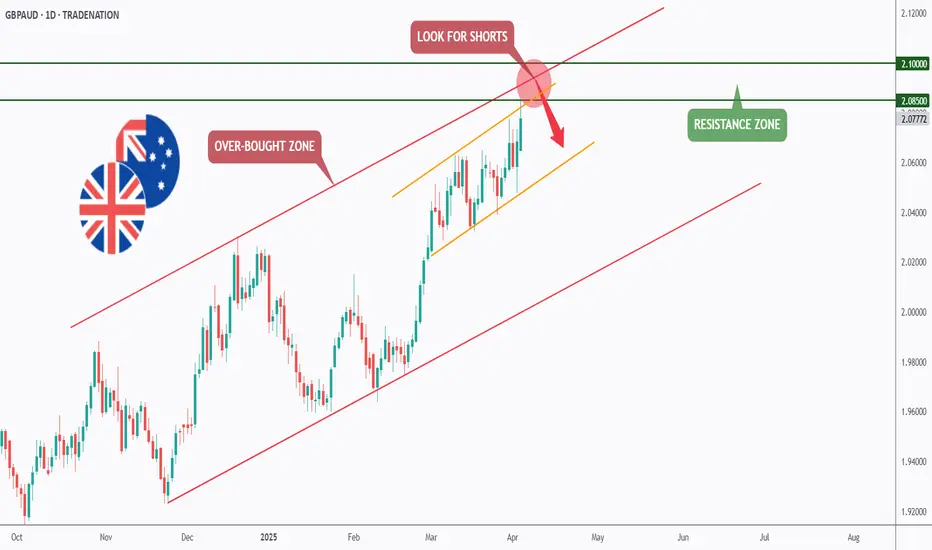
GBPAUD - Already Over-Bought!Hello TradingView Family / Fellow Traders. This is Richard, also known as theSignalyst.
📈GBPAUD has been bullish trading within the rising channels in orange and red.
Currently, GBPAUD is retesting the upper bound of the channels.
Moreover, the $2.085 - $2.1 is a strong resistance zone.
🏹 Thus, the highlighted red circle is a strong area to look for sell setups as it is the intersection of the upper trendlines and green resistance zone.
📚 As per my trading style:
As #GBPAUD approaches the red circle zone, I will be looking for bearish reversal setups (like a double top pattern, trendline break , and so on...)
📚 Always follow your trading plan regarding entry, risk management, and trade management.
Good luck!
All Strategies Are Good; If Managed Properly!
~Rich
Disclosure: I am part of Trade Nation's Influencer program and receive a monthly fee for using their TradingView charts in my analysis.
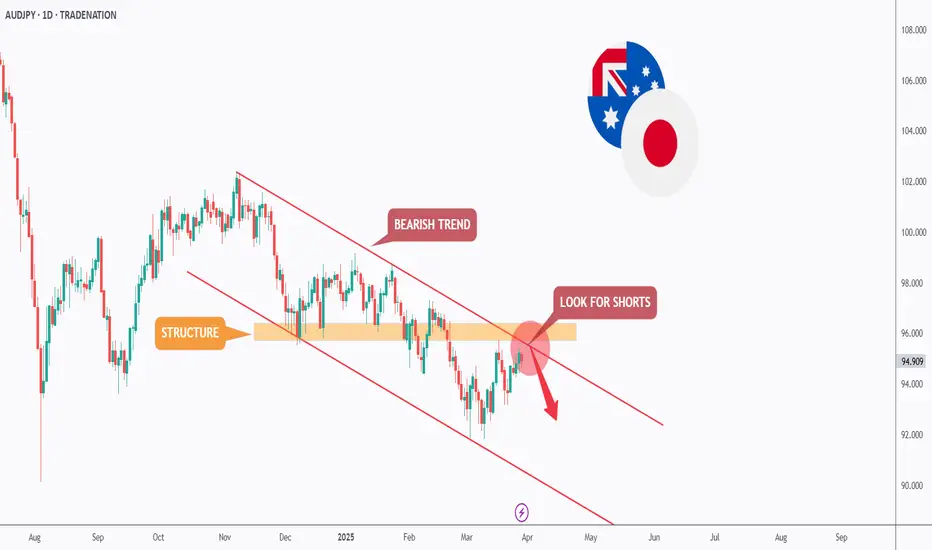
AUDJPY - Follow The Bears!Hello TradingView Family / Fellow Traders. This is Richard, also known as theSignalyst.
📈AUDJPY has been bearish trading within the falling channel in red.
Currently, AUDJPY is approaching the upper bound of the channel.
Moreover, it is retesting a strong structure marked in orange.
🏹 Thus, the highlighted red circle is a strong area to look for sell setups as it is the intersection of the structure and upper red trendline.
📚 As per my trading style:
As #AUDJPY is around the red circle zone, I will be looking for bearish reversal setups (like a double top pattern, trendline break , and so on...)
📚 Always follow your trading plan regarding entry, risk management, and trade management.
Good luck!
All Strategies Are Good; If Managed Properly!
~Rich
Disclosure: I am part of Trade Nation's Influencer program and receive a monthly fee for using their TradingView charts in my analysis.
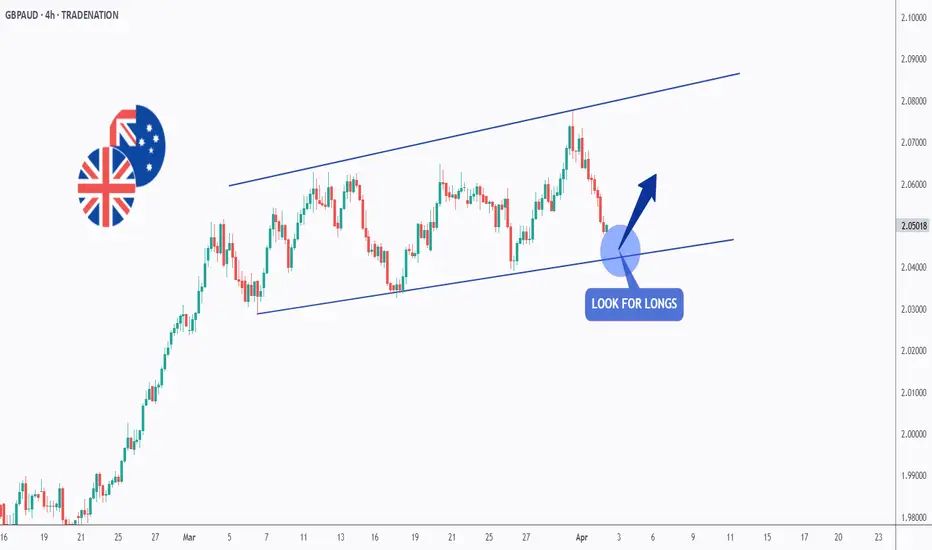
GBPAUD - One More Leg!Hello TradingView Family / Fellow Traders. This is Richard, also known as theSignalyst.
📈GBPAUD has been overall bullish trading within the rising channel marked in blue.
Moreover, it is retesting a strong structure.
🏹 Thus, the highlighted blue circle is a strong area to look for buy setups as it is the intersection of structure and lower blue trendline acting as a non-horizontal support.
📚 As per my trading style:
As #GBPAUD approaches the blue circle zone, I will be looking for bullish reversal setups (like a double bottom pattern, trendline break , and so on...)
📚 Always follow your trading plan regarding entry, risk management, and trade management.
Good luck!
All Strategies Are Good; If Managed Properly!
~Rich
Disclosure: I am part of Trade Nation's Influencer program and receive a monthly fee for using their TradingView charts in my analysis.
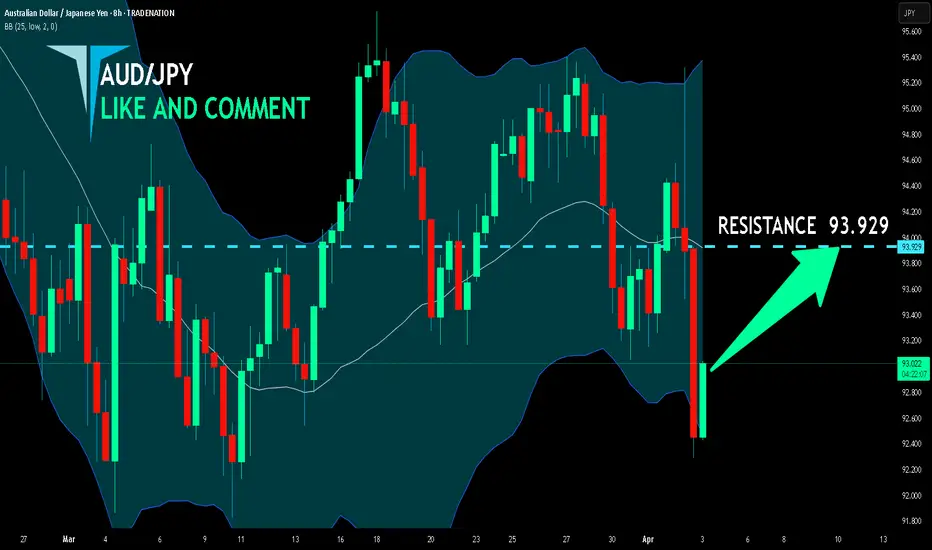
AUD/JPY BULLS WILL DOMINATE THE MARKET|LONG
Hello, Friends!
AUD/JPY pair is trading in a local downtrend which we know by looking at the previous 1W candle which is red. On the 8H timeframe the pair is going down too. The pair is oversold because the price is close to the lower band of the BB indicator. So we are looking to buy the pair with the lower BB line acting as support. The next target is 93.929 area.
Disclosure: I am part of Trade Nation's Influencer program and receive a monthly fee for using their TradingView charts in my analysis.
✅LIKE AND COMMENT MY IDEAS✅
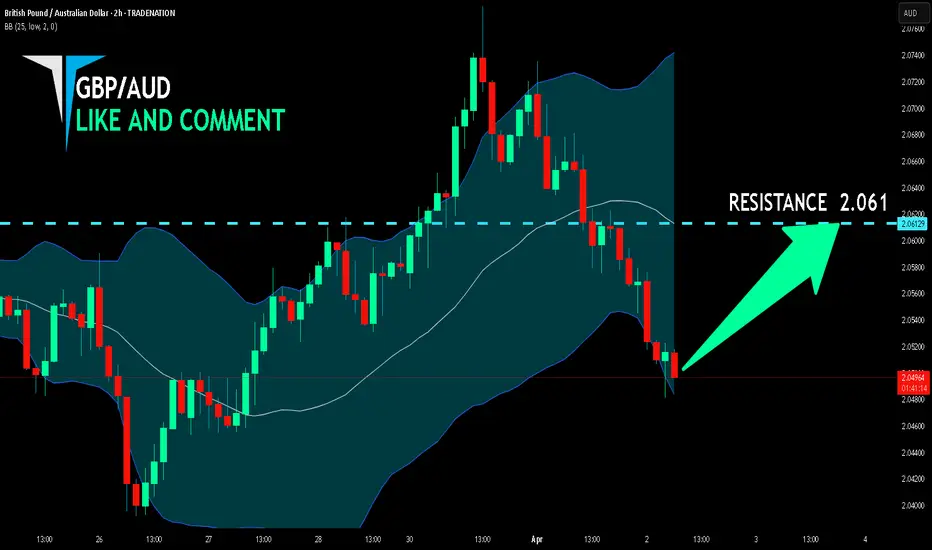
GBP/AUD BEST PLACE TO BUY FROM|LONG
Hello, Friends!
It makes sense for us to go long on GBP/AUD right now from the support line below with the target of 2.061 because of the confluence of the two strong factors which are the general uptrend on the previous 1W candle and the oversold situation on the lower TF determined by it’s proximity to the lower BB band.
Disclosure: I am part of Trade Nation's Influencer program and receive a monthly fee for using their TradingView charts in my analysis.
✅LIKE AND COMMENT MY IDEAS✅
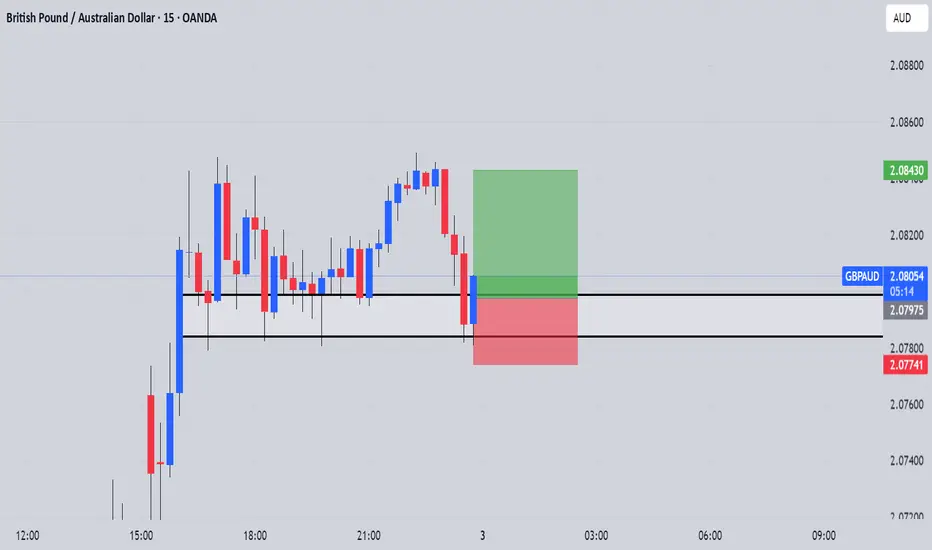
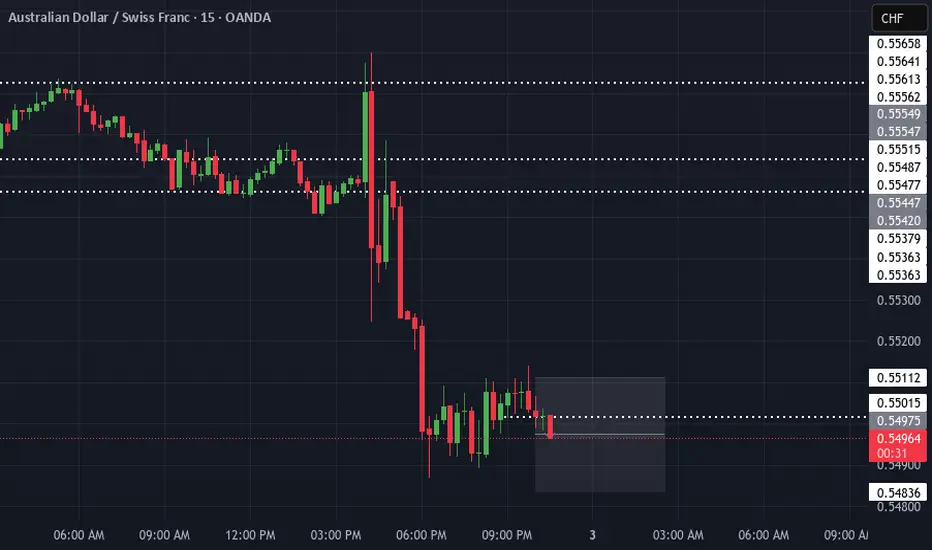
Audchf SellPrice has been in a obvious downtrend. once price closes below 55015 on the 15min tf im looking for a nice scalp opportunity.
AUDCAD Discretionary Analysis: Taking the Elevator DownIt’s more of a sixth sense(like when you just know the milk is bad before you smell it). I think it’s headed down, like an elevator with a broken cable . If I’m right, I’ll make some money. If I’m wrong, well… guess I’ll take the stairs next time.
Just my opinion, not financial advice.

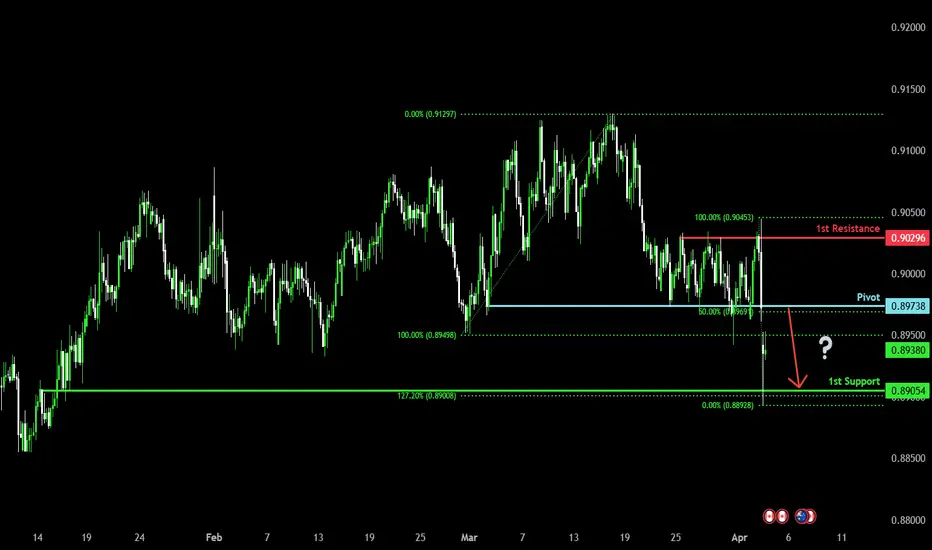
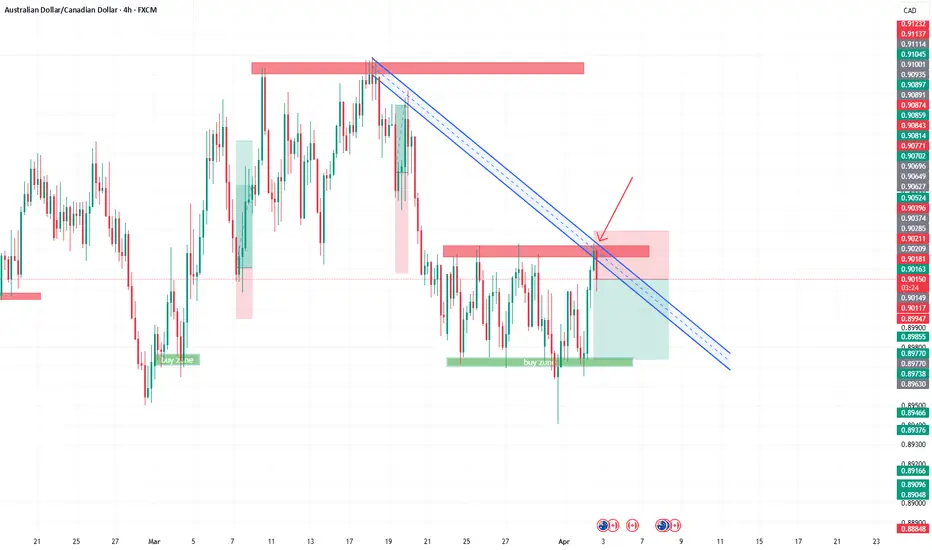
Bearish reversalAUD/CAD is rising towards the pivot which is a pullback resistance and could reverse to the 1st support which line sup with the 127.2% Fibonacci extension.
Pivot: 0.89738
1st Support: 0.89054
1st Resistance: 0.90296
Risk Warning:
Trading Forex and CFDs carries a high level of risk to your capital and you should only trade with money you can afford to lose. Trading Forex and CFDs may not be suitable for all investors, so please ensure that you fully understand the risks involved and seek independent advice if necessary.
Disclaimer:
The above opinions given constitute general market commentary, and do not constitute the opinion or advice of IC Markets or any form of personal or investment advice.
Any opinions, news, research, analyses, prices, other information, or links to third-party sites contained on this website are provided on an "as-is" basis, are intended only to be informative, is not an advice nor a recommendation, nor research, or a record of our trading prices, or an offer of, or solicitation for a transaction in any financial instrument and thus should not be treated as such. The information provided does not involve any specific investment objectives, financial situation and needs of any specific person who may receive it. Please be aware, that past performance is not a reliable indicator of future performance and/or results. Past Performance or Forward-looking scenarios based upon the reasonable beliefs of the third-party provider are not a guarantee of future performance. Actual results may differ materially from those anticipated in forward-looking or past performance statements. IC Markets makes no representation or warranty and assumes no liability as to the accuracy or completeness of the information provided, nor any loss arising from any investment based on a recommendation, forecast or any information supplied by any third-party.
euraud sell signal. Don't forget about stop-loss.
Write in the comments all your questions and instruments analysis of which you want to see.
Friends, push the like button, write a comment, and share with your mates - that would be the best THANK YOU.
P.S. I personally will open entry if the price will show it according to my strategy.
Always make your analysis before a trade

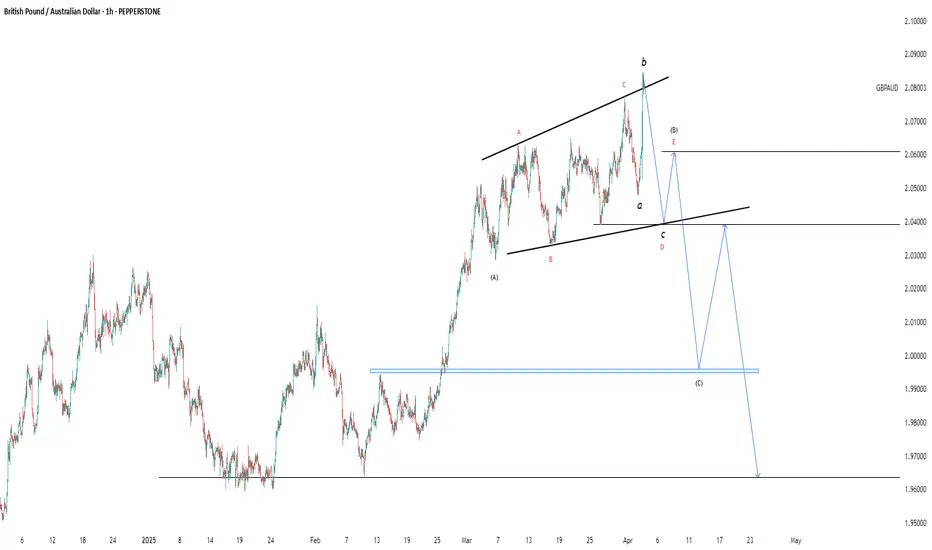
GBPAUD analysis elliot. Don't forget about stop-loss.
Write in the comments all your questions and instruments analysis of which you want to see.
Friends, push the like button, write a comment, and share with your mates - that would be the best THANK YOU.
P.S. I personally will open entry if the price will show it according to my strategy.
Always make your analysis before a trade
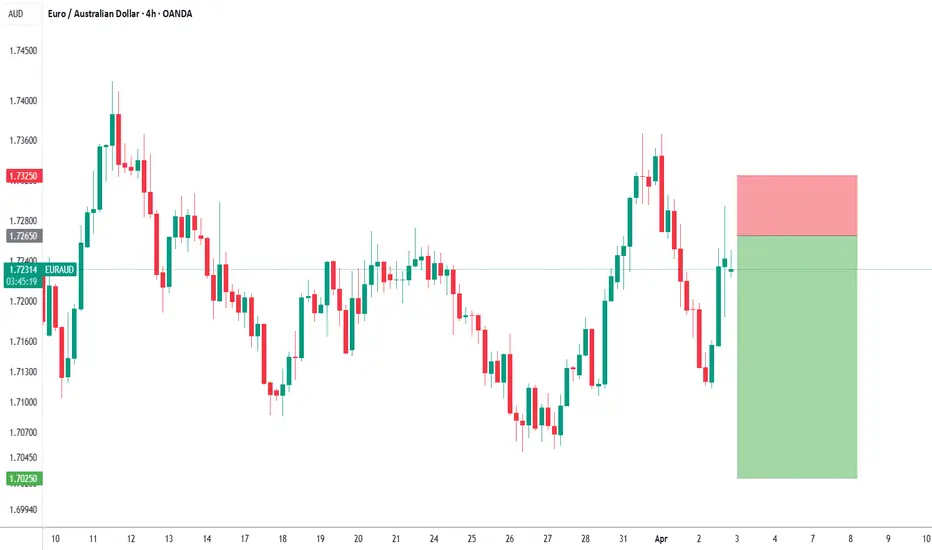
EURAUD rallies continue to attract sellers.EURAUD - 24h expiry
Trading has been mixed and volatile.
We look for a temporary move higher.
Preferred trade is to sell into rallies.
Risk/Reward would be poor to call a sell from current levels.
Bespoke resistance is located at 1.7265.
We look to Sell at 1.7265 (stop at 1.7325)
Our profit targets will be 1.7025 and 1.7000
Resistance: 1.7250 / 1.7310 / 1.7365
Support: 1.7100 / 1.7050 / 1.6950
Risk Disclaimer
The trade ideas beyond this page are for informational purposes only and do not constitute investment advice or a solicitation to trade. This information is provided by Signal Centre, a third-party unaffiliated with OANDA, and is intended for general circulation only. OANDA does not guarantee the accuracy of this information and assumes no responsibilities for the information provided by the third party. The information does not take into account the specific investment objectives, financial situation, or particular needs of any particular person. You should take into account your specific investment objectives, financial situation, and particular needs before making a commitment to trade, including seeking advice from an independent financial adviser regarding the suitability of the investment, under a separate engagement, as you deem fit.
You accept that you assume all risks in independently viewing the contents and selecting a chosen strategy.
Where the research is distributed in Singapore to a person who is not an Accredited Investor, Expert Investor or an Institutional Investor, Oanda Asia Pacific Pte Ltd (“OAP“) accepts legal responsibility for the contents of the report to such persons only to the extent required by law. Singapore customers should contact OAP at 6579 8289 for matters arising from, or in connection with, the information/research distributed.
AUDCAD LONG/BUYBy utilizing Fibonacci retracement levels, historical patterns, , we can formulate a hypothesis that the market might follow a similar trajectory if bearish sentiment prevails.
AUDCHFAUDCHF Potential Buy Idea as Price has overall changed the trend from Bearish to Bullish by forming a Head & Shoulder Pattern,
Now we have a clean Structure HH/HL and Price has Retraced back to 60% of the Previous Push.