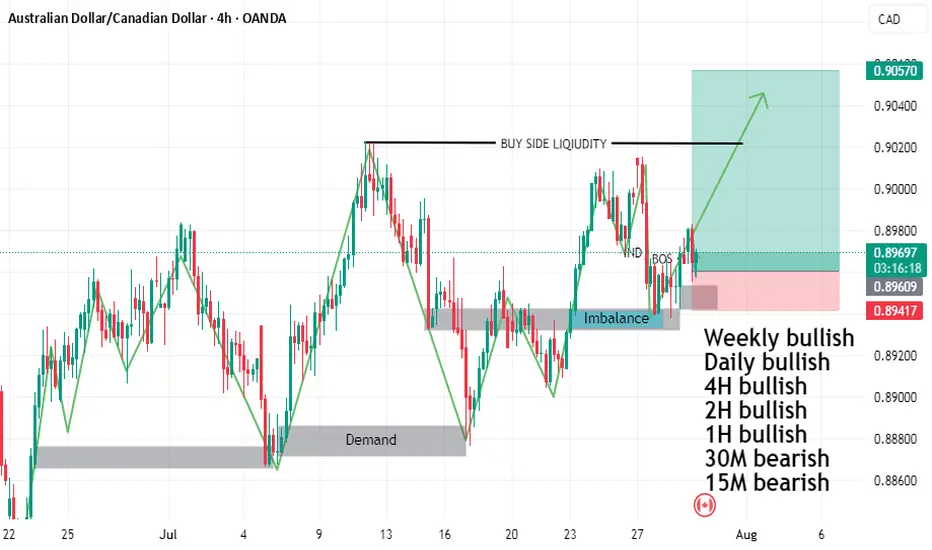
AUDCAD BUY SETUPTHE PRICE FORMED HEAD AND SHOULDER
and do rejection from mitigation order block and imbalance
and we have liquidity on time frame daily buy side liquidity
and time frame weekly double top
so I will buy with you
DON'T forget to follow me so that get more refresh analysis
AUD (Australian Dollar)
AUDNZD Technical Analysis! SELL!
My dear friends,
AUDNZD looks like it will make a good move, and here are the details:
The market is trading on 1.0935 pivot level.
Bias - Bearish
Technical Indicators: Supper Trend generates a clear short signal while Pivot Point HL is currently determining the overall Bearish trend of the market.
Goal - 1.0928
Recommended Stop Loss - 1.0939
About Used Indicators:
Pivot points are a great way to identify areas of support and resistance, but they work best when combined with other kinds of technical analysis
Disclosure: I am part of Trade Nation's Influencer program and receive a monthly fee for using their TradingView charts in my analysis.
———————————
WISH YOU ALL LUCK
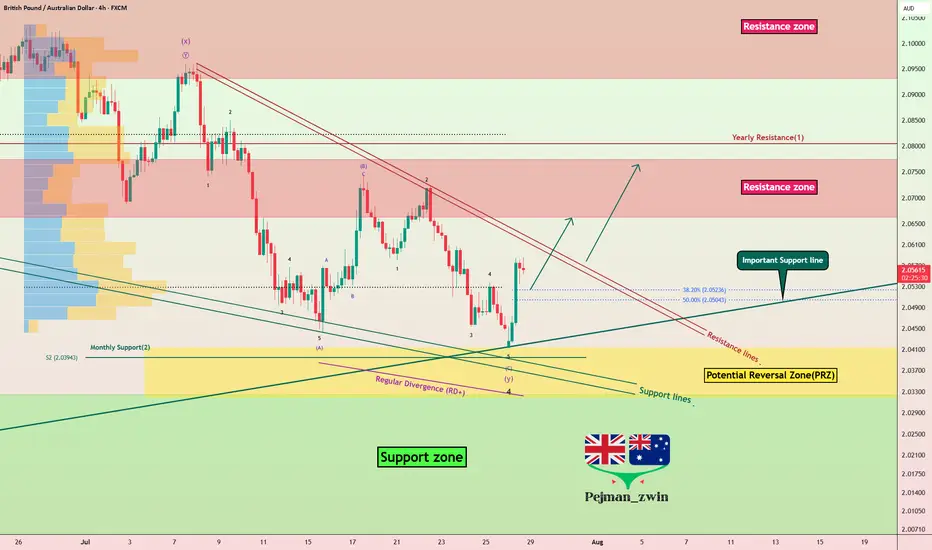
GBPAUD Reverses from Key Zone – Long Setup in Play!Today I want to share with you a Long position on GBPAUD ( OANDA:GBPAUD ).
GBPAUD started to rise well from the Important Support line , Support zone(2.032 AUD-1.987 AUD) , and Potential Reversal Zone(PRZ) and managed to close the 4-hour candle above 2.053 AUD (important) .
In terms of Elliott wave theory , GBPAUD seems to have completed the main wave 4 . The main wave 4 structure was a Double Three Correction(WXY) .
Also, along the way, we can see a Bullish Marubozu candle , which could indicate a continuation of the uptrend .
I expect GBPAUD to break the Resistance lines soon and attack the Resistance zone(2.078 AUD-2.066 AUD) .
First Target: 2.065 AUD
Second Target: 2.076 AUD
Note: Stop Loss(SL): 2.040 =Worst SL
Please respect each other's ideas and express them politely if you agree or disagree.
British Pound/ Australian Dollar Analyze (GBPAUD), 4-hour time frame.
Be sure to follow the updated ideas.
Do not forget to put a Stop loss for your positions (For every position you want to open).
Please follow your strategy and updates; this is just my Idea, and I will gladly see your ideas in this post.
Please do not forget the ✅' like '✅ button 🙏😊 & Share it with your friends; thanks, and Trade safe.
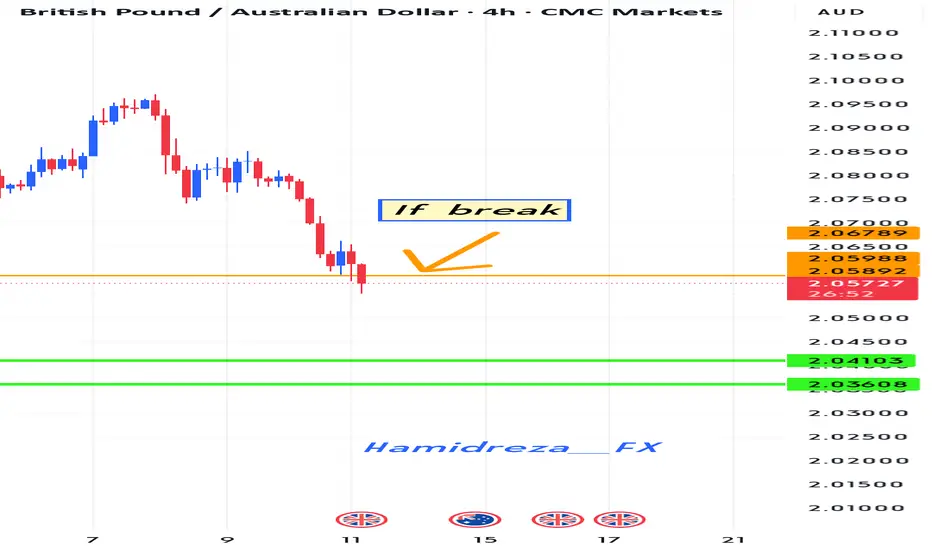
Is the currency GBPAUD depreciating?
Hi dears
I think that if the colored trend line is broken, the downtrend will probably continue until it reaches the target.
Thank you for supporting me by liking, commenting, and subscribing.
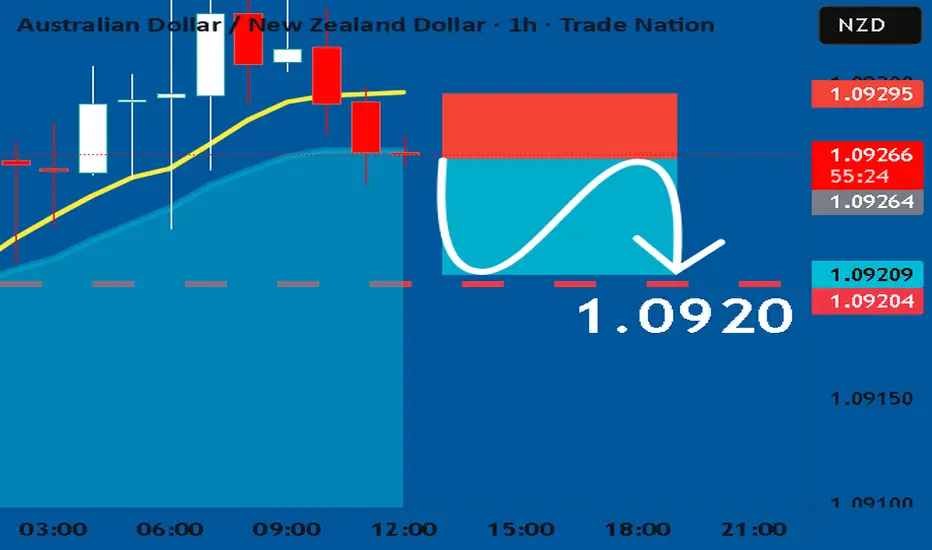
AUDNZD: Short Signal Explained
AUDNZD
- Classic bearish formation
- Our team expects fall
SUGGESTED TRADE:
Swing Trade
Sell AUDNZD
Entry Level - 1.0926
Sl - 1.0929
Tp - 1.0920
Our Risk - 1%
Start protection of your profits from lower levels
Disclosure: I am part of Trade Nation's Influencer program and receive a monthly fee for using their TradingView charts in my analysis.
❤️ Please, support our work with like & comment! ❤️
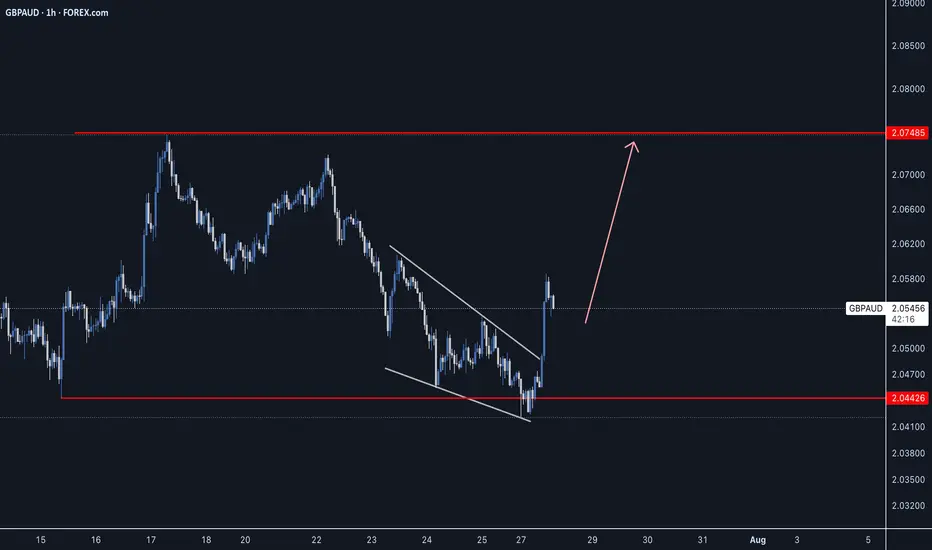
GBPAUD is Holding above the Support , All Eyes on BuyingHello Traders
In This Chart GBPAUD HOURLY Forex Forecast By FOREX PLANET
today GBPAUD analysis 👆
🟢This Chart includes_ (GBPAUD market update)
🟢What is The Next Opportunity on GBPJPY Market
🟢how to Enter to the Valid Entry With Assurance Profit
This CHART is For Trader's that Want to Improve Their Technical Analysis Skills and Their Trading By Understanding How To Analyze The Market Using Multiple Timeframes and Understanding The Bigger Picture on the Charts
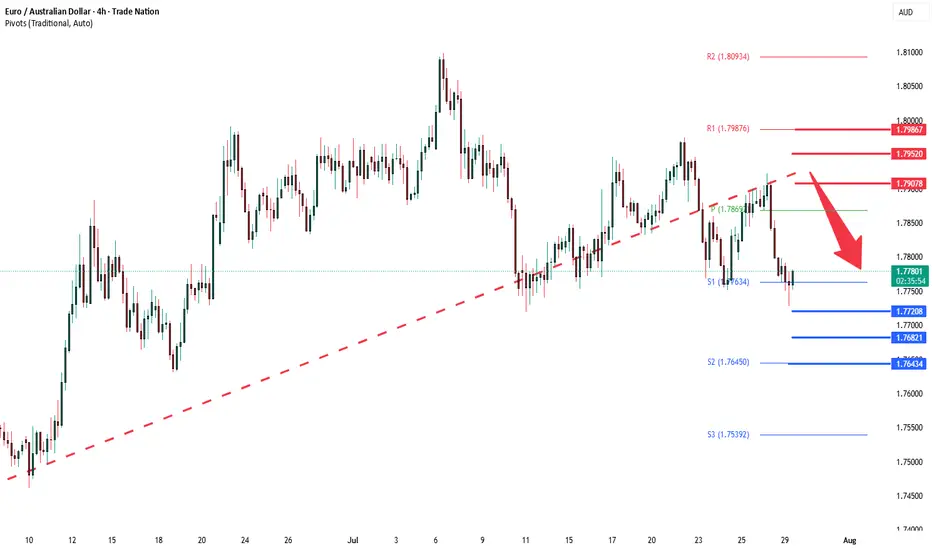
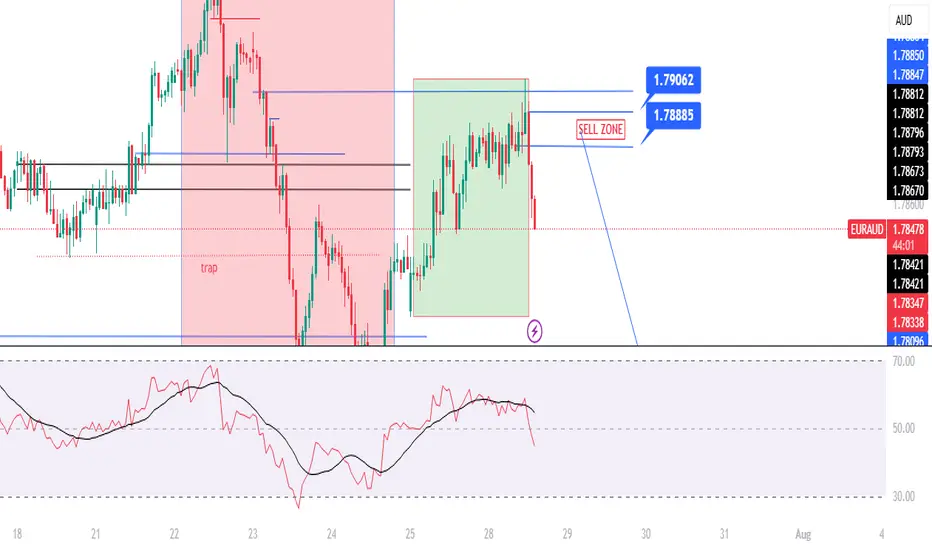
EURAUD oversold bounce backs capped at 1.7907The EURAUD pair is currently trading with a bearish bias, aligned with the broader range-bound sideway consolidation. Recent price action shows a retest of the resistance, (previous rising support)
Key resistance is located at 1.7907, a prior consolidation zone. This level will be critical in determining the next directional move.
A bearish rejection from 1.7907 could confirm the resumption of the downtrend, targeting the next support levels at 1.7720, followed by 1.7680 and 1.7643 over a longer timeframe.
Conversely, a decisive breakout and daily close above 1.7907 would invalidate the current bearish setup, shifting sentiment to bullish and potentially triggering a move towards 1.7950, then 1.7986.
Conclusion:
The short-term outlook remains bearish unless the pair breaks and holds above 1.7907. Traders should watch for price action signals around this key level to confirm direction. A rejection favours fresh downside continuation, while a breakout signals a potential trend reversal or deeper correction.
This communication is for informational purposes only and should not be viewed as any form of recommendation as to a particular course of action or as investment advice. It is not intended as an offer or solicitation for the purchase or sale of any financial instrument or as an official confirmation of any transaction. Opinions, estimates and assumptions expressed herein are made as of the date of this communication and are subject to change without notice. This communication has been prepared based upon information, including market prices, data and other information, believed to be reliable; however, Trade Nation does not warrant its completeness or accuracy. All market prices and market data contained in or attached to this communication are indicative and subject to change without notice.
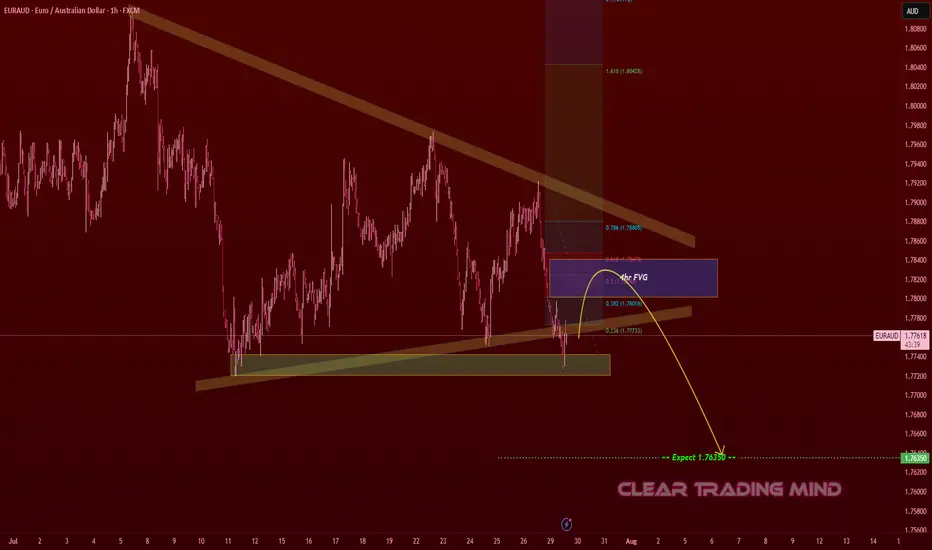
EURAUD Bearish Pullback – Short From 4hr FVG to 1.7635EURAUD – Bearish Outlook
- Key Zone: 4hr FVG (Fair Value Gap) near 1.7800 – 1.7820
- Fibonacci Levels: Retracement aligns with 0.5 – 0.618 zone, potential reaction point.
- Expected Target: 1.76350
Analysis:
1. Market shows a downward structure with lower highs and lower lows.
2. A possible pullback into the FVG zone could trigger a bearish continuation.
3. Confluence with Fibonacci levels strengthens the case for short trades targeting 1.76350.
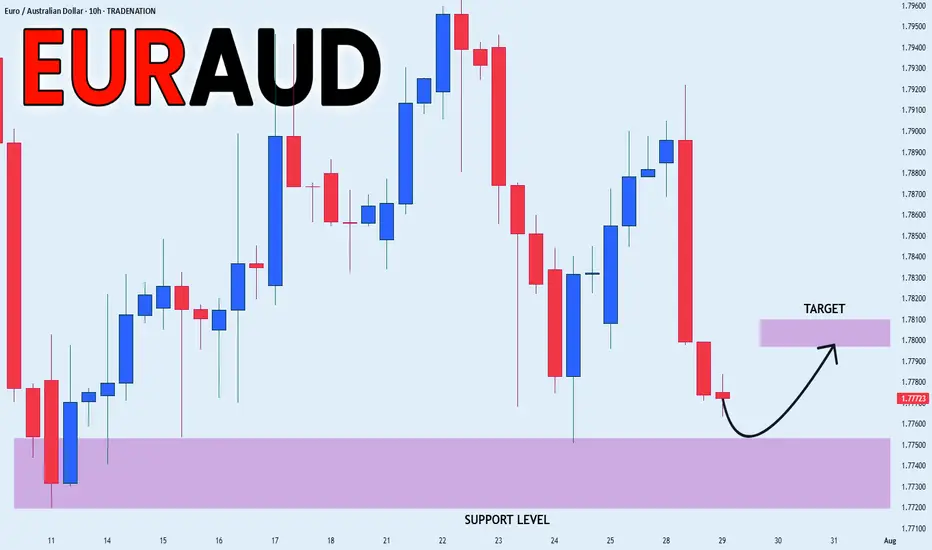
EUR_AUD LOCAL GROWTH AHEAD|LONG|
✅EUR_AUD will soon retest a key support level of 1.7750
So I think that the pair will make a rebound
And go up to retest the supply level above at 1.7800
LONG🚀
✅Like and subscribe to never miss a new idea!✅
Disclosure: I am part of Trade Nation's Influencer program and receive a monthly fee for using their TradingView charts in my analysis.
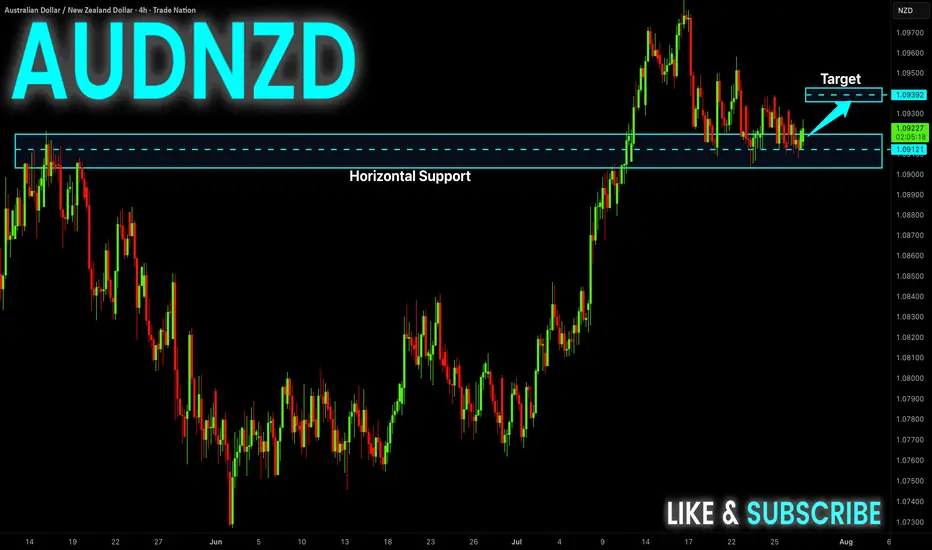
AUD-NZD Rebound Ahead! Buy!
Hello,Traders!
AUD-NZD made a retest
Of the wide horizontal support
Level again at 1.0909 and we
Are already seeing a bullish
Reaction so a local bullish
Rebound can be expected
Buy!
Comment and subscribe to help us grow!
Check out other forecasts below too!
Disclosure: I am part of Trade Nation's Influencer program and receive a monthly fee for using their TradingView charts in my analysis.
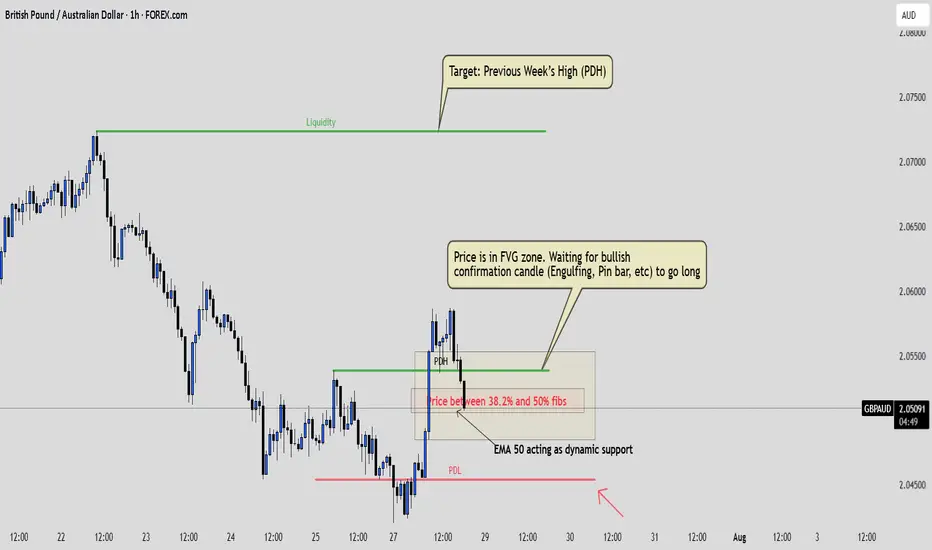
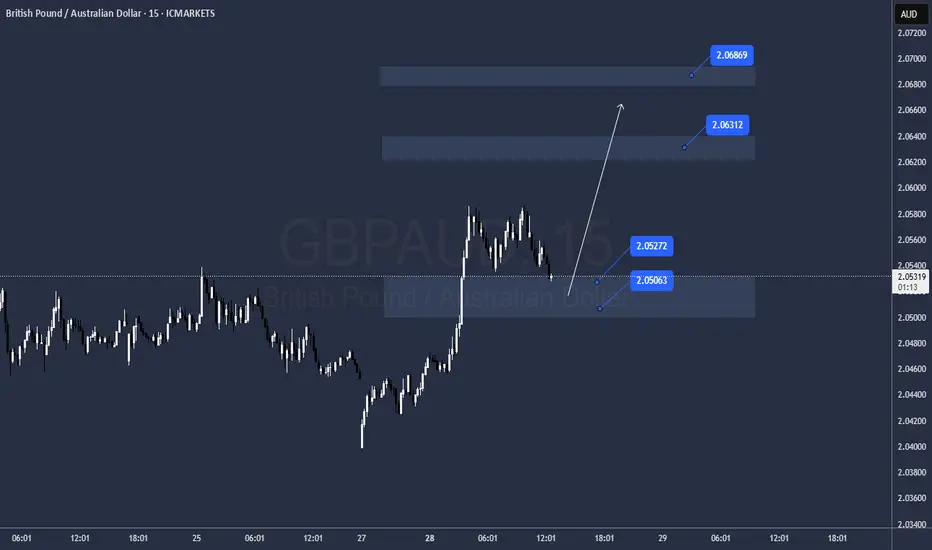
GBPAUD: Calm Before the ConfirmationPrice has swept liquidity below the previous week's low and broke structure to the upside. Now it’s retracing into a Fair Value Gap that aligns beautifully with the 38.2% to 50% Fibonacci zone.
I'm not in yet. I’m watching for a clean bullish confirmation, like an engulfing or strong rejection candle, before entering .
The 50 EMA supports the bias and helps confirm that I'm trading in the direction of the short-term momentum. If all aligns, I’ll be targeting the previous week’s high.
This is a reminder that being patient often protects your capital more than being early.
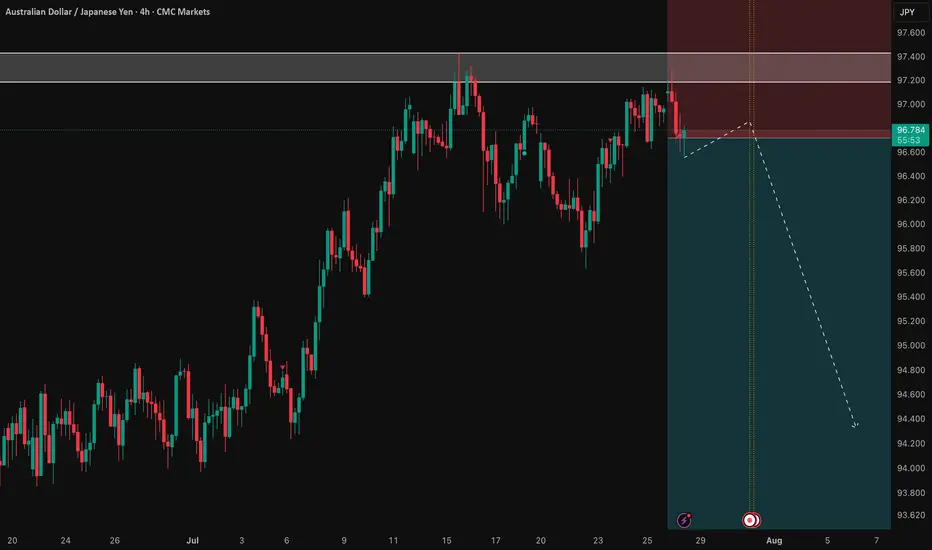
AUD/JPY: Fading the Rally at a Major Resistance ZoneWhile AUD/JPY has been in a clear uptrend, the rally is now approaching a significant technical ceiling where sellers have previously stepped in. We see a compelling opportunity for a counter-trend short, betting that this resistance level will hold and that the current bullish momentum is showing signs of exhaustion.
This trade is for those watching for a market turn, offering a well-defined risk-to-reward setup for a swing position.
🤔 The "Why" Behind the Short Setup
📰 The Fundamental Risk
The Australian Dollar is a "risk-on" currency, meaning it performs well when global markets are optimistic. The Japanese Yen, however, is a classic "safe-haven" asset that strengthens during times of uncertainty. With the upcoming high-impact Australian CPI data, any sign of economic weakness could disappoint the market, increase pressure on the RBA, and trigger a "risk-off" move that would benefit the Yen and send AUD/JPY lower.
📊 The Technical Ceiling
The chart tells a clear story. The price is currently testing a major resistance zone. Attempting to short near a strong ceiling like this provides a strategic entry to capture a potential trend reversal. We are essentially betting that the trend's multi-week momentum will stall and reverse from this key technical juncture.
✅ The High-Clarity SHORT Trade Setup
📉 Pair: AUD/JPY
👉 Direction: Short
⛔️ Entry: 96.716
🎯 Take Profit: 92.080
🛑 Stop Loss: 98.907
Rationale: This setup plays for a significant swing move. The wide stop loss is designed to withstand volatility from news events, while the deep take profit targets a full reversal back to major support levels seen earlier in the year.
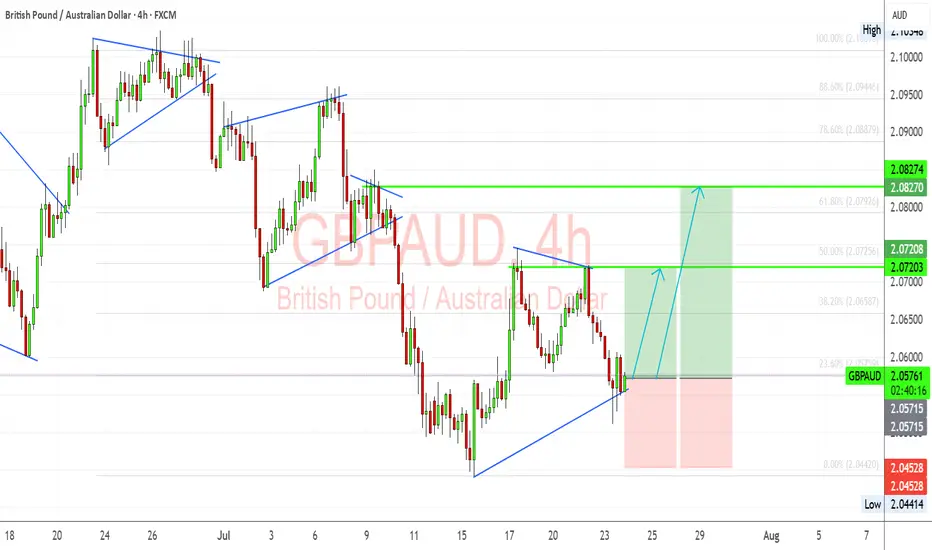
GBP/AUD Trade Setup – Bullish Flag Breakout in PlayGBPAUD has formed a clean bullish flag structure after a significant impulsive move upward. Following the correction, we’re now testing breakout levels with clear Fibonacci confluence and bullish structure support around 2.0560. I'm anticipating a push toward the next resistance levels if buyers defend this trendline.
🔎 Technical Highlights (My View):
Bullish Flag Pattern: The corrective flag has broken to the upside and is being retested. This suggests a possible continuation of the bullish trend.
Fibonacci Support: Price bounced near the 23.6% retracement of the previous bullish leg, which acts as a minor but effective support in trending moves.
Bullish Trendline Holding: The ascending trendline from the July lows continues to act as dynamic support. This shows sustained buyer interest.
Target Zones:
TP1: 2.0720 – aligns with 50% retracement and recent structure.
TP2: 2.0827 – aligns with 78.6% retracement and past resistance.
SL: Below 2.0450 to invalidate the setup.
🏦 Fundamental Context:
GBP Strength: The Bank of England remains more hawkish than the RBA. UK inflation data remains sticky, and traders are still pricing in the potential for another hike if services inflation remains elevated.
AUD Weakness: AUD is under pressure due to soft labor market data and declining commodity demand from China. RBA minutes also struck a cautious tone, which weighs on the Aussie.
China Risk: AUD is sensitive to Chinese sentiment. Current trade and tariff tensions are adding indirect bearish pressure to the AUD.
⚠️ Risks to My Setup:
If Aussie labor or CPI data surprises to the upside, AUD could regain strength.
UK economic data deterioration (e.g., services PMI, wage inflation) could weaken GBP.
Break below 2.0450 would invalidate the bullish setup and suggest potential range continuation.
📅 Upcoming Catalysts to Watch:
UK Retail Sales – A strong print supports GBP continuation.
AU CPI (Trimmed Mean) – Any upside surprise could limit AUD downside.
China Industrial & Services PMI (if released soon) – indirect AUD mover.
⚖️ Summary – Bias & Trade Logic
I’m currently bullish GBP/AUD, expecting a continuation of the prior uptrend now that price has broken and retested the flag structure. Fundamentally, GBP is supported by relatively hawkish BoE expectations, while AUD remains pressured by RBA caution and China-linked macro weakness. My bias stays bullish as long as the trendline holds and Aussie data doesn’t surprise significantly.
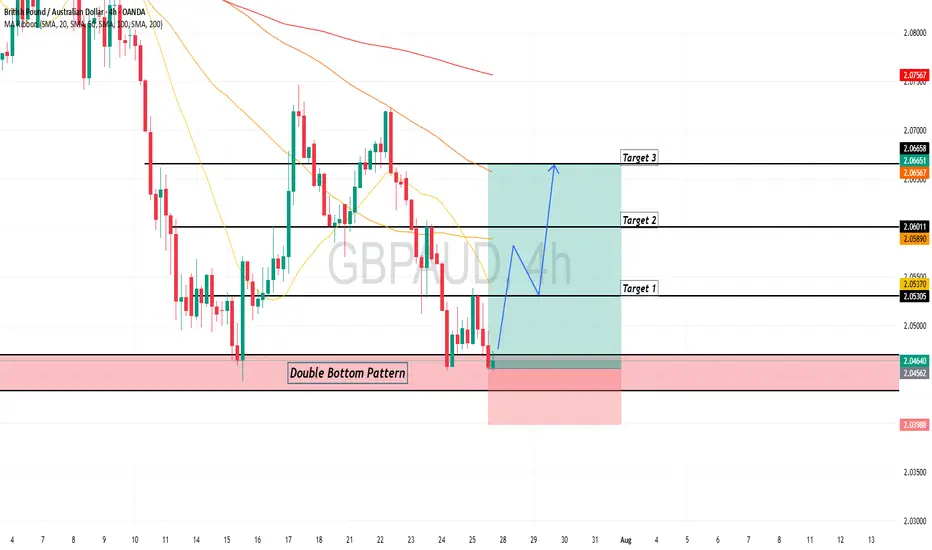
GBPAUD - Bullish Price Action GBPAUD broke out of a reversal structure with a double bottom confluence. Expecting further growth for a long opportunity.
Good Luck
EURAUD | One Kiss from 1.7906 and I’m In – TP 140 Pips!The big picture of EURAUD is SELL possible up to 1.7750
Spot that H1 BUY range?
Inside it, there is conflict. A sneaky SELL range form inside it after rejection H4 BLUE LINE.
See that top blue line at 1.7916?
It got a gentle kiss from the H4 candle (REJECTION).
Then H1 already whispered, "a sweet breakout"!
📌LONG STORY SHORT, I'M SELL AROUND 1.7888 - 7906
If H4 comes and kisses one of the line (just a touch and wick), I’m SELLING — no more playing hard to get. 😘
Other wise, I’ll quietly cry in the corner
TP? 1.7750 — that’s a sweet 140-candlelit dinner!
WISH ME LUCK...!!!
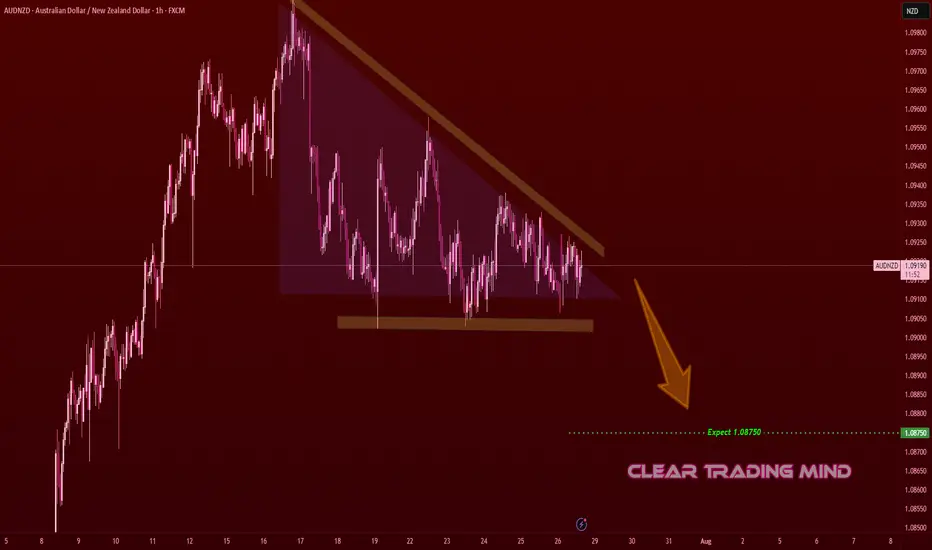
AUDNZD Descending Triangle – Bearish Breakout SetupOn the 1-hour chart, AUDNZD is forming a descending triangle 📐, a bearish continuation pattern.
- Horizontal support is holding but getting repeatedly tested
- Lower highs indicate selling pressure
Plan:
- Break and close below support may trigger a bearish continuation
- Target: 1.08750 🎯 (≈ 35 pips from current price)
- Invalidation if price breaks above descending trendline and holds
Reasoning:
- Descending triangle often leads to breakdowns when tested multiple times
- Lower highs show sellers gaining control
- Short bias remains as long as price respects the triangle resistance
(Personal chart study, not financial advice)
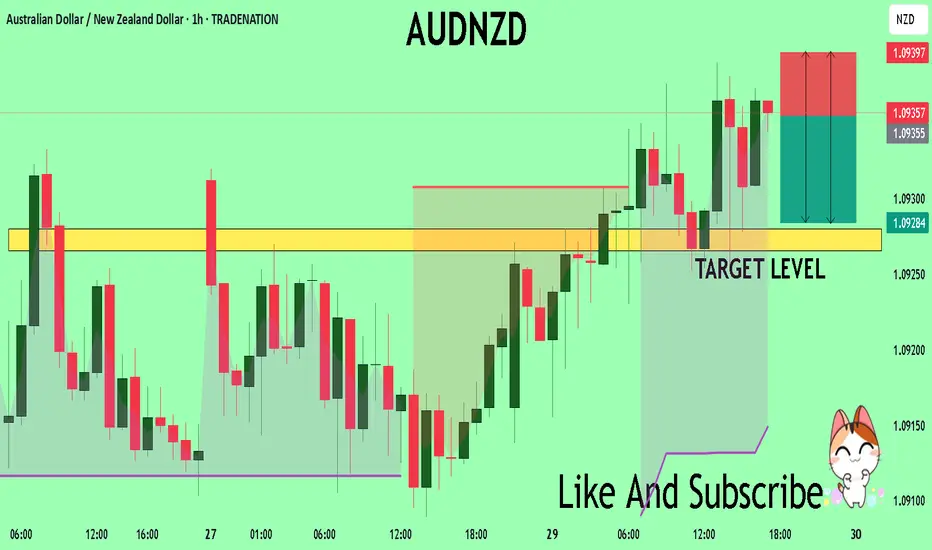
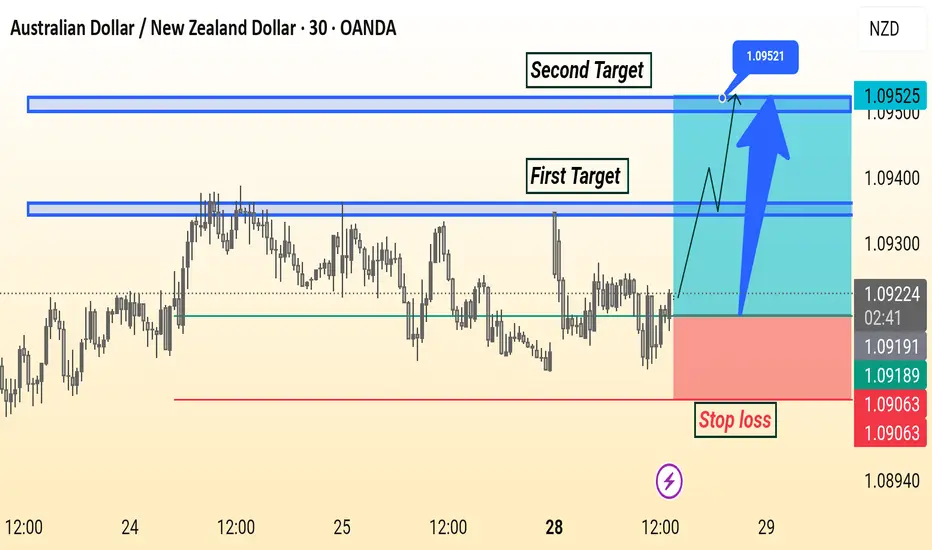
AUD/NZD Analysis is Ready Move Will Be Fly This AUD/NZD 30-minute chart shows a bullish setup with entry around 1.09216. The first target is near 1.09400 and the second target is at 1.09521. A stop loss is placed below support at 1.09063. The analysis suggests a potential upward move after a breakout.
GBPAUD Is Going Up! Long!
Here is our detailed technical review for GBPAUD.
Time Frame: 6h
Current Trend: Bullish
Sentiment: Oversold (based on 7-period RSI)
Forecast: Bullish
The market is on a crucial zone of demand 2.055.
The oversold market condition in a combination with key structure gives us a relatively strong bullish signal with goal 2.070 level.
P.S
Please, note that an oversold/overbought condition can last for a long time, and therefore being oversold/overbought doesn't mean a price rally will come soon, or at all.
Disclosure: I am part of Trade Nation's Influencer program and receive a monthly fee for using their TradingView charts in my analysis.
Like and subscribe and comment my ideas if you enjoy them!

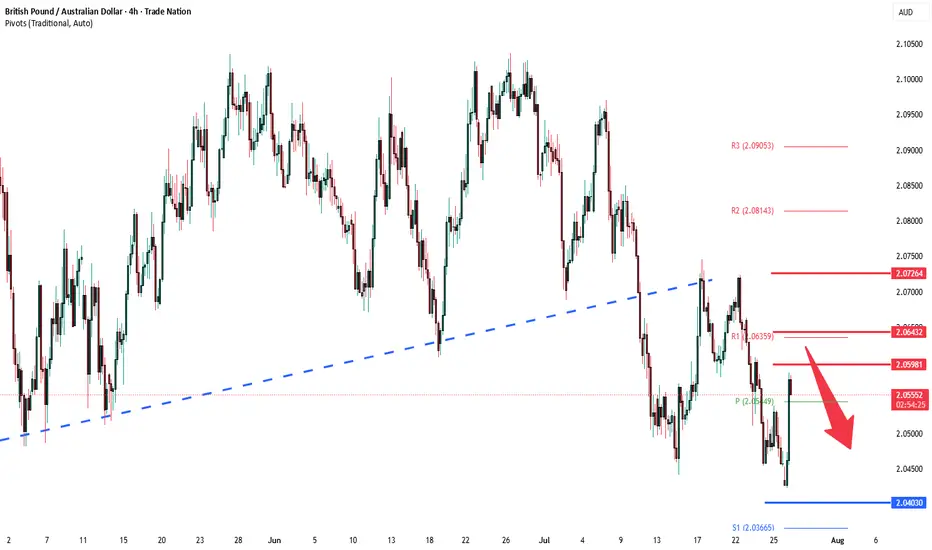
GBPAUD oversold rally capped at 2.0600 resistanceThe GBPAUD pair is currently trading with a bearish bias, aligned with the broader downward trend. Recent price action shows a retest of the resistance, suggesting a temporary relief rally within the downtrend.
Key resistance is located at 2.0600, a prior consolidation zone. This level will be critical in determining the next directional move.
A bearish rejection from 2.0600 could confirm the resumption of the downtrend, targeting the next support levels at 2.0400, followed by 2.0350 and 2.0290 over a longer timeframe.
Conversely, a decisive breakout and daily close above 2.0600 would invalidate the current bearish setup, shifting sentiment to bullish and potentially triggering a move towards 2.0645, then 2.0730.
Conclusion:
The short-term outlook remains bearish unless the pair breaks and holds above 2.0600. Traders should watch for price action signals around this key level to confirm direction. A rejection favours fresh downside continuation, while a breakout signals a potential trend reversal or deeper correction.
This communication is for informational purposes only and should not be viewed as any form of recommendation as to a particular course of action or as investment advice. It is not intended as an offer or solicitation for the purchase or sale of any financial instrument or as an official confirmation of any transaction. Opinions, estimates and assumptions expressed herein are made as of the date of this communication and are subject to change without notice. This communication has been prepared based upon information, including market prices, data and other information, believed to be reliable; however, Trade Nation does not warrant its completeness or accuracy. All market prices and market data contained in or attached to this communication are indicative and subject to change without notice.
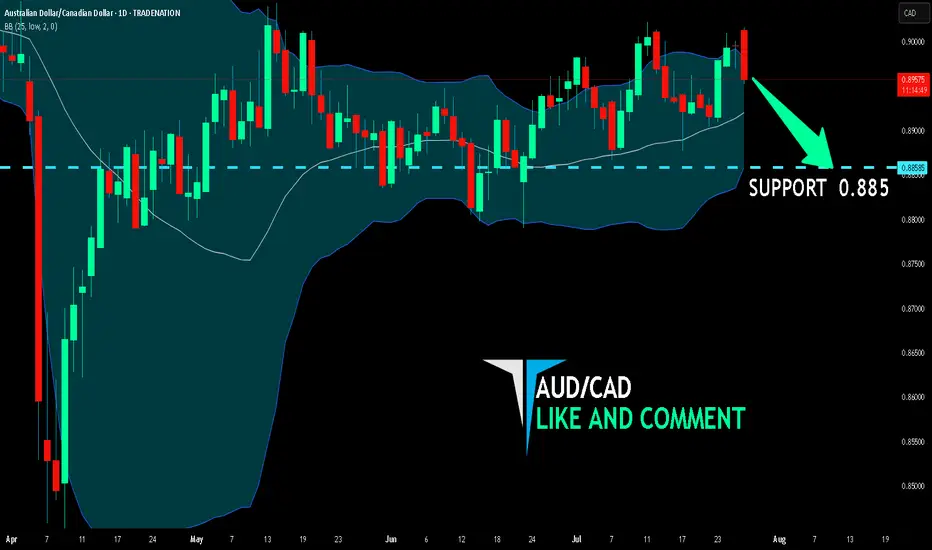
AUD/CAD SELLERS WILL DOMINATE THE MARKET|SHORT
Hello, Friends!
We are now examining the AUD/CAD pair and we can see that the pair is going up locally while also being in a uptrend on the 1W TF. But there is also a powerful signal from the BB upper band being nearby, indicating that the pair is overbought so we can go short from the resistance line above and a target at 0.885 level.
Disclosure: I am part of Trade Nation's Influencer program and receive a monthly fee for using their TradingView charts in my analysis.
✅LIKE AND COMMENT MY IDEAS✅
AUD/CAD’s Big Move: Don’t Sleep on This Breakout Setup!Hey traders, Skeptic from Skeptic Lab here! 🔥 While everyone’s freaking out over interest rate news and Non-Farm Employments , AUD/CAD ’s stealing the show on the daily time frame.
📉Post-tariff crash, it’s rebounding strong. A daily resistance break could kick off a major uptrend. Use RSI overbought/oversold ( linked in my TradingView article ) to confirm momentum.
👀Beware of fakeouts this week—volatility’s high! Trade smart, keep risk tight, and don’t FOMO. Share your thoughts in the comments, boost if it helps <3 🩵

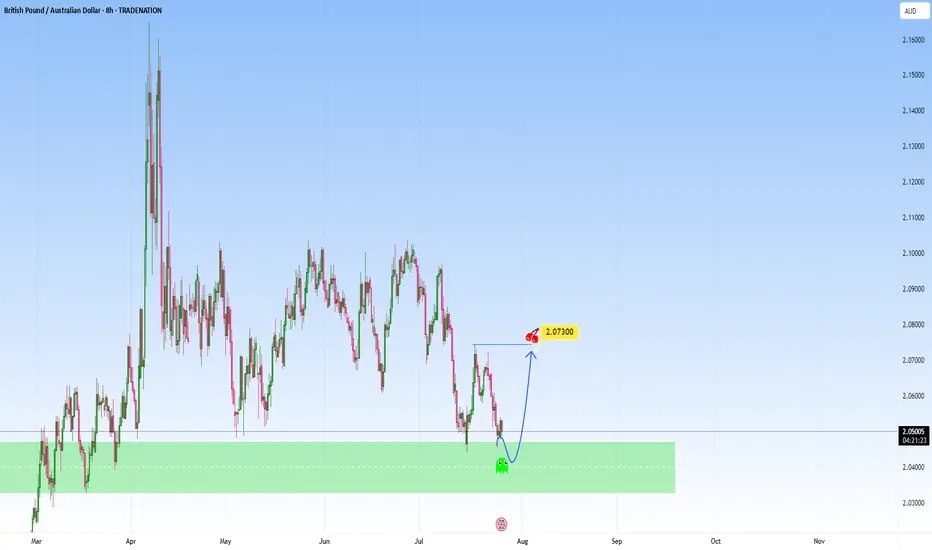
GBPAUD: Possible bounce at supportI am watching for a possible reversal GBPAUD, expecting a rejection with a upside target at around 2.073.
This area is where it can become a decision point, either price finds support and bounces, or it breaks below, and the move can start to extend lower.
Just sharing my thoughts for the charts, this isn’t financial advice. Always confirm your setups and manage your risk properly.
Disclosure: I am part of Trade Nation's Influencer program and receive a monthly fee for using their TradingView charts in my analysis.