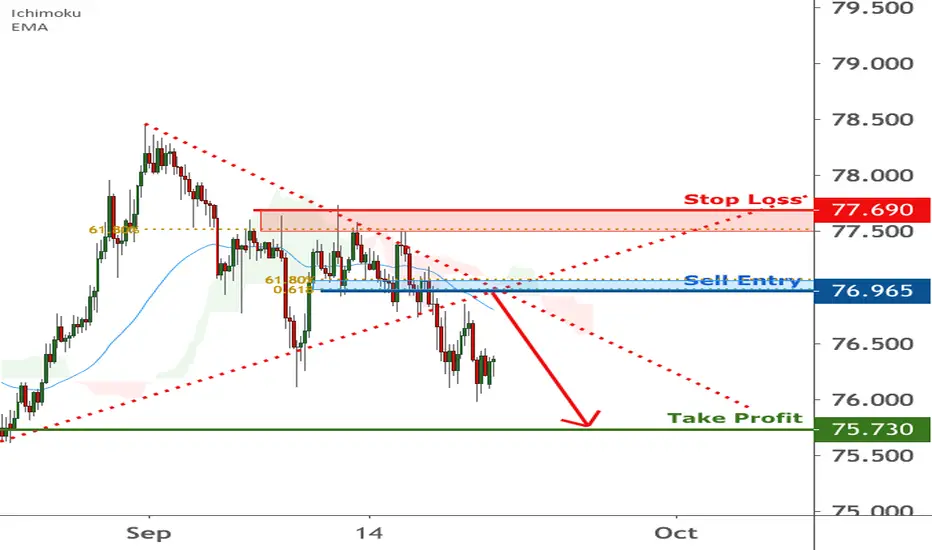
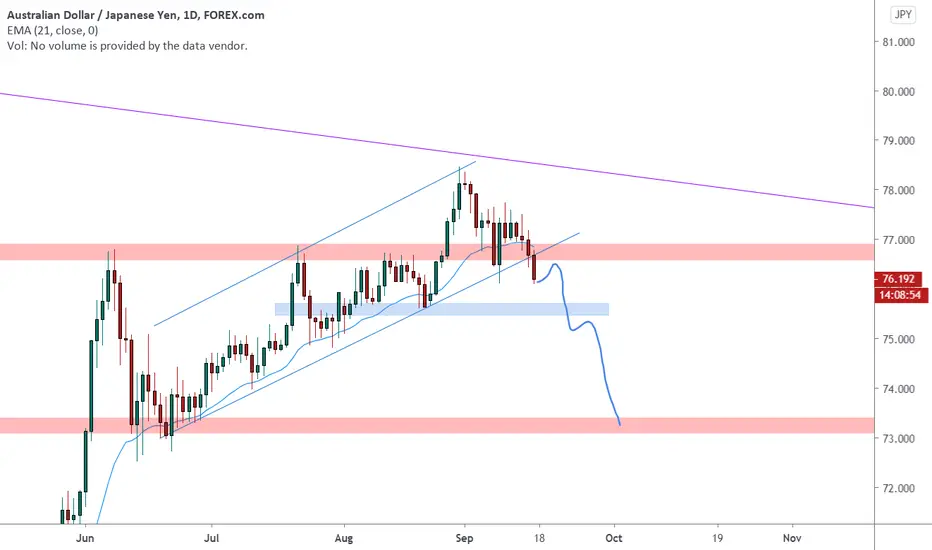
AUDJPY testing sell entry , further drop expected !AUDJPY is testing the descending trendline and the sell entry , further drop expected !
Thanks everyone for tuning in to today's analysis . If any part of this video is unclear, please ask me for in the comment section below. If you found today's video useful in any way, please "like" this video and leave a comment on what currency pair you'd like me to analyze next too.
Until next time, see ya!
Aud-jpy
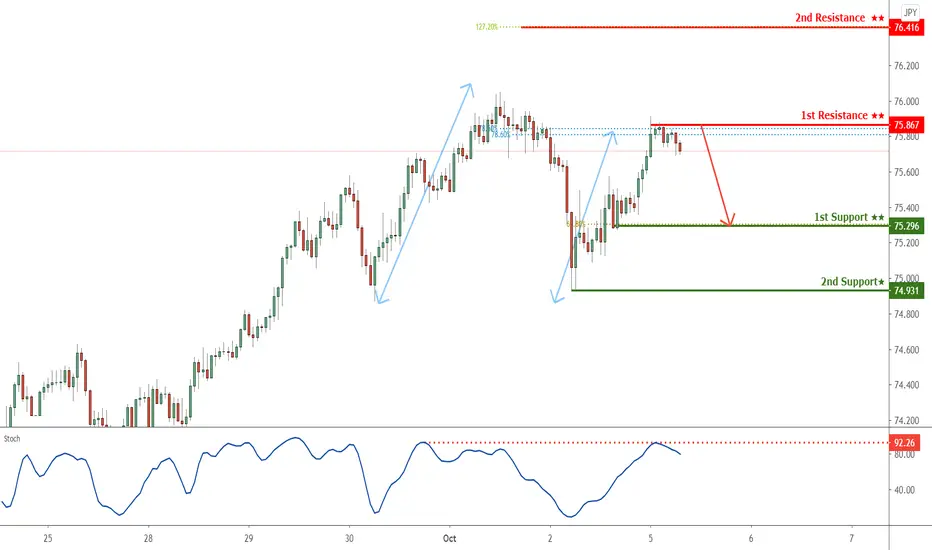
AUDJPY reversing from 1st resistance, further drop expected!
Description :
AUDJPY reversing from 1st resistance where the horizontal swing high ,78.6% fib retracement and 78.6% fib extension are. Stochastics also show that price is reaching resistance.
Trading Recommendation
Entry: 75.867
Reason for Entry:
horizontal swing high ,78% fib retracement and 78.6% fib extension
Take Profit: 75.296
Reason for Take Profit:
61.8% fib retracement
Stop Loss: 76.416
Reason for Stop Loss:
127% fib retracement
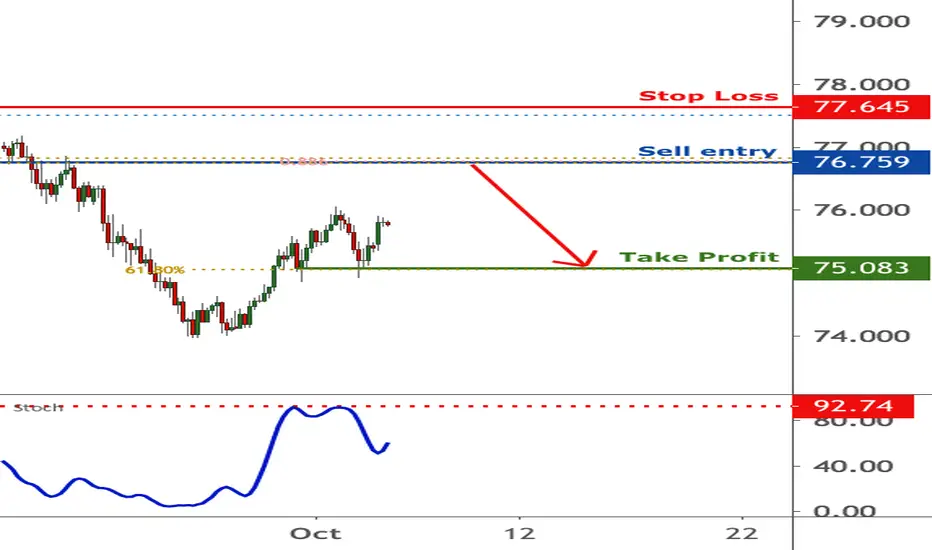
AUDJPY is approaching resistance, potential reversal |5 Oct 2020Price is approaching key resistance where we could see a reversal below this level.

AUDJPY is approaching resistance, potential reversal |5 Oct 2020Price is approaching key resistance where we could see a reversal below this level.
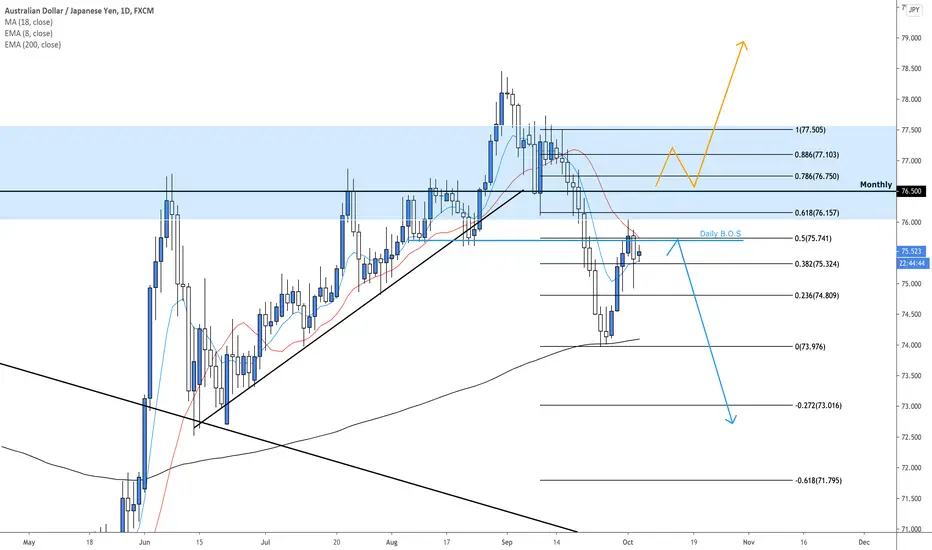
AUDJPY Daily Analysis October 4th, 2020AUDJPY Short idea
Weekly Trend: Bearish
Daily Trend: Bearish
Trade scenario 1: Price action continues with the bearish break and forms a lower high below our daily structure. Look to enter short on strong bearish setups, target lower toward key support and negative fib levels.
Trade scenario 2: Price action reverses and breaks through our monthly resistance at 76.500. Look for a confirmed higher low followed by strong bullish setups to enter on.
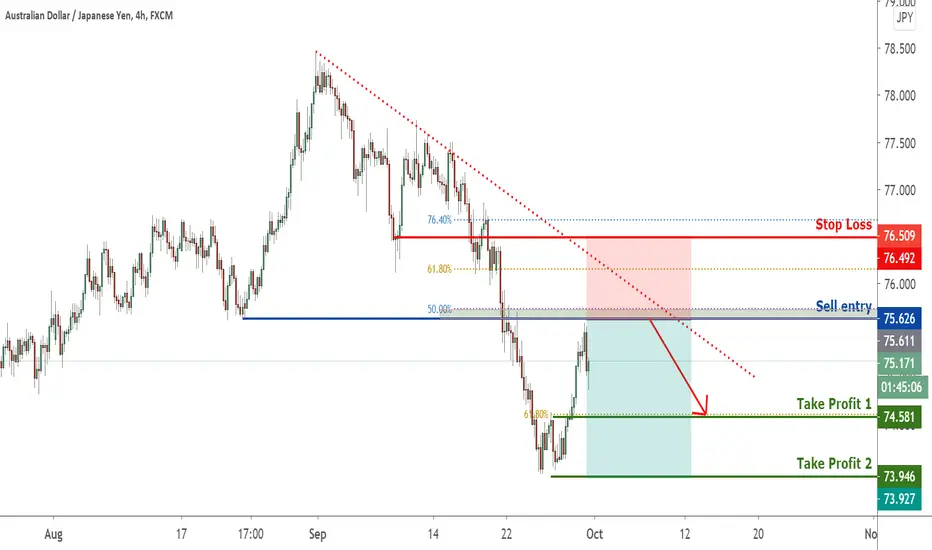
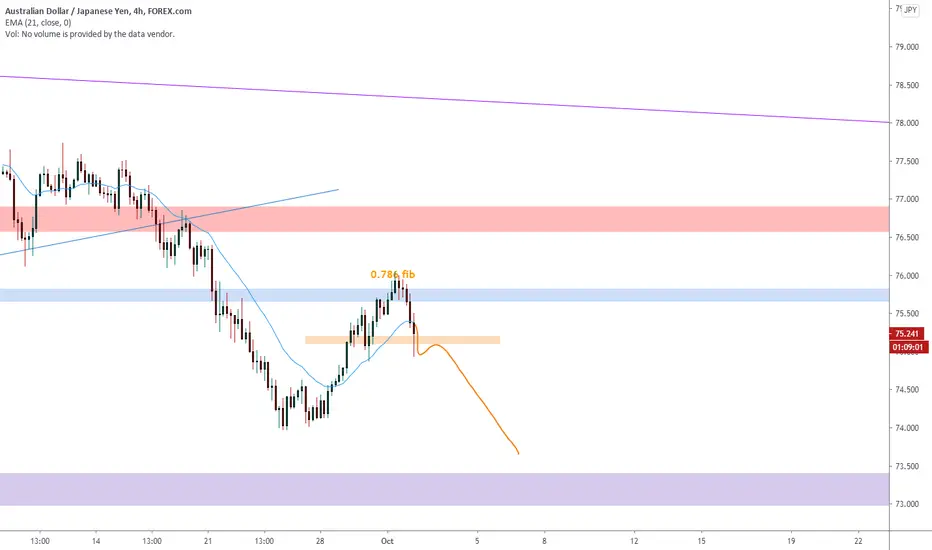
AUDJPY can test the monthly support? 🦐AUDJPY on the daily chart hit the ema and turn back for a possible new bearish leg.
On the 4h chart the price hit the 0.786 fib retracement over a daily resistance.
IF the price will manage to break and close below the 4h structure we can set a nice short order according to Plancton strategy.
–––––
Follow the Shrimp 🦐
Here is the Plancton0618 technical analysis, please comment below if you have any question.
The ENTRY in the market will be taken only if the condition of Plancton0618 strategy will trigger.
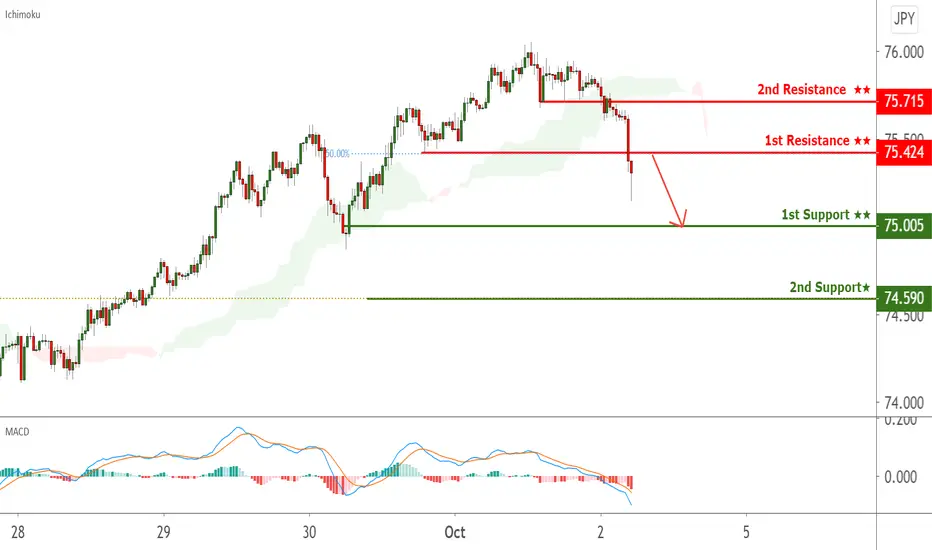
AUDJPY testing 1st resistance , further drop expected ! AUDJPY broke blow the 50% fib retracement where we see as a downside confirmation. A further downside could be opened from here towards 1st support. MACD is also showing signs of bearishness.
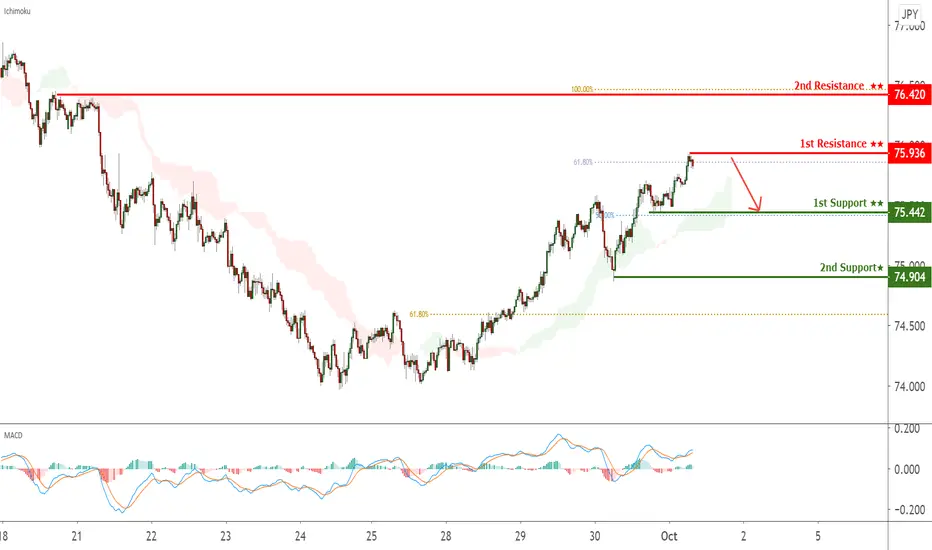
AUDJPY reversing from 1st resistance , further drop expected! AUDJPY is reversing from 1st resistance , further drop expected!
AUDJPY testing sell entry , further drop expected ! AUDJPY is testing the descending trendline and the sell entry , further drop expected !
Thanks everyone for tuning in to today's analysis . If any part of this video is unclear, please ask me for in the comment section below. If you found today's video useful in any way, please "like" this video and leave a comment on what currency pair you'd like me to analyze next too.
Until next time, see ya!

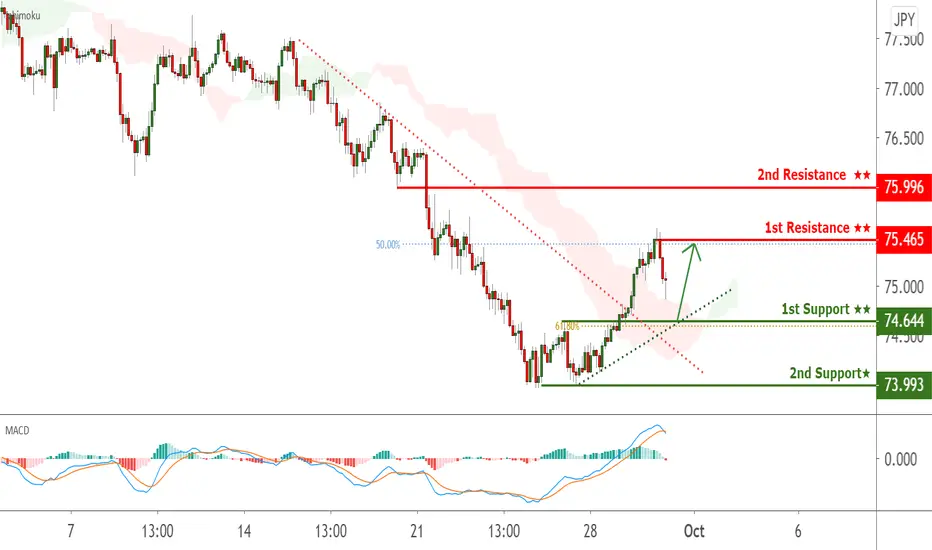
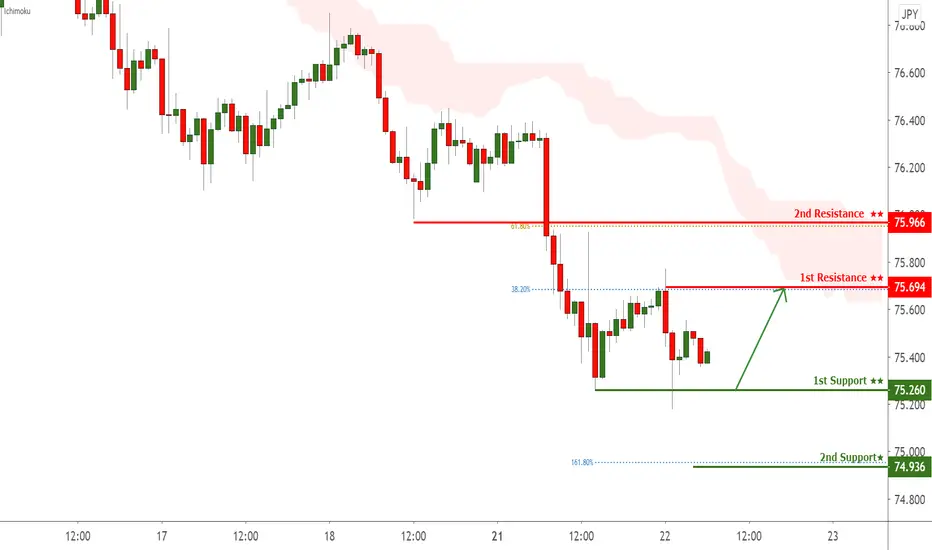
AUDJPY pulling back to the trendline, potential for a bounce !AUDJPY is pulling back to the ascending trendline and 1st support where the 61.8% fib retracement is.
Price could bounce there towards our 1st resistance. Ichimoku also indicates that further upside could be seen from here.
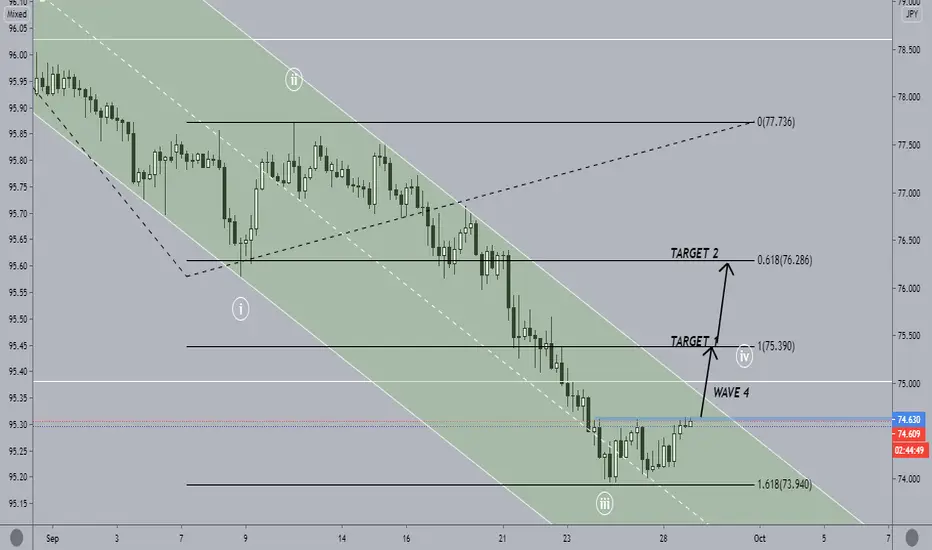
WAVE 4 TARGETSWAVE 3 ENDED AT 1.618 FIB LEVEL. WAVE 4 STARTED. TARGETS ARE 75.39 AND 76.28. SEE CHART.
AUDJPY Double BottomDouble bottom confirmed, out of RSI oversold condition
Bulls wait for retest
Watch equities for a drop

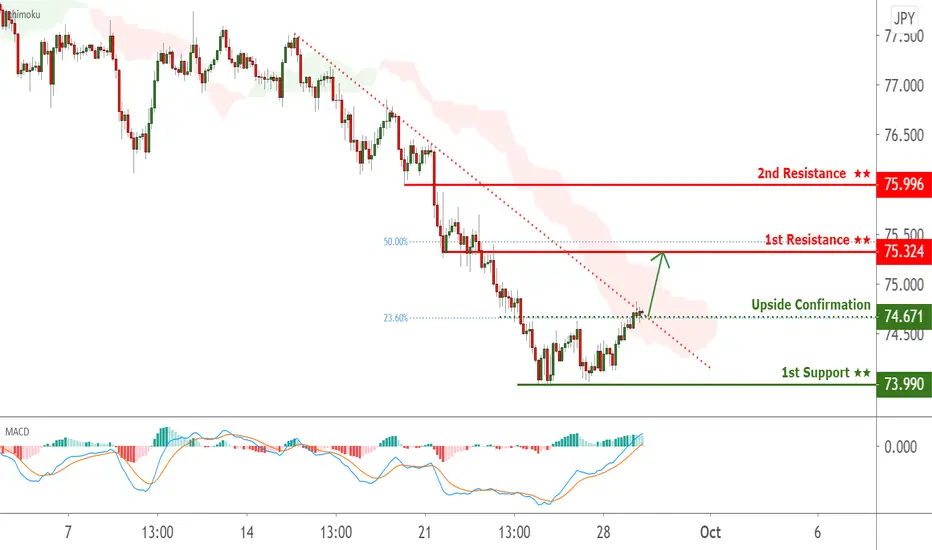
AUDJPY breakout, more upside ! AUDJPY is testing upside confirmation, and if it closes above this level, it could open up more upside from there ! If price could break
above the descending trendline, it could also indicate more upside from there. MACD signals more bullishness from there.
AUDJPY 4hour Analysis September 27th, 2020AUDJPY Short idea
Trend: Bearish
Trade scenario 1: Price action pulls back to form structure at the 38.2% fib level and key resistance zone (75.00). Look for a confirmed reversal at this level and enter on strong bearish setups. Target lower toward key support and negative fib levels.
Trade scenario 2: Price action breaks resistance at 75.00 and forms a higher low confirming a 4hour transition. Look to enter long on strong bullish setups confirming the higher low. Target higher toward key resistance.

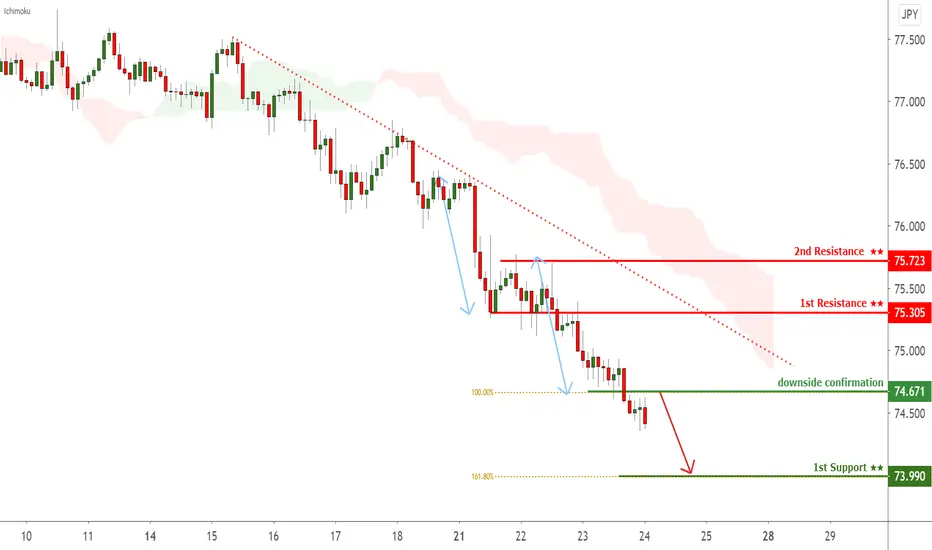
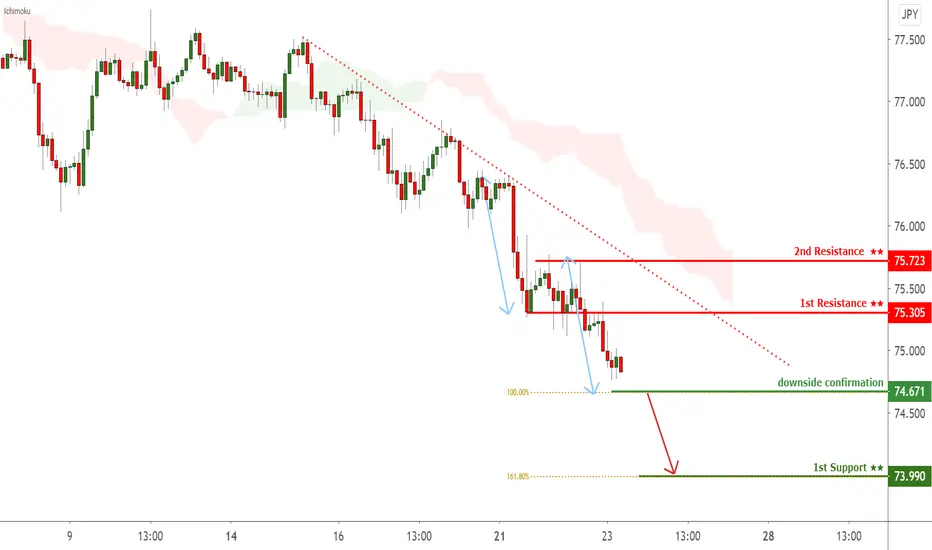
AUDJPY testing downside confirmation, potential for further dropAUDJPY is testing our downside confirmation at 74.67 where the 100% fib extension is. Price could reverse from here towards our 1st support. Take caution that Ichimoku signals that further downside could come.
AUDJPY in a bearish momentum 🦐AUDJPY after getting close to the monthly descending trendline (purple) ebds the bullish trend and broke below the weekly support.
The price currently broke the uptrending channel.
According to Plancton strategy at the retest we can set a nice short order.
–––––
Follow the Shrimp 🦐
Here is the Plancton0618 technical analysis, please comment below if you have any question.
The ENTRY in the market will be taken only if the condition of Plancton0618 strategy will trigger.
AUDJPY testing downside confirmation, potential for further dropAUDJPY is testing our downside confirmation at 74.67 where the 100% fib extension is. Price could open up more downside from here if it closes below the downside confirmation. Take caution that Ichimoku signals that further downside could come.
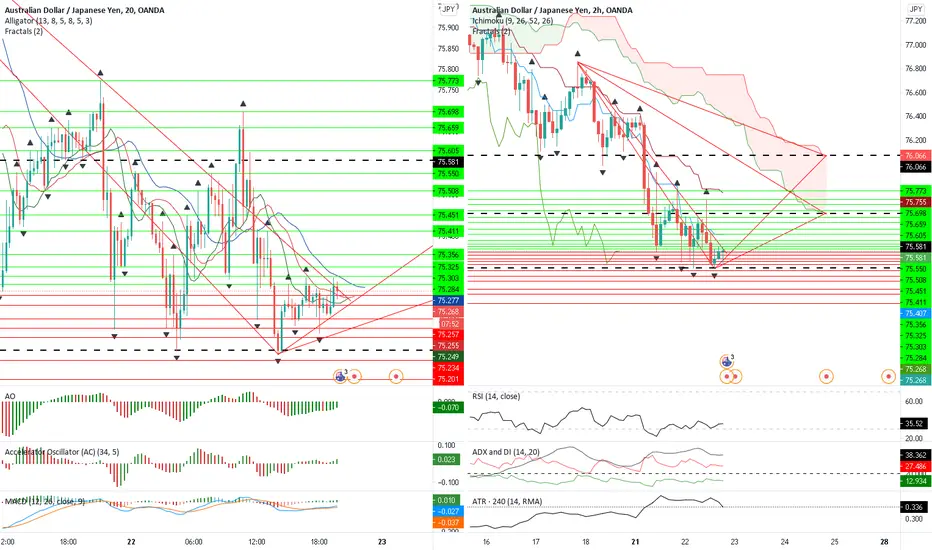
Fractales para ser mas agresivosMe parece super eficaz el uso de fractales para tomar posiciones agresivas en la dirección que sea del precio.- Estoy aprendiendo muchísimo con los indicadores de Bill Williams y me parece extremadamente eficaz usar los tres indicadores creados por J. Welles Wilder ...aun me cuesta confiar eso si en el parabolic SAR pero ahí le daré una oportunidad nuevamente.
AUDJPY testing 1st support, potential for a bounce! AUDJPY is testing our 1st suppor at 75.26 where the horizontal swing low is. Price could touch 1st support and bounce from there. Take caution that Ichimoku signals that further downside could come.
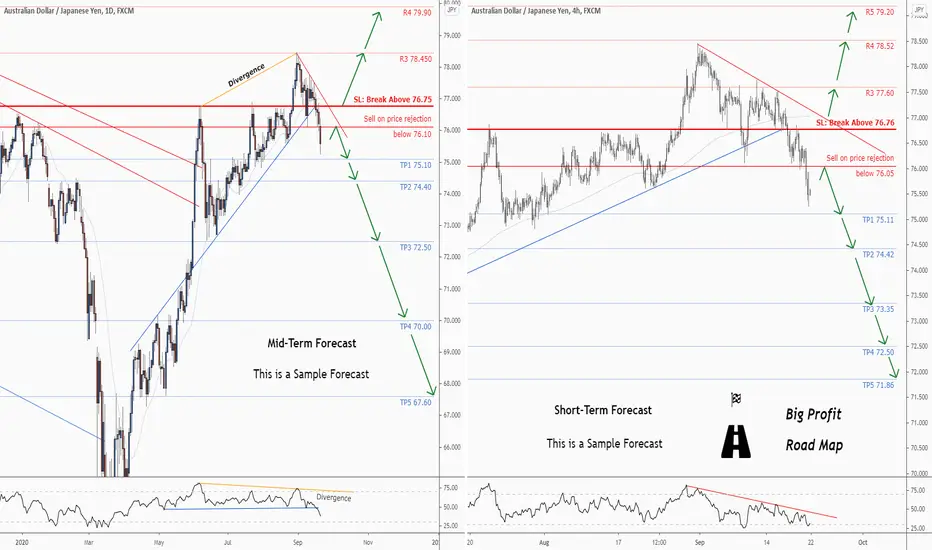
Two Sell opportunities on this chart for AUDJPYMid-Term Forecast
Trading suggestion:
. There is still a possibility of temporary retracement to suggested resistance line (76.1). if so, traders can set orders based on Price Action and expect to reach short-term targets.
Technical analysis:
. AUDJPY is in a range bound and the beginning of downtrend is expected.
. The price is below the 21-Day WEMA which acts as a dynamic resistance.
. The RSI is at 40.
Take Profits:
TP1= @ 75.10
TP2= @ 74.40
TP3= @ 72.50
TP4= @ 70.00
TP5= @ 67.60
SL: Break Above R2
---------------------------------------------------------------------------------
Short-Term Forecast
Trading suggestion:
. There is still a possibility of temporary retracement to suggested resistance line (76.05). if so, traders can set orders based on Price Action and expect to reach short-term targets.
Technical analysis:
. AUDJPY is in a range bound and the beginning of downtrend is expected.
. The price is below the 21-Day WEMA which acts as a dynamic resistance.
. The RSI is at 30.
Take Profits:
TP1= @ 75.11
TP2= @ 74.42
TP3= @ 72.50
TP4= @ 72.50
TP5= @ 71.86
SL: Break Above R2
❤️ If you find this helpful and want more FREE forecasts in TradingView
. . . . . Please show your support back,
. . . . . . . . Hit the 👍 LIKE button,
. . . . . . . . . . . Drop some feedback below in the comment!
❤️ Your Support is very much 🙏 appreciated! ❤️
💎 Want us to help you become a better Forex trader?
Now, It's your turn!
Be sure to leave a comment let us know how do you see this opportunity and forecast.
Trade well, ❤️
ForecastCity English Support Team ❤️
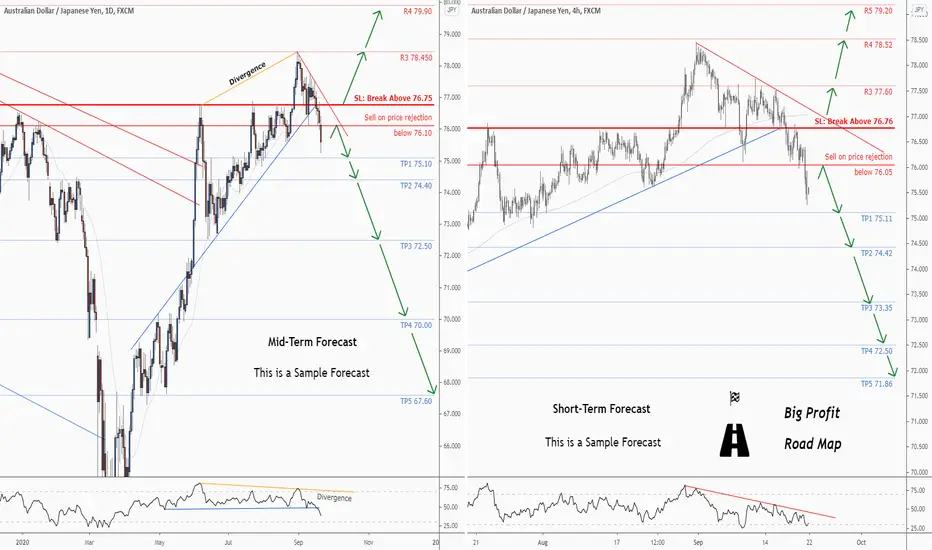
AUDJPY is approaching resistance | 21 Sep 2020Price is approaching a key resistance level where we could see a reversal from here.

AUDJPY is approaching resistance | 21 Sep 2020Price is approaching a key resistance level where we could see a reversal from here.