AUD/NZD Heist: Bullish Loot Ready for the Taking?🔥 AUD/NZD "Aussie vs Kiwi" Forex Bank Heist Plan (Swing/Day Trade) 🤑💰
Dear Thief Traders & Money Snatchers, 🐱👤💸
Get ready to crack the vault with our Thief Trading Style! This is the ultimate heist plan for the AUD/NZD, driven by slick technicals and sneaky fundamentals. We’re going BULLISH to steal the loot! 💪🚨
🏦 The Heist Plan: Bullish Breakout
Asset: AUD/NZD "Aussie vs Kiwi" 🌏
Strategy: Layering multiple buy limit orders for maximum loot! 🎯
Timeframe: Swing/Day Trade ⏰
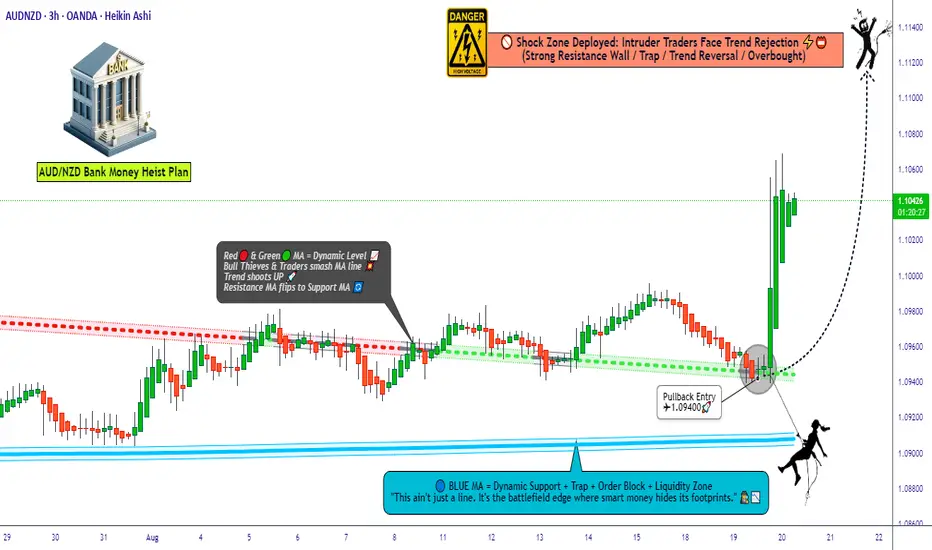
📈 Entry: Crack the Vault Wide Open!
Swipe the loot at these levels using the Thief Layering Strategy! Place multiple buy limit orders:
1.10400 💰
1.10300 💰
1.10200 💰
1.10100 💰
Pro Tip: Add more layers based on your risk appetite and market recon! 🕵️♂️
Enter at any price level if you spot a clean pullback or swing low on a 15M/30M timeframe. The vault’s open, so don’t hesitate! 🚪💥
🛑 Stop Loss: Thief’s Escape Route
Thief SL: Set at 1.09800 (recent swing low on 4H timeframe). 🛡️
OG Advice: Adjust your SL based on your lot size, risk tolerance, and number of layered entries. Stay sharp, thieves! 🔍
🎯 Target: Escape Before the Electric Fence!
Take Profit: 1.11200 ⚡️
Hit the target and escape with the cash before the market’s high-voltage fence zaps you! 💨💰
📰 Why This Heist Works
Bullish Momentum: AUD/NZD is primed for a breakout, backed by solid technicals and fundamentals. 📊
Key Drivers: Check the latest COT Report, Macro Outlook, Sentimental Analysis, and Intermarket Trends for confirmation. Stay ahead of the game! 🗞️
Market Edge: Our layering strategy maximizes entries while dodging traps set by bearish robbers. 🕸️
⚠️ Heist Alerts: News & Risk Management
News Releases: Avoid new trades during high-impact news to dodge volatility spikes. 🚨
Protect the Loot: Use trailing stop-losses to lock in profits and keep your positions safe. 🔒
Stay Agile: Markets move fast—update your plan with real-time data to avoid getting caught! ⏳
💥 Boost the Heist!
Hit the Boost Button to power up our Thief Trading crew! 🚀 Every like and view strengthens our robbery squad. Let’s make bank daily with the slickest trading style in the game! 🤑💪
Stay sneaky, stay sharp, and I’ll catch you at the next heist! 🐱👤🔥
Audnzdbulish
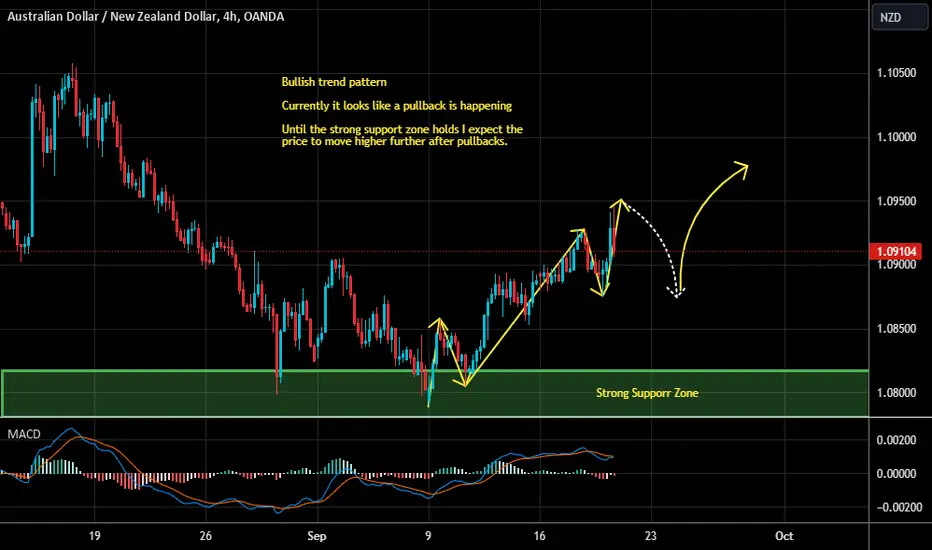
AUDNZD - Looking To Buy Pullbacks In The Short TermH4 - Bullish trend pattern
Currently it looks like a pullback is happening
Until the strong support zone holds I expect the price to move higher further after pullbacks.
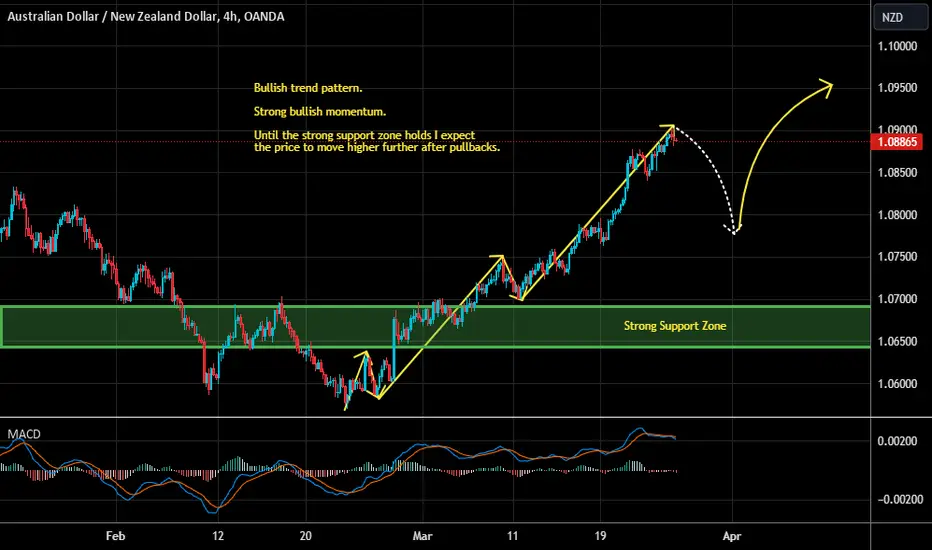
AUDNZD - Looking To Buy Pullbacks In The Short TermH4 - Bullish trend pattern.
Strong bullish momentum.
Until the strong support zone holds I expect the price to move higher further after pullbacks.
AUDNZD - Looking To Buy Pullbacks In The Short TermH1 - Bullish trend pattern.
Higher highs.
No opposite signs.
Until the strong support zone holds I expect the price to move higher further after pullbacks.

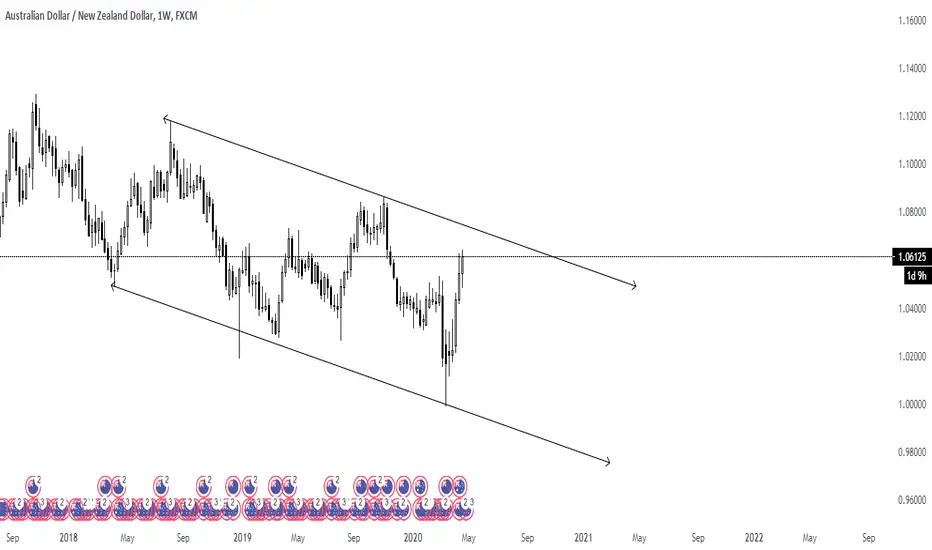
AUDNZD breaks above channel top,AUD/NZD breaks above channel top, outlook bullish
AUD/NZD trades with a bullish bias. Scope for test of 1.0895. Bullish invalidation only on retrace below channel top.

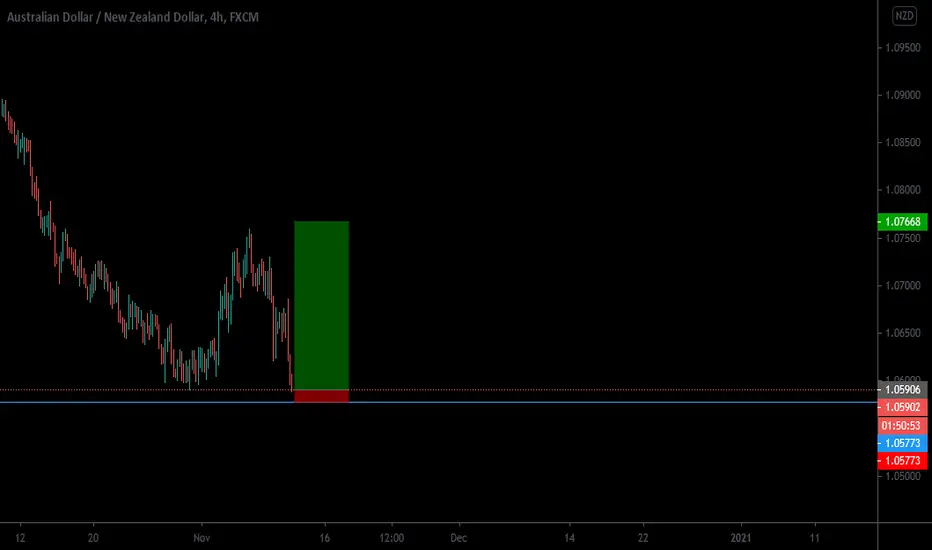
#AUDNZD- LONGWe expect a strong bullish impulse at the region that we are interested in, this can be either 100 pips moves or 200 depedning on the liquidity.
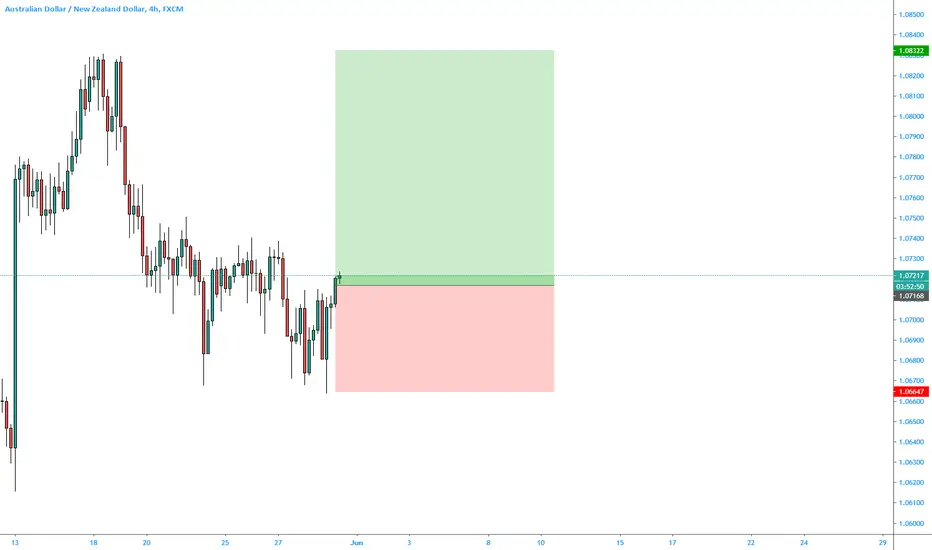
AUD/NZD 4H👋 Hello and welcome traders to another trade
☝️ Firstly, if you like what you see, please support our work by writing a comment and SMASH that like button! 👍 Let's catch these moves together! ✅
💡 Why should you follow our profile on TradingView?
1- Consistent chart updates
2- Clean charts
3- Short and long-term perspectives
4- Visually teaches you valuable lessons
5- High probability setups
6- Analysis on a wide range of major markets
SMASH that follow button! 👍
💡 Leave a comment and/or message us on how we can improve and provide better content, we are open to suggestions to create a better experience for you!
Keep in mind that the analysis provided is not 100% accurate and that you can never be certain with the markets. This information given is not financial advice, always do your own research.
Thank you for reading,
Cheers to many pips! 🤝


AUDNZD BUYAUDNZD 4H timeframe analysis, the overall market structure is a sell but right now is gonna come up for retracement before it'll continue to move down.

AUD/NZD, buy a bullish breakout of the Key LevelWe are looking for entering a long position after breaking the trendline. If we will be able to break the Key Level, we would be placing buy entry.

AUDNZD KEY LEVELSHello Traders
I'm here with a new forex idea and analysis, Kindly share your LOVE by giving me LIKES and COMMENTS.
Share with more traders like you.
Follow me for more.
Thanks in advance.
Please support this idea with a LIKE if you find it useful.
Thank you for reading this idea! I hope it's been useful to you and some of us will turn it into profitable.
Remember this analysis is not 100% accurate. No single analysis is. To make a decision follow your own thoughts.
The information given is not Financial Advice.
Trading Pathways Analysis of AUDNZD H4 Chart
The outlined white arrow pathway is the predicted pathway that the AUDNZD will follow in the coming days or weeks. Using my unique charting methods, I have been able to arrive at HIGH PROBABILITY turning points where AUDNZD will turn.
PLEASE NOTE THE ABOVE ANALYSIS IS FOR EDUCATIONAL PURPOSES ONLY. THEY ARE NOT DIRECT INSTRUCTIONS TO TRADE AND ANY LOSS INCURRED BY FOLLOWING THIS ANALYSIS IS AT YOUR OWN RISK.
Eiseprod of Trading Pathways
AUDNZD - LONGWe are in the support zone, hopefully that 2 bounces from the past will be happening again this time.
Trade Idea
1.) Rsi - set up similar to the past patterns
2.) Macd - Signal crossed and
3.) RR 2.5
Note;
Trade with cares !


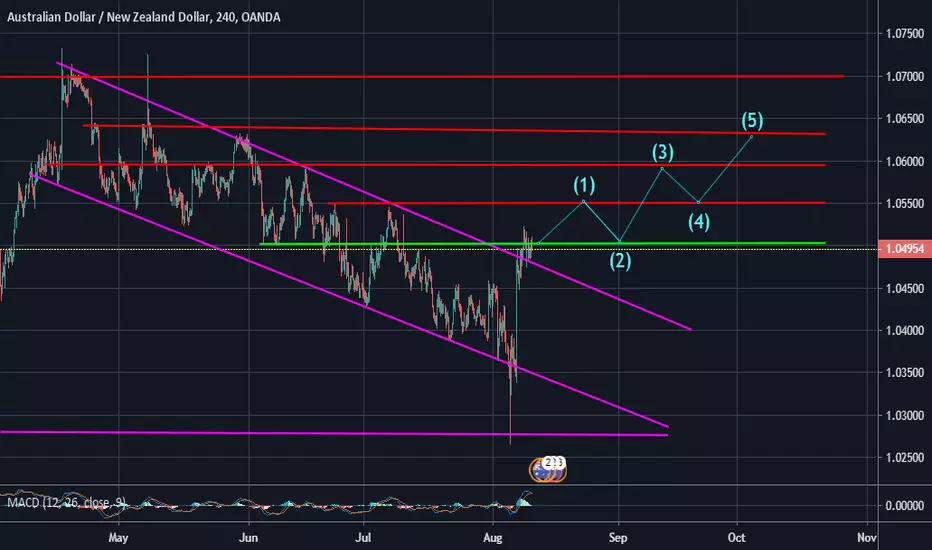
AUDNZD BUY MOVESBIG BUY MOVES COMING AUDNZD
BREAKOUT OF DOWNTREND LINE
ELLIOT WAVE IN MY SIMPLE SETUP
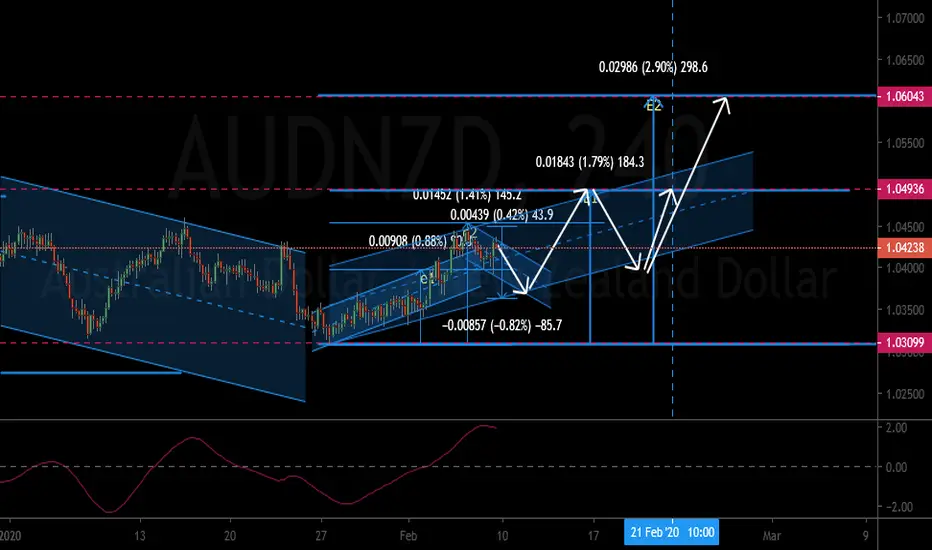
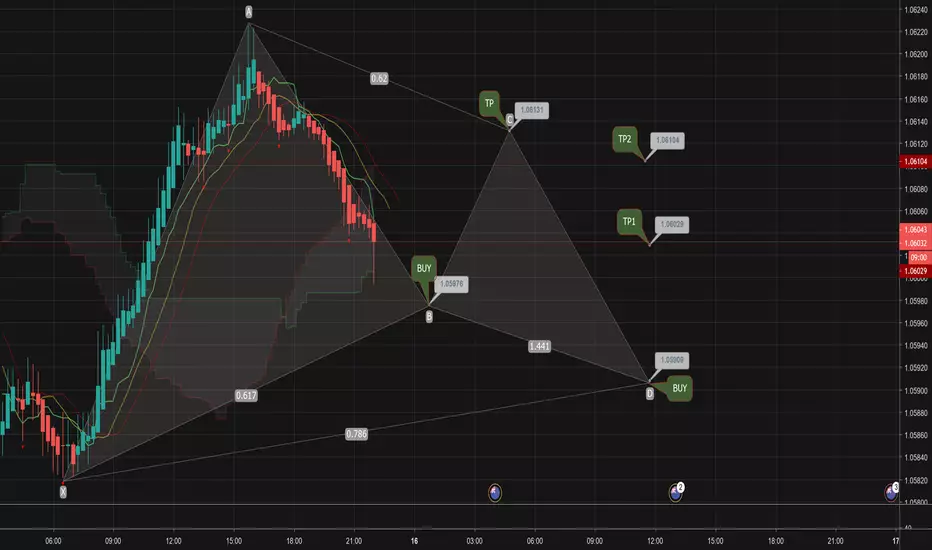
AUDNZD BuyMy opinion is that the market is in an uptrend and we're currently in a retracement where buyers have another opportunity to enter and exit the market for a TP. I have identified 2 places where you may wish to do a buy either at leg B OR you can decide to wait for market to go lower before buying in again at leg D.
My labelled zones are only a rough idea of where i think the market may touch. Decide on your own Entry & Exit.
DISCLAIMER
Please note that this chart is an opinion based chart only. Please trade at your own risk


AUD/NZD 1H Chart: Breakout from symmetrical triangleAUD/NZD 1H Chart: Breakout from symmetrical triangle
In early hours of this trading session the currency exchange rate made a breakout from symmetrical triangle pattern amid the pressure from 55-, 100- and 200-hour SMAs. In result of this downfall the pair has formed a minor descending channel, which is should guide movement of the pair at least until release of data on the New Zealand Retail Sales. But publication of worse than expected figures is unlikely to change the overall trend, according to which the pair is expected to ultimately reach the lower support line of the dominant rising wedge formation. In case the pair bypasses the above moving averages, the subsequent surge should be neutralized by the upper trend-line of a medium-term descending channel.

Quick Profit AUDNZDAUDNZD Looking for a bounce from here to the 108 levels if the line holds. Quick profit here!!

Long AUDNZD Longterm Based on Weekly + 1D Charts for 400+ Pips!!In an ideal world, the AUDNZD would continue another wave of the uptrend and close above 1.10198.
Excuse my purple arrows lol they are for my reference of some S+R that I want to keep an eye on...
On the Weekly, we've been making lower lows since the 6th of April 2015.
More recently on the Daily chart, we've been making Higher Highs and Lower Lows since the 14th of September 2016
We can see clearly on the Weekly chart that price has found + respected resistance on the EMA200 line.
The EMA200 has now dropped below the last higher high, which was recorded on the 13th of March 2017 at 1.10027.
We can see the EMA200, on it's current course is set to be around 1.09170 when we approach our target and so that's our TP.
Stochs has just come out of oversold and our MACD indicator is preparing to complete a bullish crossover on the Daily chart.
We enter low, close to the trend line to minimise risk.
This research is for informational purposes and should not be construed as personal advice. Trading any financial market involves risk. Trading on leverage involves risk of losses greater than deposits.
Please comment below and Like if you agree with my analysis.
