WOL3.1 #42AUDNZD sell stop 1.08171
SL 1.08549
TP 1.07415
R= 37.8 pips
Si el precio llega a 1.07792, mover SL a 1.08096
Audnzdshort

AUD/NZDwait for the conformation, and share you thought. I would love to hear your comment and learn.
AUDNZD Potential shorts!Hey Guys, hope everyone doing Good,
I have a potential short setup on AUDNZD

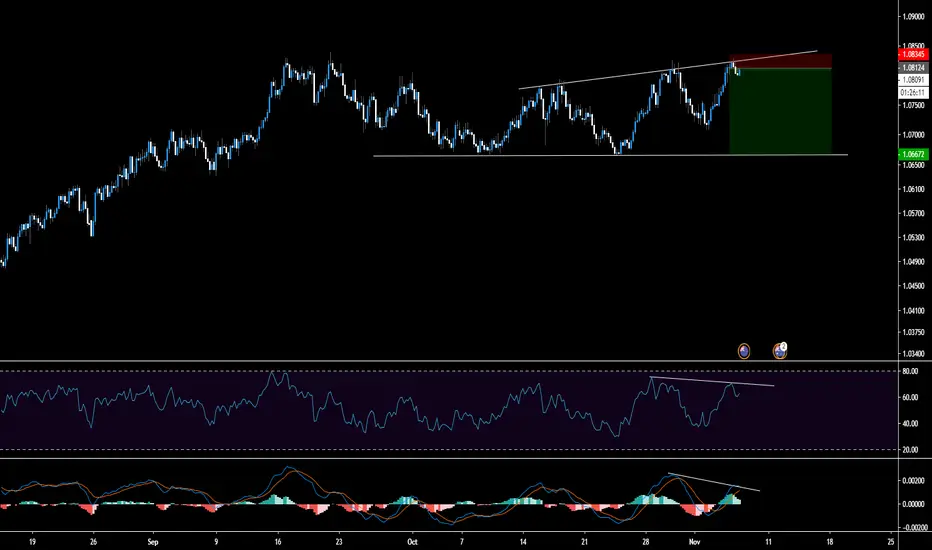
AUDNZD shortSince price has arrived at upper trendline we have seen rejection via a break of minor trendline on the hourly and 3 consecutive bearish candles. We will be targetting bottom trendline to complete the pattern. 4 hour RSI and MACD are also showing bearish divergence suggesting we will see downside momentum.
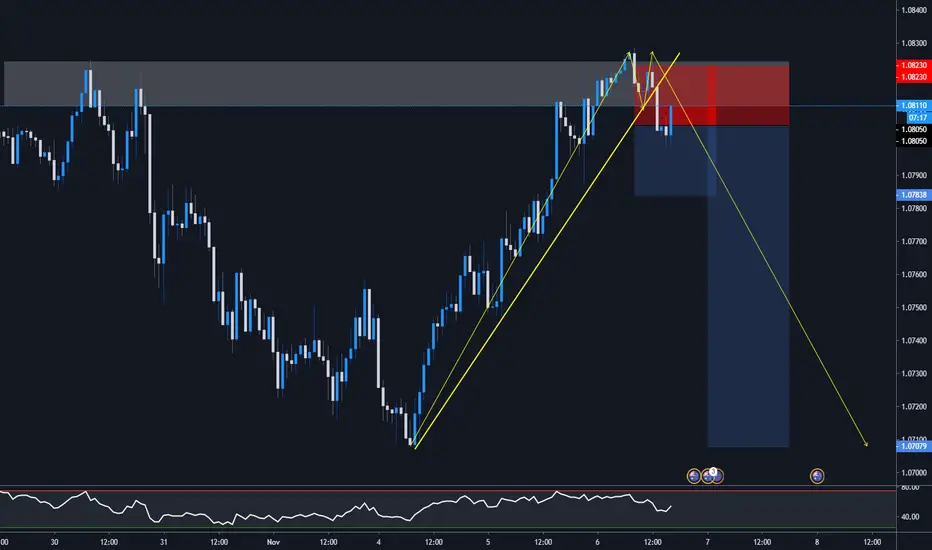
AUDNZD, 30mSell stop order.
1. Ascending trend line crossed bellow.
2. Resistance zone.
3. Candlestick pattern.

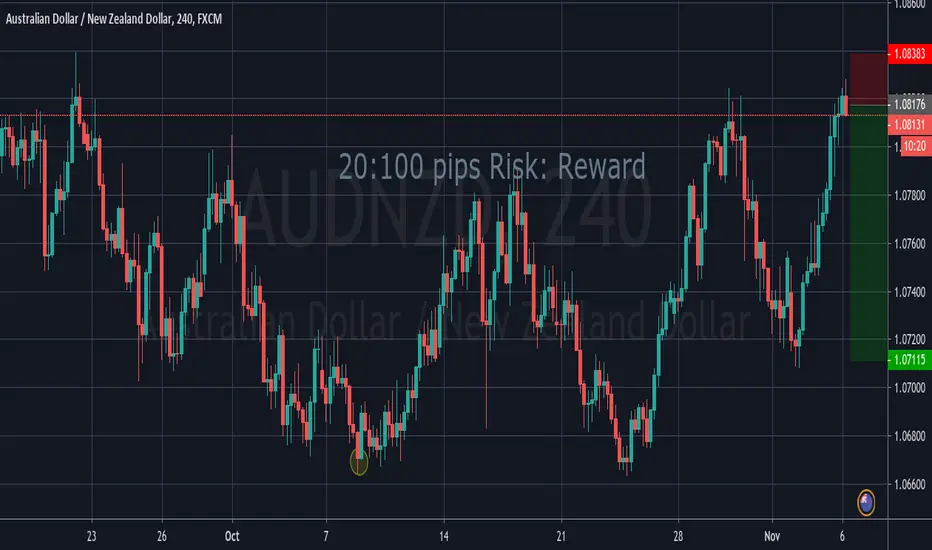
AUDNZD - Shortstrongly believe this could be a real nice short.
just opened a position.
If it does go against me then i also believe it will happen really quickly
Lets see how it goes
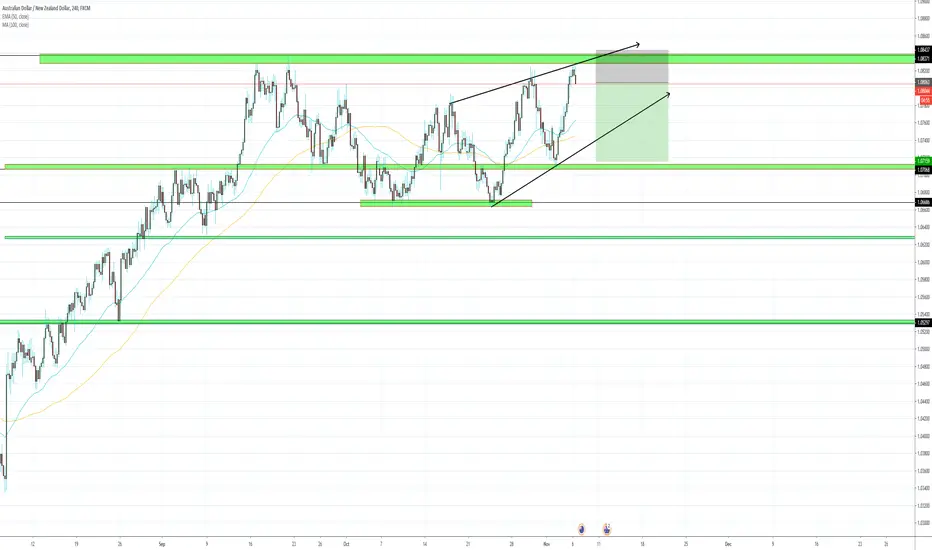
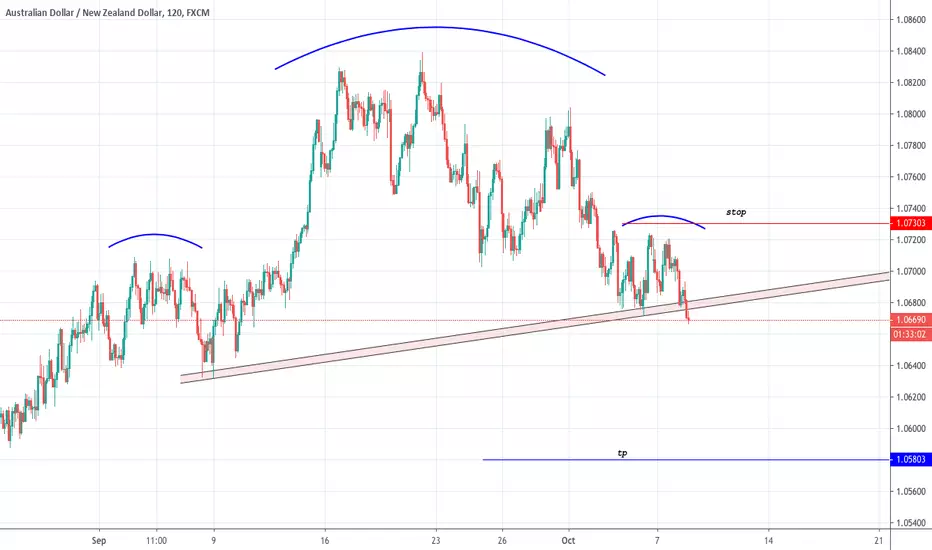
AUD NZD | POTENTIAL DOUBLE TOP ON STRONG RESISTANCEI´m looking for a sell in AUD NZD!
We are sitting on a strong resistance zone and have to H4 PInbar Candles.
Another confirmation for the setup also is the resistance of the channel.
Risk to Reward for this setup is a 1:2.5
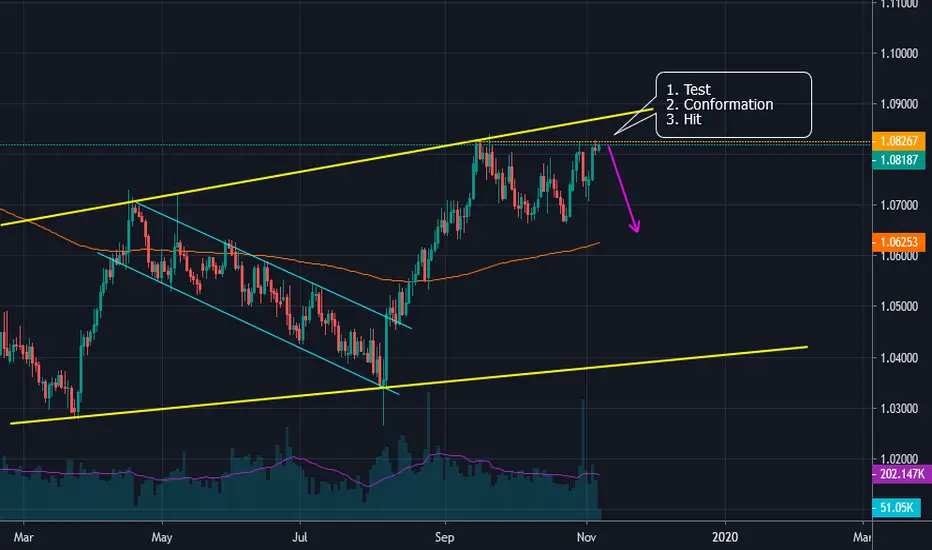
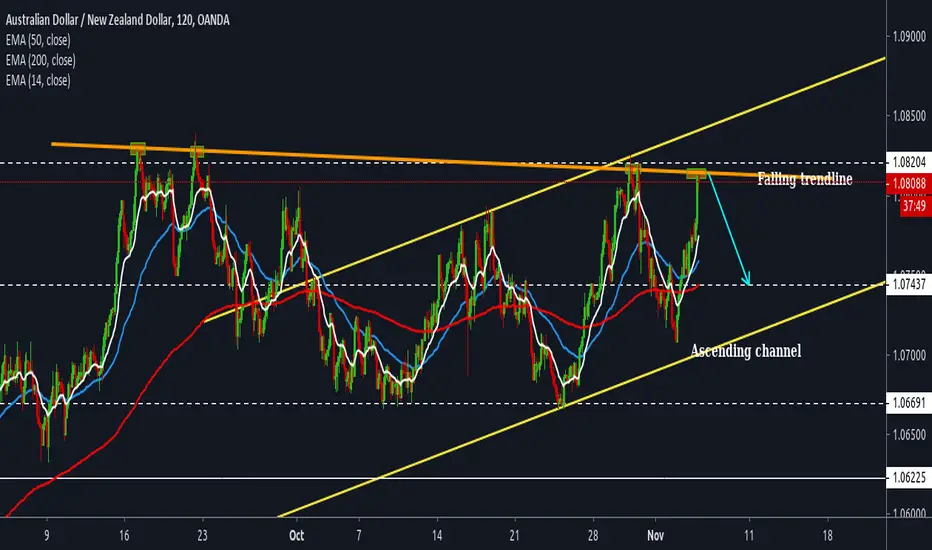
AUDNZD Analysis: Price at the trendlineThe price has been following both an ascending channel and a falling trendline.
It has previously respected the trendline for four times and has come to test it for the fifth time.
If it bounces off then it will be a good sell opportunity.
Breaking of the trendline will invalidate this idea.
You may share your opinions in the comment section. If you agree with the analysis you can hit the like to show support.
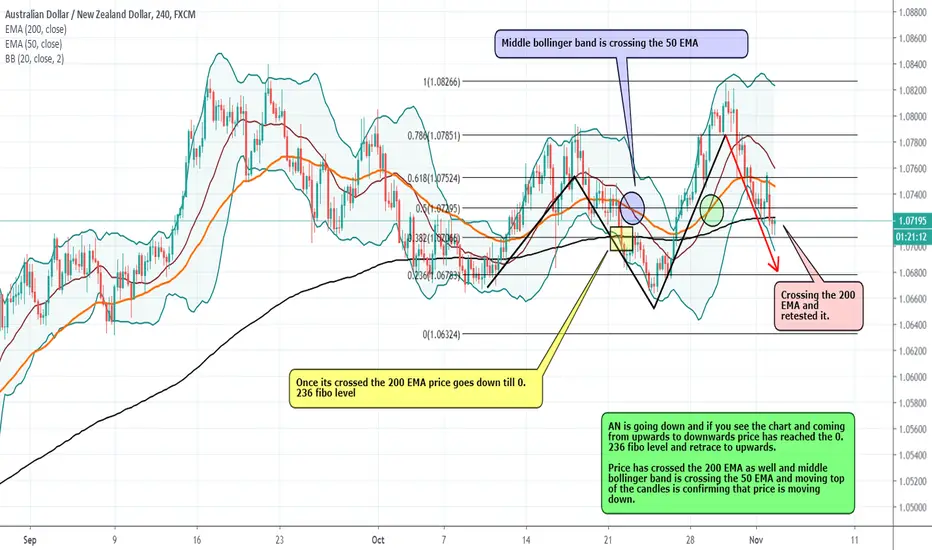
AUDNZD - SELL NowAN is going down and if you see the chart and coming from upwards to downwards price has reached the 0.236 fibo level and retrace to upwards.
Price has crossed the 200 EMA as well and middle bollinger band is crossing the 50 EMA and moving top of the candles is confirming that price is moving down.
Once its crossed the 200 EMA price goes down till 0.236 fibo level
Note: Trade at your own risk.
twitter.com
www.facebook.com
www.instagram.com
Weekly Bearish Bias (until invalidated) - AUDNZDChart self-explanatory
Risk event :
Australia - Retail Sales 8.30am (Singapore/Malaysia time)
New Zealand - None

AUDNZD, 30m UPDATE1/3 of left position is closed at current price.
1. 61.8 Fibo tested.
2. Good support zone.


AUDNZD, 30m1. Ascending trend line crossed bellow. (potential bearish trend).
2. Resistance zone.
3. Candlestick pattern.
4. Ema 32 and 50 tested as resistance.
5. Trend line tested as resistance.
6. EURNZD pair also shows sell signals.


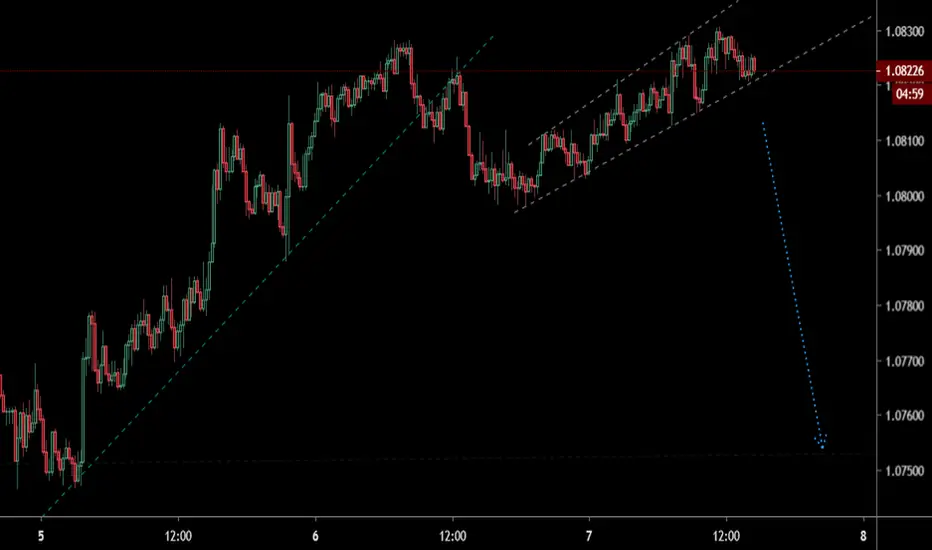
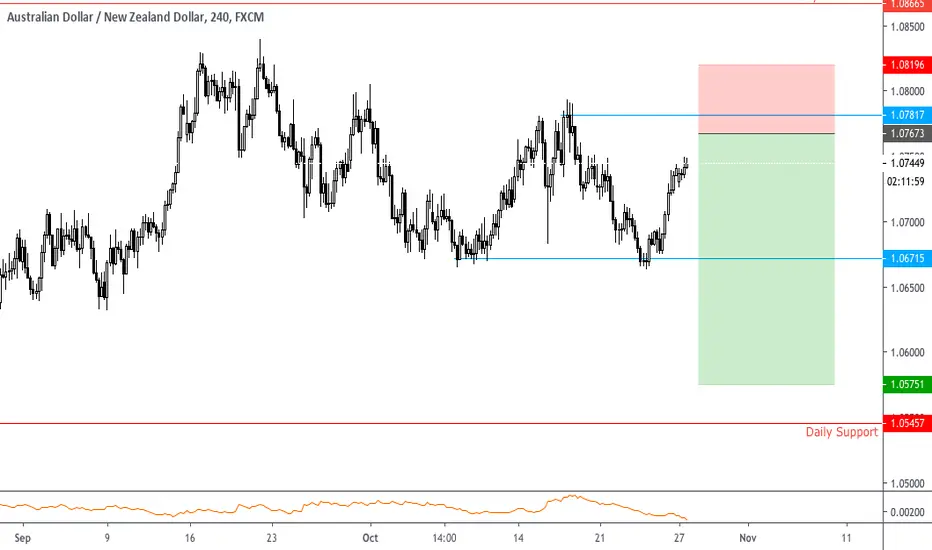
AUDNZD - Short #Forex #ForexTradingWaiting for a break of the ascending channel and a retest of the previous low.
Its also at major resistance on the Daily TF and is way over extended in my opinion
Any questions feel free to ask.
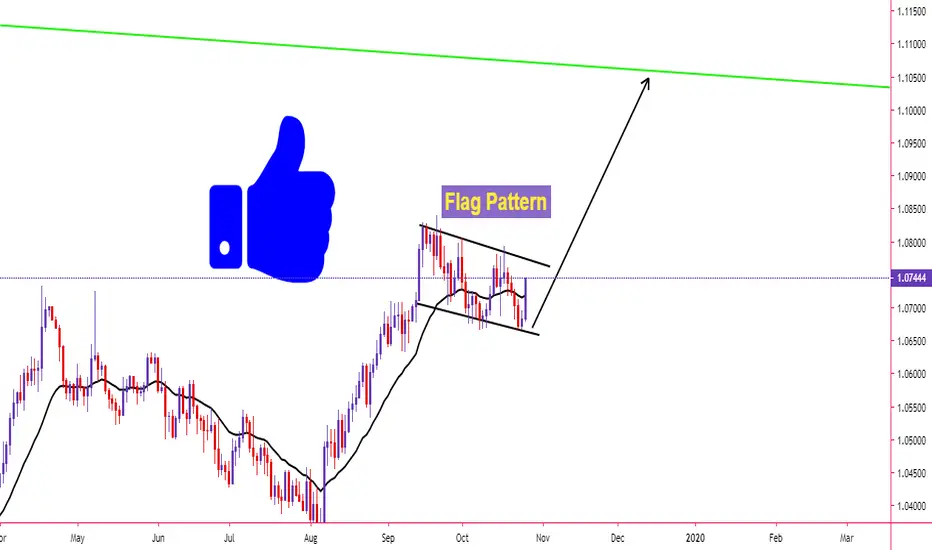
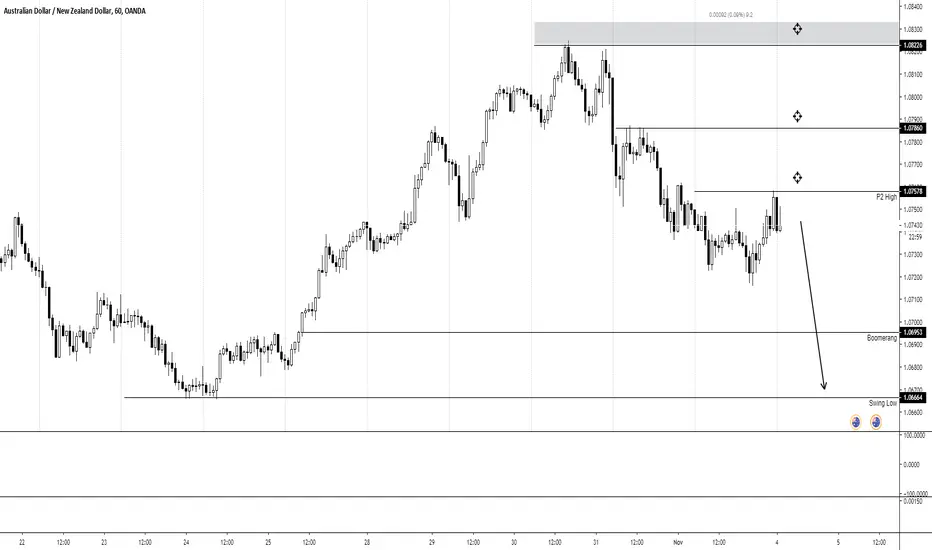
AUDNZD Possibility of next MoveIn the name of Allah, the Most Gracious, the Most Merciful
AUDNZD Possibility of next Move.
Note: This is only for Educational purposes; this is not investment advice.
Thanks
Adil Khan.

aud/nzd sellwait for confirmation of the long shadow candles, price has hit Resistance many times and has been rejected

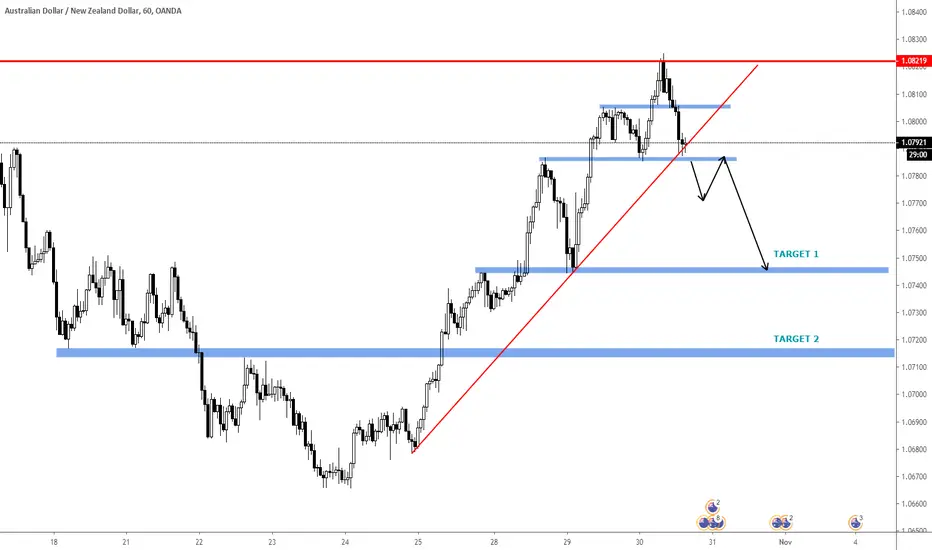
AUDNZD Possibility of Next Move. In the name of Allah, the Most Gracious, the Most Merciful
AUDNZD Possibility of Next Move.
Note: This is only for Educational Purpose this is not Investment advice.
Thanks
Adil Khan.