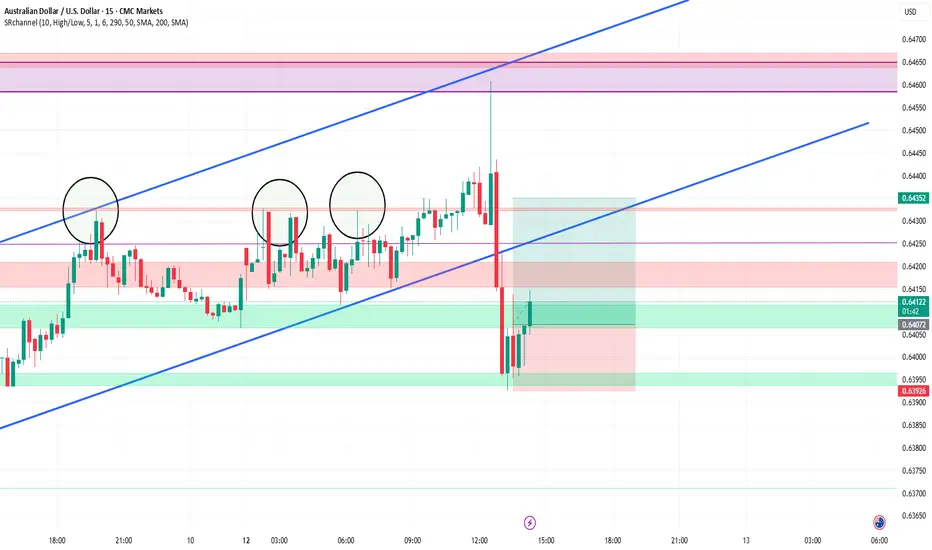
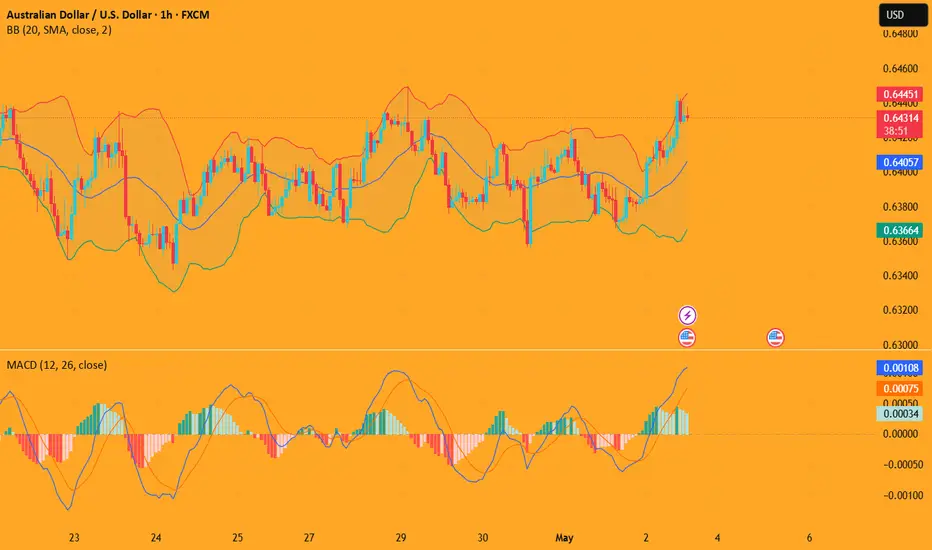
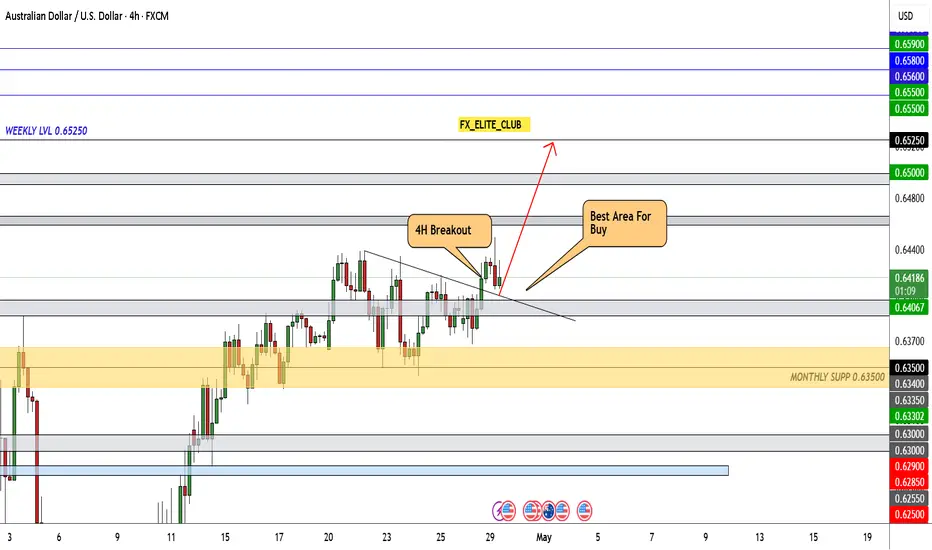
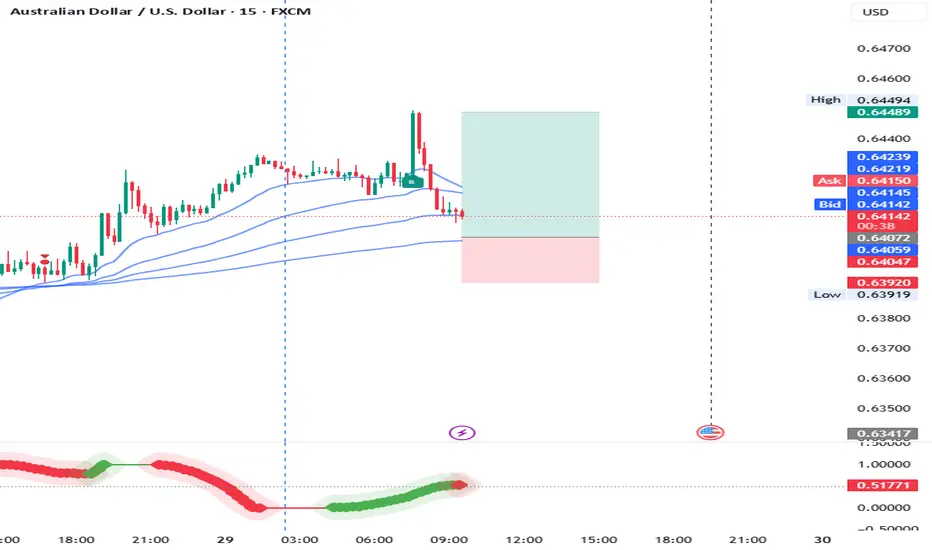
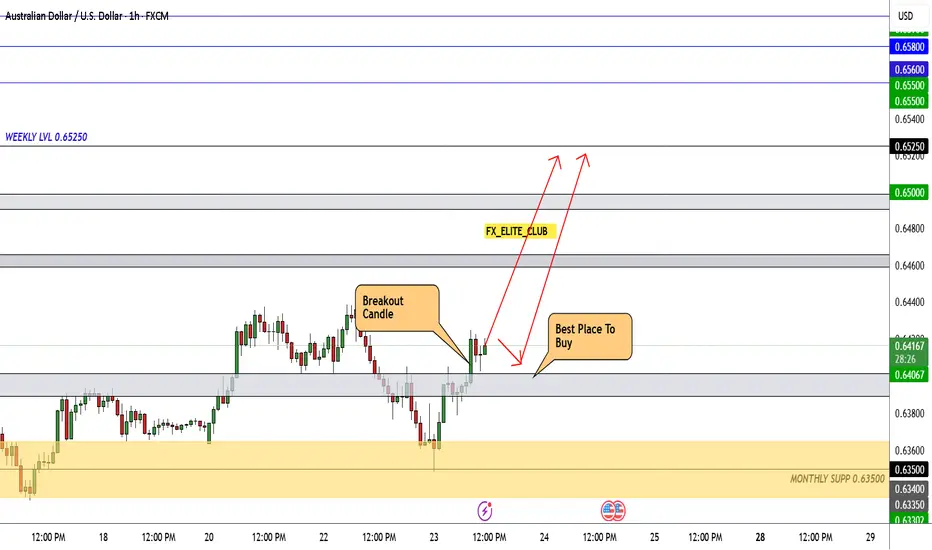
AUD/USD On the weekly timeframe, AUD/USD approached a previously tested resistance zone around 0.63926, marked by prior price interactions. On the 1-hour chart, the price broke out above this level, signaling bullish momentum. On the 15-minute chart, a backtest of the breakout level occurred, with the price retesting the 0.63926 zone, now acting as support, before continuing upward.
Trade Plan:
Entry: Entered a buy trade at 0.64072 after the backtest confirmation.
Take Profit (TP): Targeting 0.64352, aligning with the next significant resistance level.
Stop Loss (SL): Placed at 0.63926, just below the breakout level, to protect against a false breakout.
Risk-Reward Ratio (RR): The distance to TP is 280 pips (0.64352 - 0.64072), and the distance to SL is 146 pips (0.64072 - 0.63926), yielding an RR of approximately 1:1.9.
This AUD/USD trade capitalizes on a breakout and backtest strategy, offering a structured setup with a favorable risk-reward ratio for potential upside.
Audusdlong
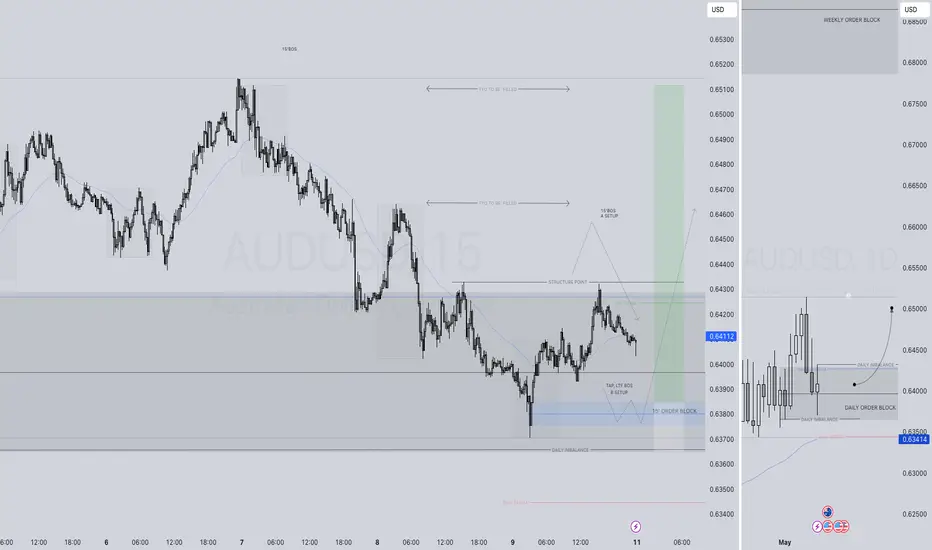
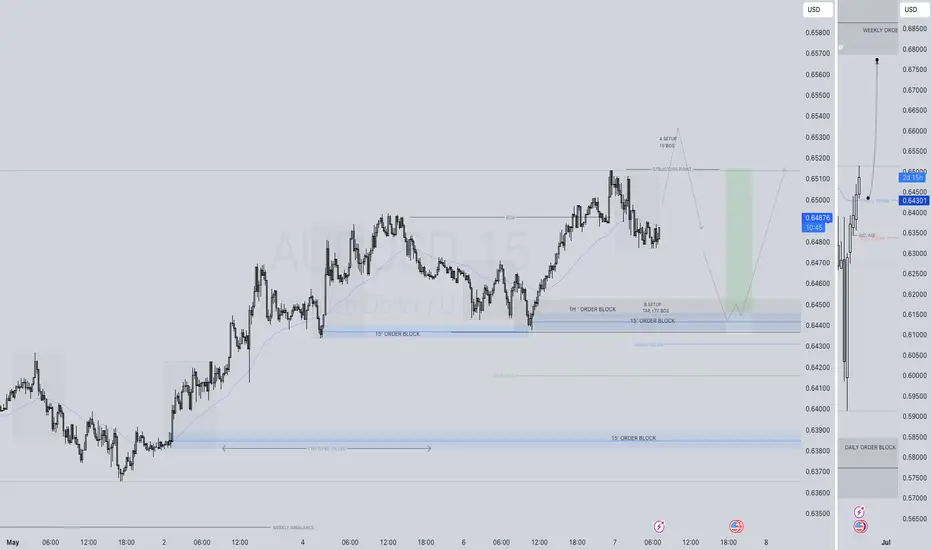
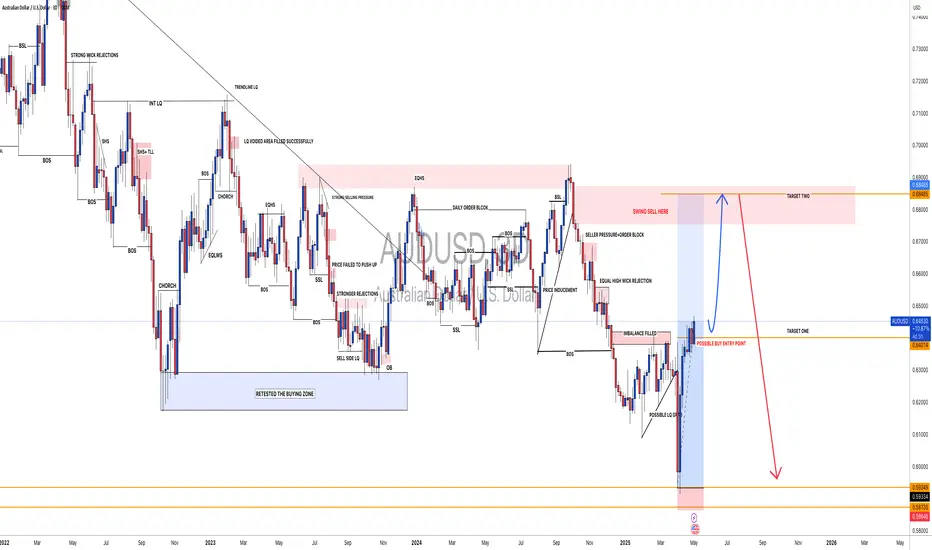
AUDUSD LONG FORECAST Q2 W20 D12 Y25AUDUSD LONG FORECAST Q2 W20 D12 Y25
Professional Risk Managers👋
Welcome back to another FRGNT chart update📈
Diving into some Forex setups using predominantly higher time frame order blocks alongside confirmation breaks of structure.
Let’s see what price action is telling us today!
💡Here are some trade confluences📝
✅Daily order block rejection
✅15’ order block identified
✅Tokyo ranges to be filled
✅Intraday bullish breaks of structure to be confirmed
🔑 Remember, to participate in trading comes always with a degree of risk, therefore as professional risk managers it remains vital that we stick to our risk management plan as well as our trading strategies.
📈The rest, we leave to the balance of probabilities.
💡Fail to plan. Plan to fail.
🏆It has always been that simple.
❤️Good luck with your trading journey, I shall see you at the very top.
🎯Trade consistent, FRGNT X
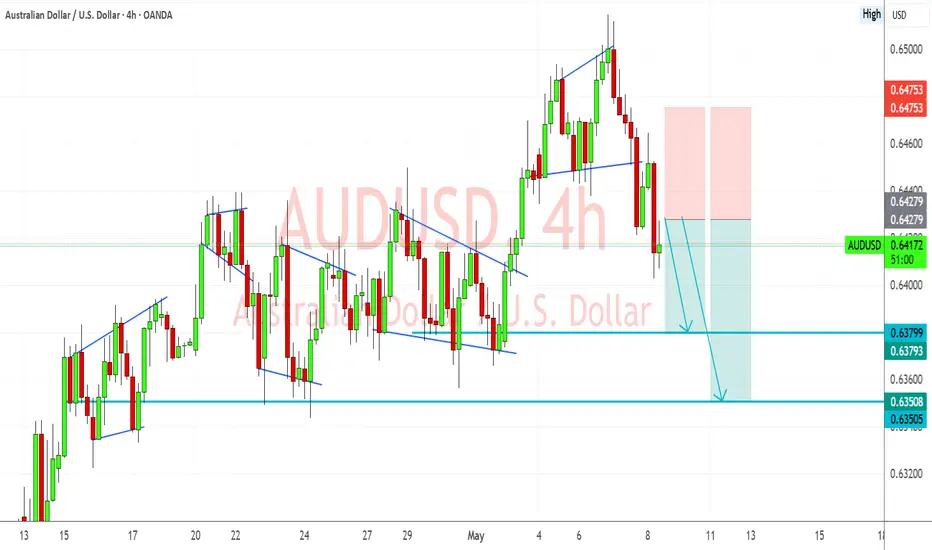
AUDUSD Bearish Breakout – Macro and Technicals AlignAUDUSD has broken below a rising wedge formation on the 4H chart, signaling a bearish continuation. With the Reserve Bank of Australia pausing rates and weak local data weighing on sentiment, while the Federal Reserve maintains a hawkish hold due to sticky labor costs, this trade sets up well both technically and fundamentally. I'm watching for downside continuation toward 0.6379 and potentially 0.6350. The bearish bias is invalidated on a move above 0.6475.
🔍 Technical Analysis
Structure: Price broke down from a rising wedge and continues forming bear flags — each followed by further selling pressure.
Current Price Action:
Rejected sharply at ~0.6475 (last swing high)
Confirmed breakout with downside momentum
Key Support Levels:
0.6379 – minor structural support
0.6350 – major support zone from April
Resistance / Invalidation:
Above 0.6475 – would break the bearish structure and negate the setup
Bias: Bearish — clean structure, breakout momentum, and sustained lower highs
🌏 Fundamental Context
🇦🇺 Bearish AUD Drivers:
Weak domestic data:
Building Approvals: -8.8% vs -1.7% forecast
RBA on hold:
No rate hike in sight; cautious due to housing and China concerns
China slow-down:
PBOC cut rates and reduced reserve requirements — signals broader economic softness
🇺🇸 Bullish USD Drivers:
Fed holding firm:
Benchmark rate held at 4.25–4.50%
Labor costs surged +5.3% q/q
Productivity dropped -0.4%, reinforcing inflation concerns
Market repricing rate cuts:
Cuts now expected later in 2025 or even 2026
Political pressure from Trump:
Despite attacks on Jerome Powell, Fed appears unmoved
Trump teasing a “major trade deal” — potentially USD-positive if credible
🎯 Trade Setup
Entry Area: Watching 0.6420–0.6435 as a pullback zone for potential shorts
Target Levels:
First target: 0.6379
Second target: 0.6350
Stop Loss: Placed above 0.6475 (last swing high) to protect against false breakouts
Trade Thesis:
Technical structure supports downside continuation
Macro fundamentals favor USD strength and AUD weakness
Clean reward-to-risk if structure holds
🧭 Conclusion
AUDUSD setup is supported by a strong confluence of technical breakdown and macro divergence. With the Fed staying firm and the RBA cautious amid weak data, the fundamentals validate the bearish trend. As long as price stays below 0.6475, the outlook remains bearish, with 0.6379 and 0.6350 as the next logical levels. Caution around U.S. data releases or trade deal news is advised, but the path of least resistance remains downward.
AUDUSD BUY/LONGBy utilizing Fibonacci retracement levels, historical patterns, , we can formulate a hypothesis that the market might follow a similar trajectory if bullish sentiment prevails.
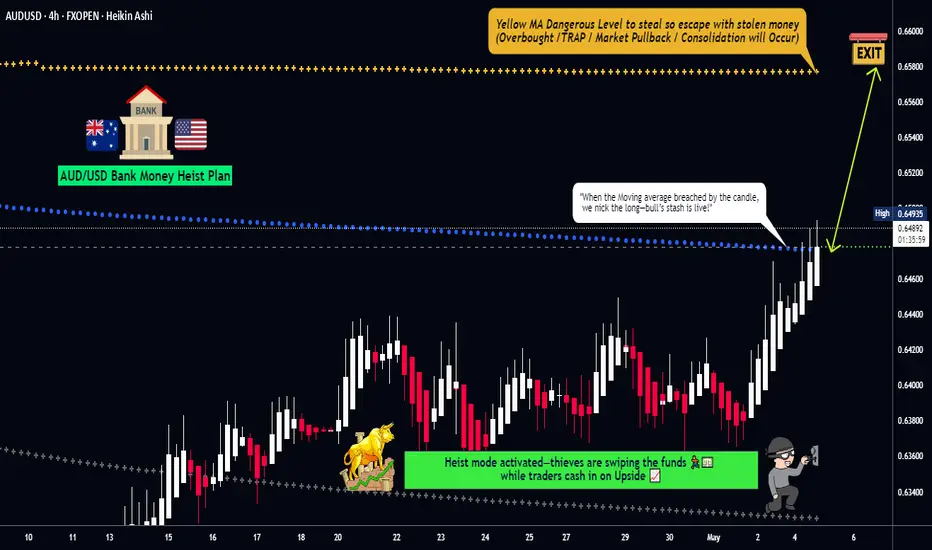
AUD/USD "The Aussie" Forex Bank Money Heist (Bullish)🌟Hi! Hola! Ola! Bonjour! Hallo! Marhaba!🌟
Dear Money Makers & Robbers, 🤑 💰💸✈️
Based on 🔥Thief Trading style technical and fundamental analysis🔥, here is our master plan to heist the AUD/USD "The Aussie" Forex Bank Heist. Please adhere to the strategy I've outlined in the chart, which emphasizes long entry. Our aim is to escape near the high-risk MA Line Zone. It's a Risky level, overbought market, consolidation, trend reversal, trap at the level where traders and bearish robbers are stronger. 🏆💸"Take profit and treat yourself, traders. You deserve it!💪🏆🎉
Entry 📈 : "The heist is on! Wait for the Crossing previous high (0.64900) then make your move - Bullish profits await!"
however I advise to Place Buy stop orders above the Moving average (or) Place buy limit orders within a 15 or 30 minute timeframe most recent or swing, low or high level for Pullback entries.
📌I strongly advise you to set an "alert (Alarm)" on your chart so you can see when the breakout entry occurs.
Stop Loss 🛑: "🔊 Yo, listen up! 🗣️ If you're lookin' to get in on a buy stop order, don't even think about settin' that stop loss till after the breakout 🚀. You feel me? Now, if you're smart, you'll place that stop loss where I told you to 📍, but if you're a rebel, you can put it wherever you like 🤪 - just don't say I didn't warn you ⚠️. You're playin' with fire 🔥, and it's your risk, not mine 👊."
📍 Thief SL placed at the nearest/swing low level Using the 4H timeframe (0.6400) Day trade basis.
📍 SL is based on your risk of the trade, lot size and how many multiple orders you have to take.
🏴☠️Target 🎯: 0.65800
🧲Scalpers, take note 👀 : only scalp on the Long side. If you have a lot of money, you can go straight away; if not, you can join swing traders and carry out the robbery plan. Use trailing SL to safeguard your money 💰.
💰💵💸AUD/USD "The Aussie" Forex Bank Money Heist is currently experiencing a bullishness,., driven by several key factors. .☝☝☝
📰🗞️Get & Read the Fundamental, Macro Economics, COT Report, Quantitative Analysis, Sentimental Outlook, Intermarket Analysis, Future trend targets with overall score... go ahead to check👉👉👉🔗🔗🌎🌏🗺
⚠️Trading Alert : News Releases and Position Management 📰🗞️🚫🚏
As a reminder, news releases can have a significant impact on market prices and volatility. To minimize potential losses and protect your running positions,
we recommend the following:
Avoid taking new trades during news releases
Use trailing stop-loss orders to protect your running positions and lock in profits
💖Supporting our robbery plan 💥Hit the Boost Button💥 will enable us to effortlessly make and steal money 💰💵. Boost the strength of our robbery team. Every day in this market make money with ease by using the Thief Trading Style.🏆💪🤝❤️🎉🚀
I'll see you soon with another heist plan, so stay tuned 🤑🐱👤🤗🤩
AUDUSD LONG FORECAST Q2 W19 D7 Y25AUDUSD LONG FORECAST Q2 W19 D7 Y25
Professional Risk Managers👋
Welcome back to another FRGNT chart update📈
Diving into some Forex setups using predominantly higher time frame order blocks alongside confirmation breaks of structure.
Let’s see what price action is telling us today!
💡Here are some trade confluences📝
✅Weekly 50 EMA
✅Intraday 15' order block
✅Tokyo ranges to be filled
✅Intraday bullish breaks of structure to be confirmed
🔑 Remember, to participate in trading comes always with a degree of risk, therefore as professional risk managers it remains vital that we stick to our risk management plan as well as our trading strategies.
📈The rest, we leave to the balance of probabilities.
💡Fail to plan. Plan to fail.
🏆It has always been that simple.
❤️Good luck with your trading journey, I shall see you at the very top.
🎯Trade consistent, FRGNT X
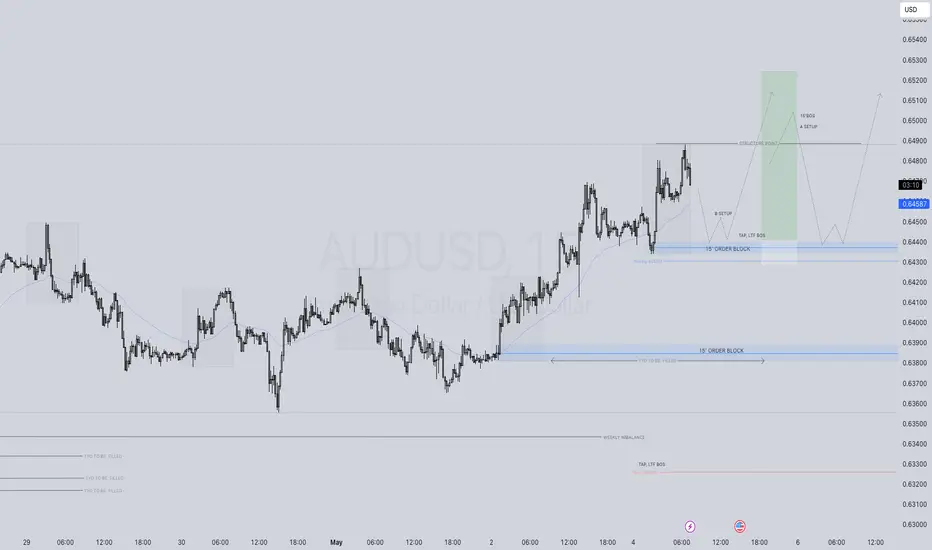
AUDUSD LONG FORECAST Q2 W19 D5 Y25
AUDUSD LONG FORECAST Q2 W19 D5 Y25
Professional Risk Managers👋
Welcome back to another FRGNT chart update📈
Diving into some Forex setups using predominantly higher time frame order blocks alongside confirmation breaks of structure.
Let’s see what price action is telling us today!
💡Here are some trade confluences📝
✅Weekly 50 EMA
✅Intraday 15' order block
✅Tokyo ranges to be filled
✅Intraday bullish breaks of structure to be confirmed
🔑 Remember, to participate in trading comes always with a degree of risk, therefore as professional risk managers it remains vital that we stick to our risk management plan as well as our trading strategies.
📈The rest, we leave to the balance of probabilities.
💡Fail to plan. Plan to fail.
🏆It has always been that simple.
❤️Good luck with your trading journey, I shall see you at the very top.
🎯Trade consistent, FRGNT X
The trend next weekJudging from the price trend presented in the chart, the current market is clearly in a bearish state 📉. Previously, after the price reached the key resistance level of 0.64500, it failed to break through effectively and continue the upward trend. Instead, it entered a consolidation pattern 📊. This indicates that the bullish forces encountered strong resistance near this price level and found it difficult to push the price higher 👎.
It is expected that in the coming period, without significant positive news stimuli, the price is highly likely to continue its downward trend 📉. Investors should closely monitor whether the support level of 0.63340 holds 👀. If this support level is broken, they may consider selling short on rallies ⏬.
⚡⚡⚡ AUDUSD ⚡⚡⚡
🚀 Sell@0.6500 - 0.6450
🚀 TP 0.6350 - 0.6300
Accurate signals are updated every day 📈 If you encounter any problems during trading, these signals can serve as your reliable guide 🧭 Feel free to refer to them! I sincerely hope they'll be of great help to you 🌟
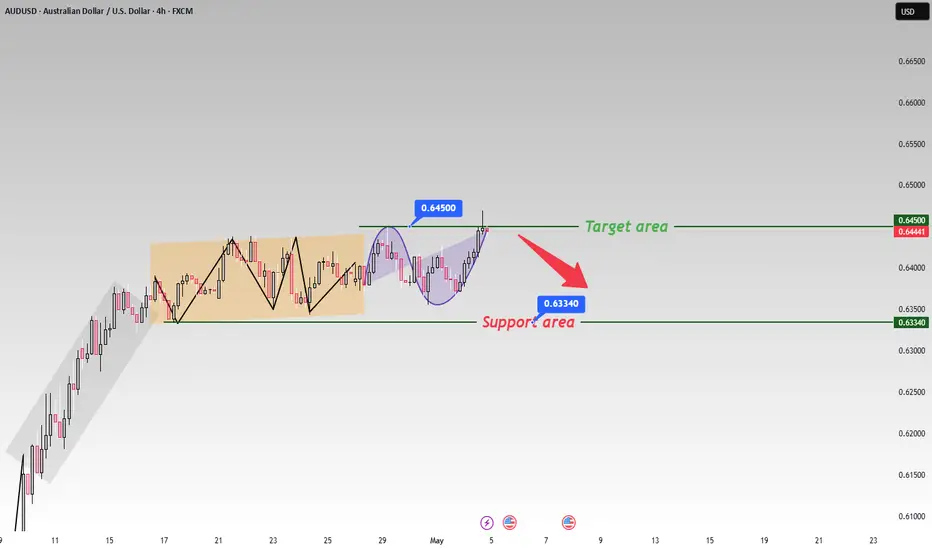
AUD/USD Opening Trends and Trading Strategies Next WeekThe AUD/USD has been in a range - bound fluctuation recently. 📈 In the short term, if the price can stay above the support level of 0.63340 and market risk - appetite sentiment rises, the AUD/USD is expected to challenge the target level of 0.64500. 🎯 However, if it breaks below the support level, it may trigger further downward adjustments. 📉
⚡⚡⚡ AUDUSD ⚡⚡⚡
🚀 Buy@0.6350 - 0.6380
🚀 TP 0.6400 - 0.6450
Accurate signals are updated every day 📈 If you encounter any problems during trading, these signals can serve as your reliable guide 🧭 Feel free to refer to them! I sincerely hope they'll be of great help to you 🌟
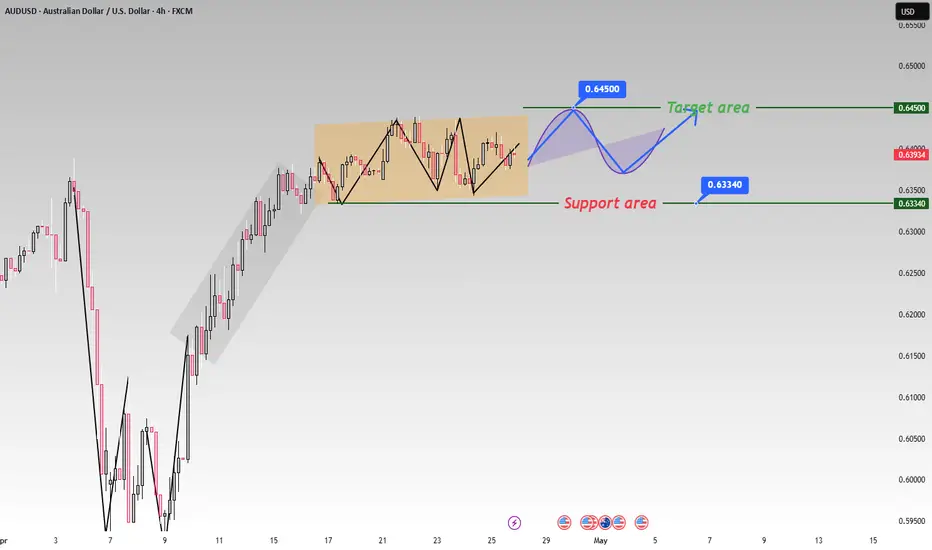
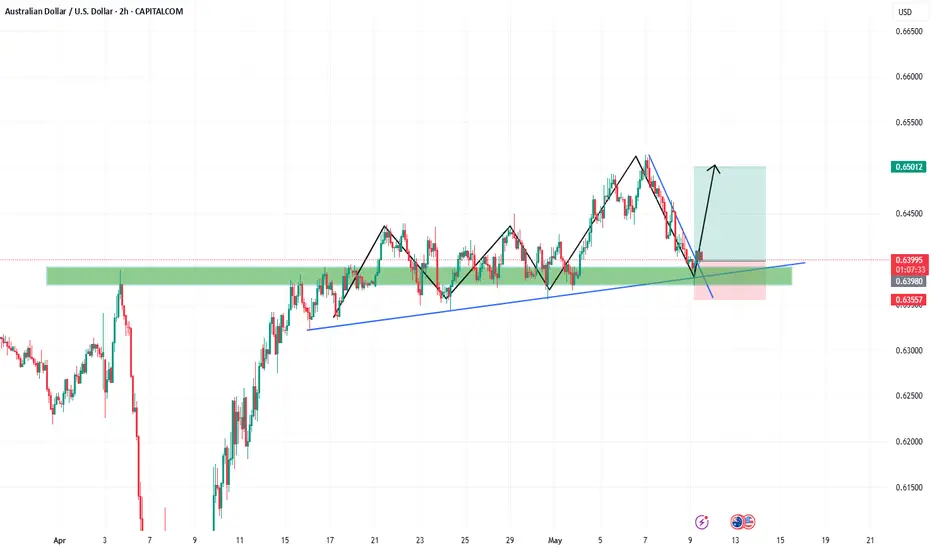
AUDUSD: Neutral View First Buy and Then Sell! Hey everyone!
Our first buy swing entry is going swimmingly! We’ve got over 500 pips running positively, and we reckon price can keep going up and then when it hits our selling zone, you can swing sell too. This is a fantastic opportunity where we can wait for price to do its thing and then when it reaches the sell zone, we can execute our order. But if you’re feeling adventurous and want to take a bit of a risk, you can take a buy entry at the given point and keep it up until it reaches our sell area.
With just one shot, we can make two entries!
Good luck and trade safely!
Thanks a bunch for your unwavering support! 😊
If you’d like to lend a hand, here are a few ways you can contribute:
- Like our ideas
- Comment on our ideas
- Share our ideas
Cheers,
Team Setupsfx_
❤️🚀
AUDUSD(20250502)Today's AnalysisToday's buying and selling boundaries:
0.6391
Support and resistance levels:
0.6452
0.6429
0.6414
0.6367
0.6352
0.6329
Trading strategy:
If the price breaks through 0.6391, consider buying, the first target price is 0.6414
If the price breaks through 0.6367, consider selling, the first target price is 0.6352
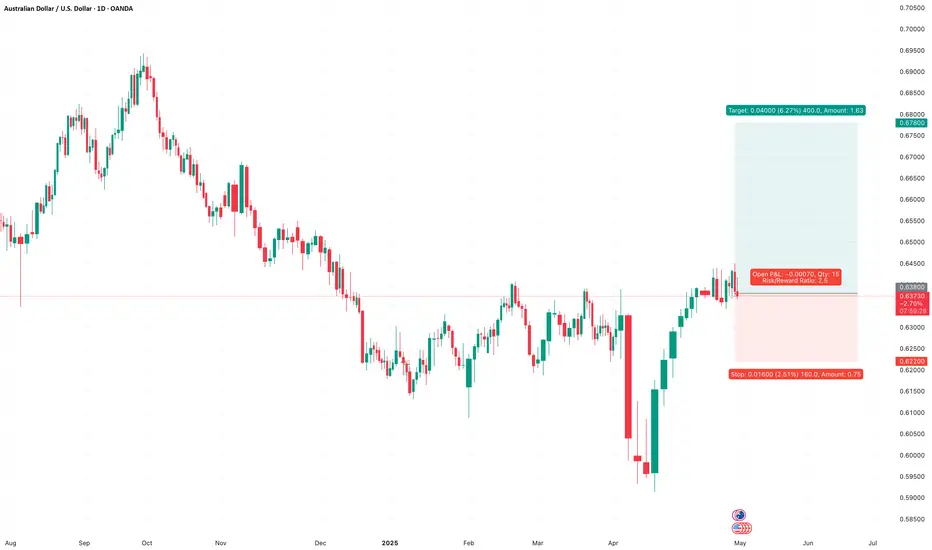
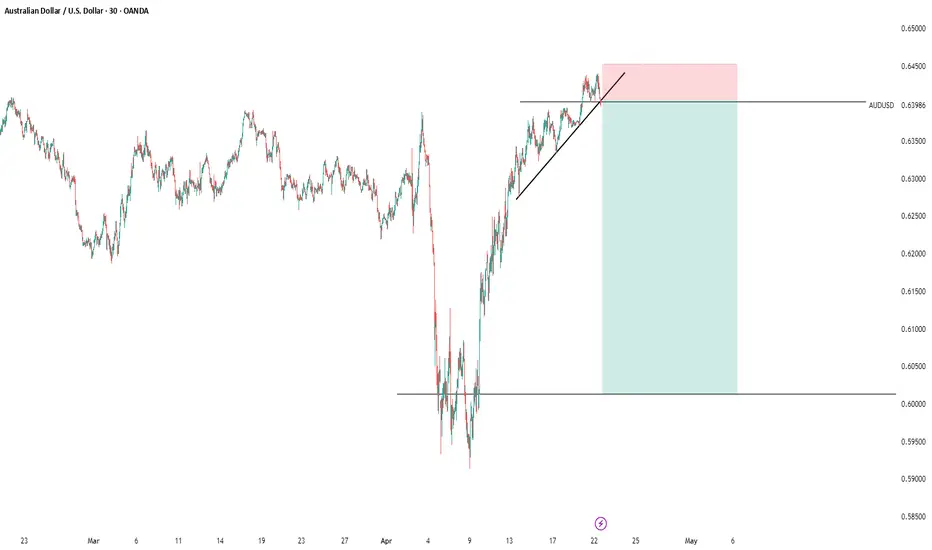
AUDUSD - Daily chart, OANDA) - Long; Mid-term research idea.AUDUSD - Australian Dollar / U.S. Dollar (Daily chart, OANDA) - Long Position; Mid-term research idea.
Risk assessment: High {volume & support structure integrity risk}
Risk/Reward ratio ~ 2.5
Entry limit ~ 0.63800 on April 30, 2025
1. Target limit ~ 0.67800 (+6.27%; +0.04000 points)
2. Target limit ~ 0.65715 (+3%; +0.01915 points)
Stop order limit ~ 0.62200 (-2.51%; -0.01600 points)
Disclaimer: Investments in securities markets are subject to market risks. All information presented in this group is strictly for reference and personal study purposes only and is not a recommendation and/or a solicitation to act upon under any interpretation of the letter.
LEGEND:
{curly brackets} = observations
= important updates
(parentheses) = information
~ tilde/approximation = variable value
-hyphen = fixed value
AUD/USD Breakout Done , Should We Buy To Get 150 Pips ?Here is my opinion about AUD/USD , If we checked 4H Timeframe , we will see that we have a clear breakout and the price closed above my C.T.L , So i`m looking to buy this pair and targeting 150 pips , but i will enter with small lot size cuz this week is very risky due to monthly closure .
AUDUSD LONG SIGNALUnder current market conditions, the area near 0.6407 has been identified as a critical support zone, where the AI model detects a high-probability trade setup.
From a technical perspective, a clear directional bias based on recent price action patterns. Suppose the market demonstrates increased volume and price stability above key moving averages in the 0.6407 area. In that case, traders are advised to monitor for trend-continuation entry opportunities in alignment with the prevailing momentum.
Profit targets are defined at 0.6437 and 0.6489, corresponding to logical technical resistance zones. These levels are designed for staged profit-taking across different trade management styles. Stop-loss should be strictly enforced at the designated level; once breached, the strategy is considered invalidated in order to limit potential downside.
AUD/USD Breakout And Ready To Continue To Upside , Agree ?Here is my opinion on AUD/USD , Yesterday the price closed below the res but today again the price back above it and giving amazing bullish P.A , And breakout already done , so we have a very good chance to buy it now and targeting 150 pips , cuz if you checked dxy you will see the price at strong res area so i think it`s a good chance to buy AUD/USD .
audusd sell signal. Don't forget about stop-loss.
Write in the comments all your questions and instruments analysis of which you want to see.
Friends, push the like button, write a comment, and share with your mates - that would be the best THANK YOU.
P.S. I personally will open entry if the price will show it according to my strategy.
Always make your analysis before a trade
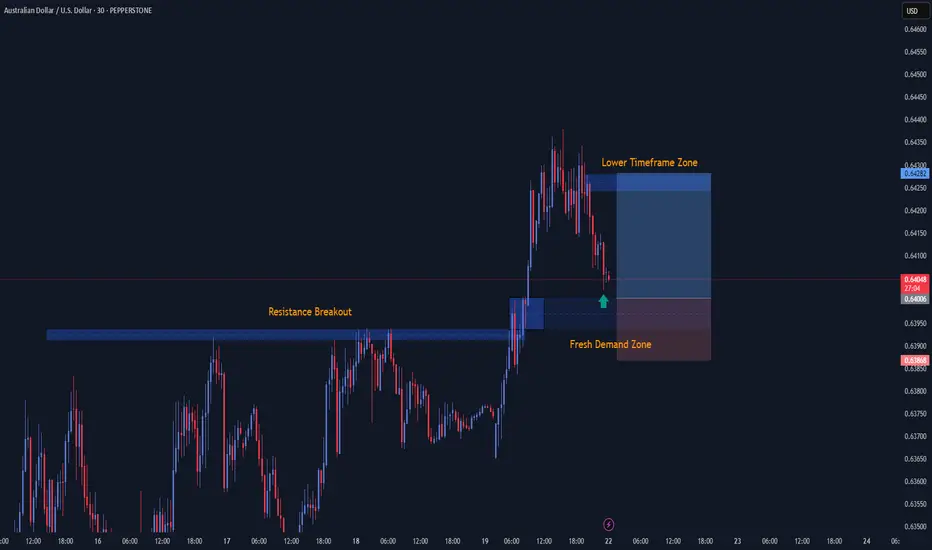
AUDUSD Price Action🛑Hello Traders, Stop overthinking — take action! 💥
In this chart, you can clearly see a resistance breakout, and I’ve also marked a fresh demand zone. Do we know if it’s going to hold? Nope — and that’s why we use a stop loss 🛡️.
But I noticed the USD weakening 💸 and AUD gaining strength 💪, which gave me more confidence in the setup. Before price even reached the demand zone, we already saw signs of rejection 🚫. Jump into a lower timeframe ⏱️, and you’ll see the picture even clearer.
🎯 Trading is a patience game. Let the market come to you.
I’ve built tools to accurately detect these zones 🧰 — yet some of you still rely on signals 📲, and that’s exactly what’s holding you back.
Stay focused. Trust the process. 💯
AUDUSD,GBPUSD and NZDUSDHello traders, this is a complete multiple timeframe analysis of this pair. We see could find significant trading opportunities as per analysis upon price action confirmation we may take this trade. Smash the like button if you find value in this analysis and drop a comment if you have any questions or let me know which pair to cover in my next analysis.

AUDUSD Discretionary Analysis: Recovery Mode ActivatedIt’s that feeling when the engine’s been cold for a while, but now it’s starting to rev. AUDUSD is flashing signs it wants to push up — not in a rush, but with purpose. I’m seeing strength building, like it’s getting ready to climb. Recovery mode’s not just activated — it’s already in motion. I’m calling for upside here. If it plays out, I’ll be riding the move. If not, hey, I’ll wait for the next setup. But right now? I like the long.
Just my opinion, not financial advice.

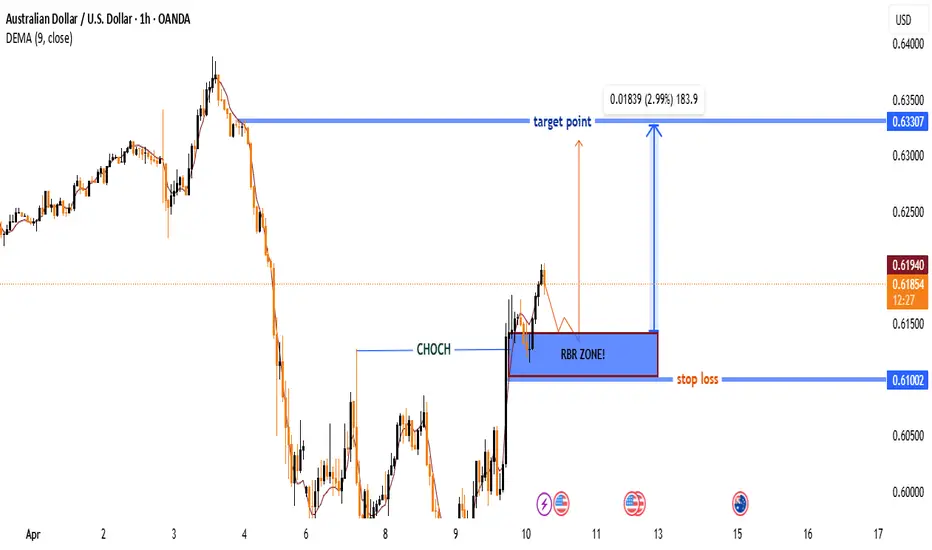
AUD/USD Bullish Breakout Setup – RBR Zone StrategyAUD/USD 1H Chart Analysis
1. Trend Shift Identified
⚡ CHoCH (Change of Character) detected!
Price broke above a previous high → Potential trend reversal from bearish to bullish.
🔸 Bearish → Bullish Shift!
2. Key Zone: RBR Zone
🔵 RBR (Rally-Base-Rally) Zone!
This is a strong demand zone where buyers stepped in.
Price is expected to return here before continuing upward.
⬇️ Price retracement
⬆️ Reentry opportunity!
3. Trade Setup
📍 Entry: In the blue RBR zone
🛑 Stop Loss: Below zone at 0.61002
🎯 Target: At 0.63307
Trade Idea:
Risk: 🔻 Small (below RBR zone)
Reward: 🔺 Big (up to previous structure)
R:R Ratio = 3:1 ✔️
4. EMA (Exponential Moving Average)
📈 9 EMA is trending upward
Price is above the EMA → Bullish momentum confirmed
Summary
Buy setup forming after trend reversal
Watch for price reaction in the RBR zone
If support holds → 🚀 to the target!
Sellers Trapped! AUD/USD Flips Structure to BullishAustralian Dollar / U.S. Dollar (AUD/USD)
📆 Timeframe: 1-Day (1D)
📈 Technical Breakdown:
1. Sideways Consolidation Zone
The price has been consolidating within a clear horizontal range.
This range is defined by upper resistance and lower support zones, with several rejections confirming the boundaries.
2. Downtrend Resistance Line Broken
A long-standing resistance trendline has been breached to the upside.
This breakout suggests a potential trend reversal or continuation rally if price holds above.
3. Seller Trap Identified
There was a strong liquidity sweep below the support zone, labeled “Sellers Got Trapped.”
This is a classic liquidity grab, where shorts were likely triggered before price reversed sharply upward.
4. EMA 50 as Dynamic Support
Price has reclaimed the 50 EMA (0.62701), indicating a shift in short-term momentum towards the bulls.
If the price remains above this moving average, it could act as a dynamic support in the near term.
5. RSI (Relative Strength Index) at 57.62
RSI is in bullish neutral territory, suggesting there’s still room for upward momentum before overbought levels (>70).
No bearish divergence is currently visible.
✅ Bullish Outlook:
Breakout above resistance trendline ✅
Recovery above EMA 50 ✅
Seller trap below range ✅
RSI supports further move ✅

Fri 11th Apr 2025 Daily Forex Charts: 8x New Trade SetupsGood morning fellow traders. On my Daily Forex charts using the High Probability & Divergence trading methods from my books, I have identified 8x new trade setups this morning. As usual, you can read my notes on the charts for my thoughts on these setups. The trades being a AUD/JPY Buy, XAU/USD Buy, AUD/USD Buy, XAG/USD Buy, NZD/USD Buy, NZD/CAD Buy, GBP/AUD Sell & GBP/USD Buy. I also discuss some trade management. Enjoy the day all. Cheers. Jim

#AUDUSD: Three Swing Target Accumulating Total of 1400+ Pips! Analysing the AUDUSD currency pair on a broader timeframe of three days reveals a bearish trend. This suggests a potential final decline in prices before a significant bullish surge in the market.
Two golden lines are drawn around the entry area, indicating potential entry points at the first, second, or intersection of these lines. Alternatively, the first and second lines can serve as entry and stop loss points, tailored to your trading strategy.
Additionally, important economic indicators are set to impact the market. For instance, the Non-Farm Payrolls (NFP) report scheduled for this coming Friday will significantly influence the direction of the DXY monthly price.
If you find our analysis valuable, please consider liking and commenting on our ideas. Your feedback will be instrumental in our efforts to provide more detailed and insightful analysis.
Much Love and Gratitude for your support in advance, happy to help.❤️🚀
Team Setupsfx_
