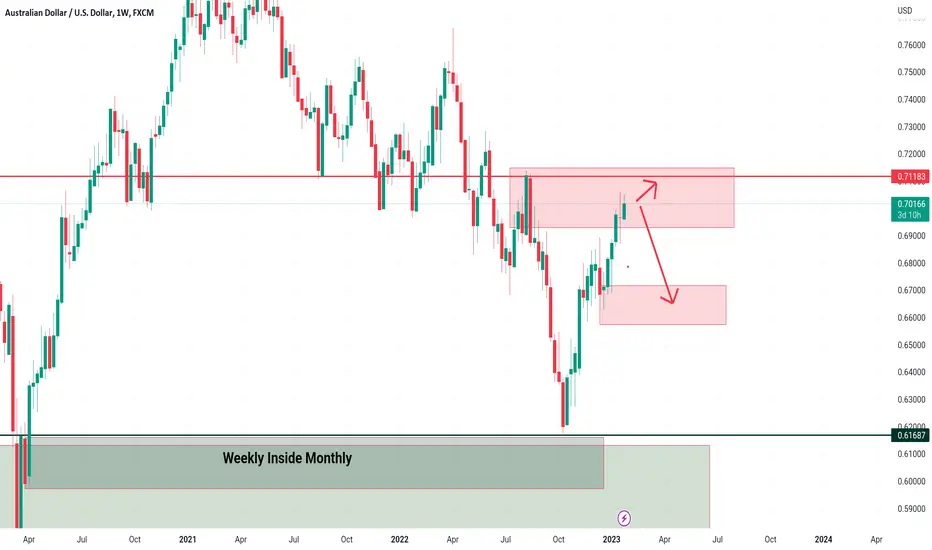
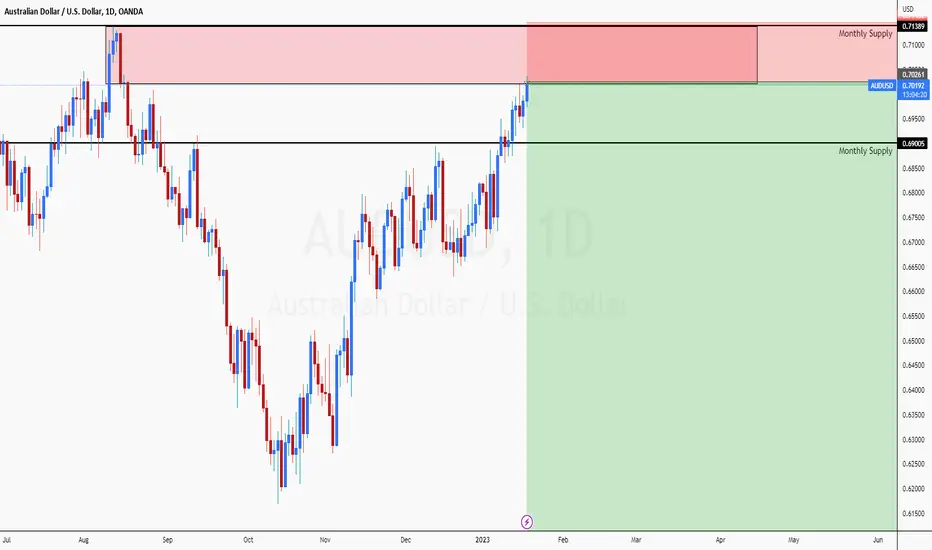
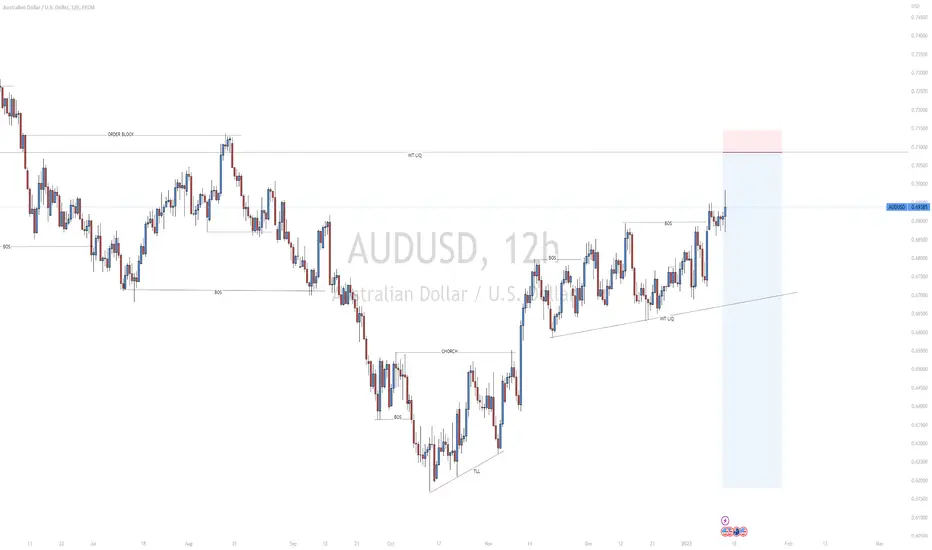
Time To SELL ??We are deep inside a Monthly SUPPLY/SELL zone with a strong resistance located @ 0.71 thus now is a good time to start to look for a sell signal for a move down to test the newly formed WEEKLY DEMAND/BUY zone starting at the 0.66 area.
What I expect to occur over the next period is maybe a spike up to test the 0.71 the market may spike above it as could be an area where there may be some liquidty, I will wait for my TRFX indicator to give me a signal on a chart between 6hr and daily chart only then will my sell trade to be confimed.
Once in the trade we should get an easy drop down to the 0.68 level which was a previous HIGH in the current uptrend this is the first easy target for the position second target will be the weekly DEMAND/BUY zone this will also be a good area to look to buy this pair again for a move up towards the 0.73 area.
Enjoy
Audusdsell
AUDUSD trading idea for next week 23.1.2023 (4 Minutes analysis)I will be shorting AUDUSD from 0.7250 and exit around 0.676. Let me know what do you think.

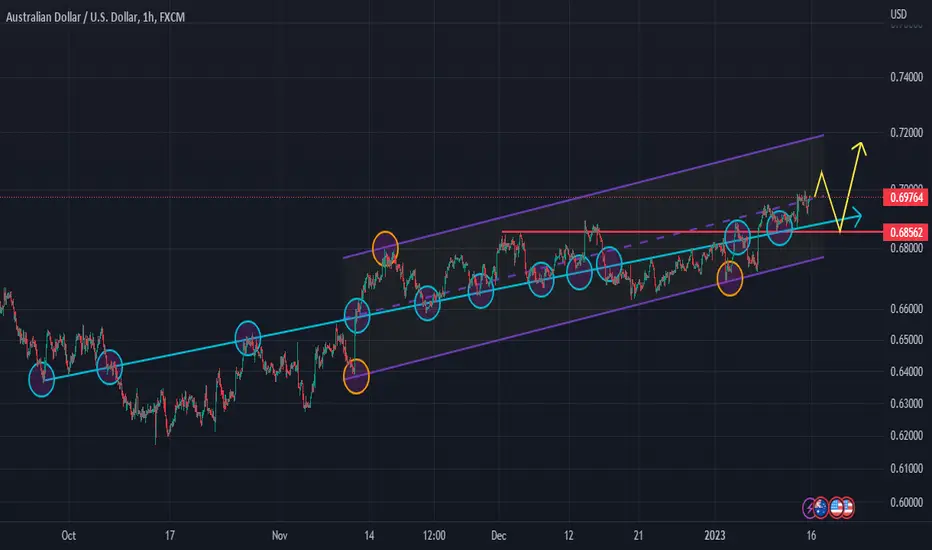
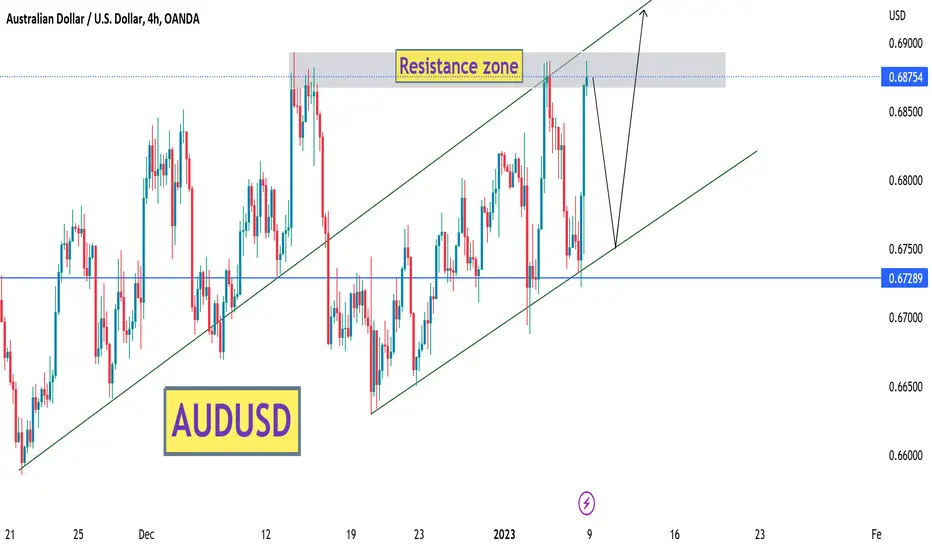
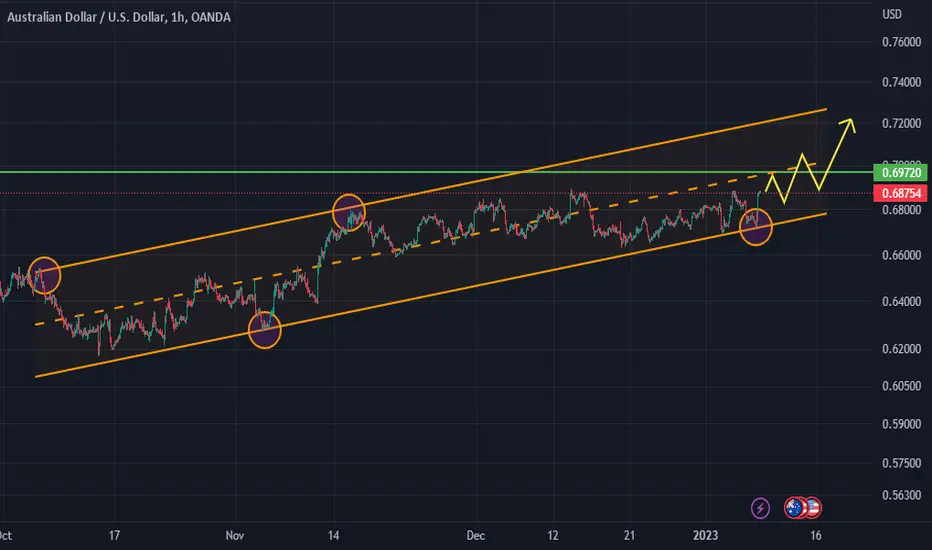
AUD/USD :: Movement between the middle line and the trend line.AUD/USD :::
The trend is generally upward and the continuation of the path will be between the middle line of the channel and the trend line, after which the trend will change.

AUDUSD-Hello Traders, hope you all are progressing and improving everyday so am I, here is quick look on #audusd the pair has been bullish ever since we had NFPs and CPI data, however, as we are expecting DXY to be bullish, in our opinion there is higher probability of dxy to be bullish in coming days and hey, trading is all about proability and knowledge right?. So let's use this setup to book some profit.
-What you all think about this pair?
-It would be really appreciated if you can show the support by liking the idea and following us!!!
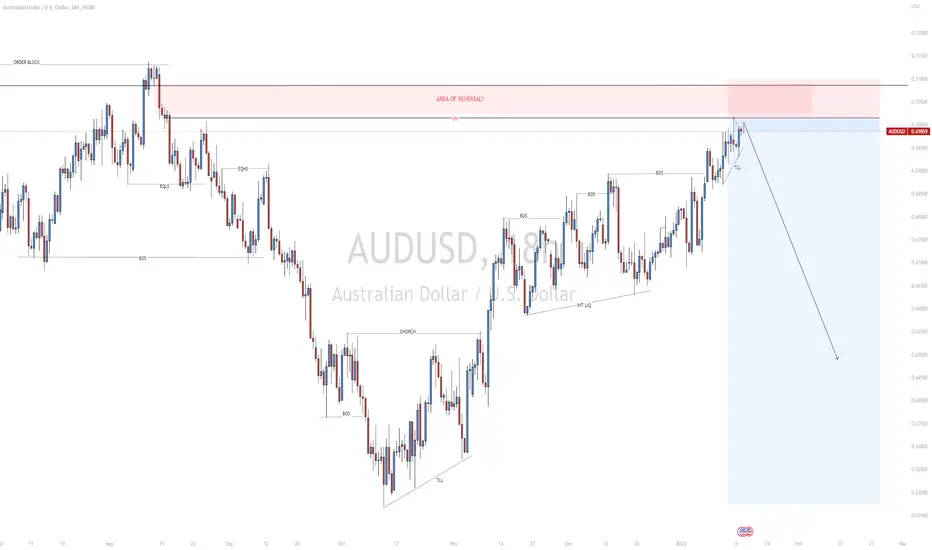
AUDUSD - BIG SHORT OFF MONTHLY SUPPLYAudusd - Daily - Aussie has reached near the end of its 4 months long uptrend and now comes into a peak monthly supply zone...Expect a sharp reversal and sell off on this pair from current levels..
#AUDUSD- SHORT EXPECTING THIS MOVE!-After recent data (CPI/INTIAL JOB LESS CLAIMS) we have now clear understanding of #DXY/
-DATA projected that 6.5% CPI which is an prediction of FED ensuring that they are not looking to increase rate hikes any time soon.
-Expecting DXY will continue falling until it reaches 100.00 price area zone.
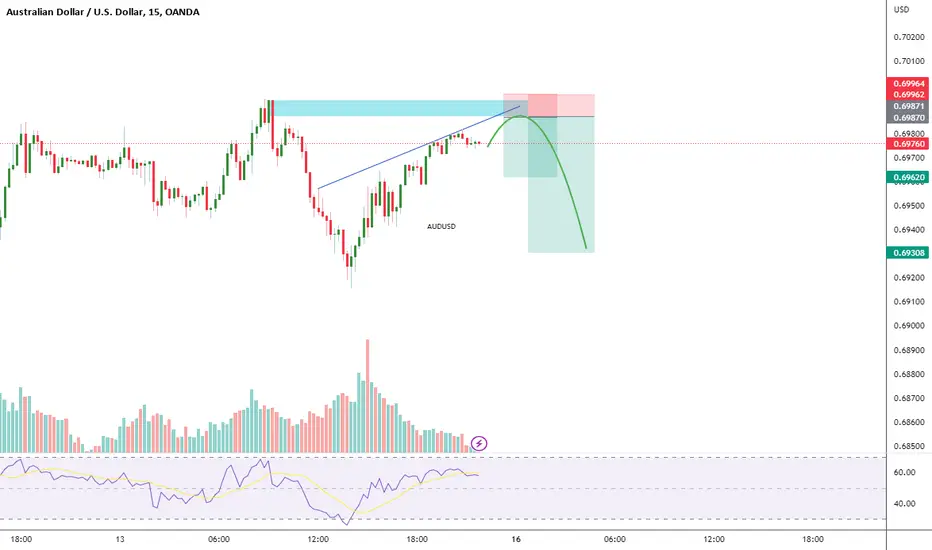
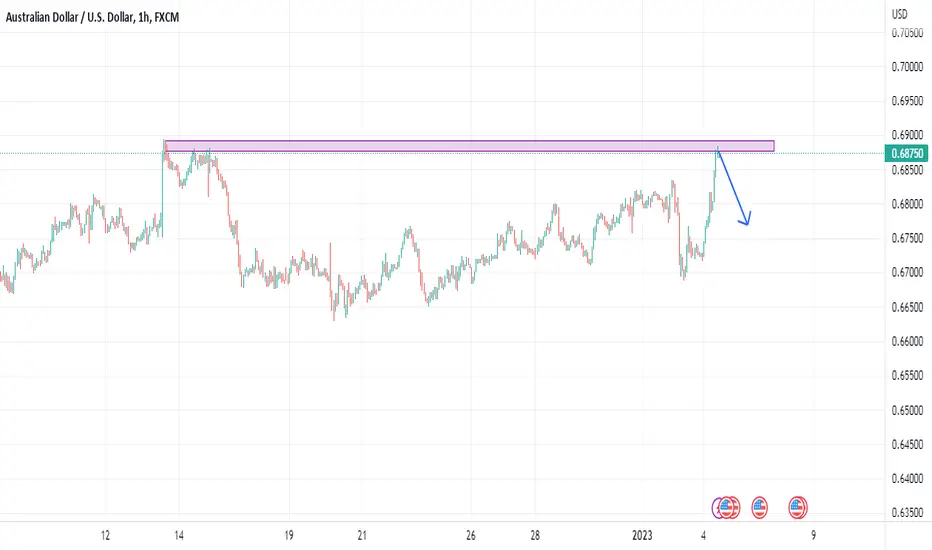
AUDUSD M15, Expecting ShortAUDUSD M15, Expecting Short because of strong resistance with order block and upcoming strength of USD
AUD/USD :: Playing with the trend line .AUD/USD :::
The price is in an upward trend and has created a valid trend line. If it is generally stated: the price reacts to this line, that is, if the price is above the line, it will go down, and if the price is below the line, it will go down. It will move upwards, which will result in corrective movements .
AUDUSD : Short Trade , 4hAUDUSD sell Entry : 0.69314
Stop : 0.70213 , Target : 0.67536
Risk/reward Ratio : 2

AUDUSD Trading Plan - 12/Jan/2023Hello Traders,
Hope you all are doing good!!
I expect AUDUSD to go Down after finishing the current wave.
Here, we are expecting a bigger correction as of now & if we get that, then the updated idea will be shared for the next potential trade.
Look for your SELL setups.
Please follow me and like if you agree or this idea helps you out in your trading plan.
Disclaimer: This is just an idea. Please do your own analysis before opening a position. Always use SL & proper risk management.
Market can evolve anytime, hence, always do your analysis and learn trade management before following any idea.
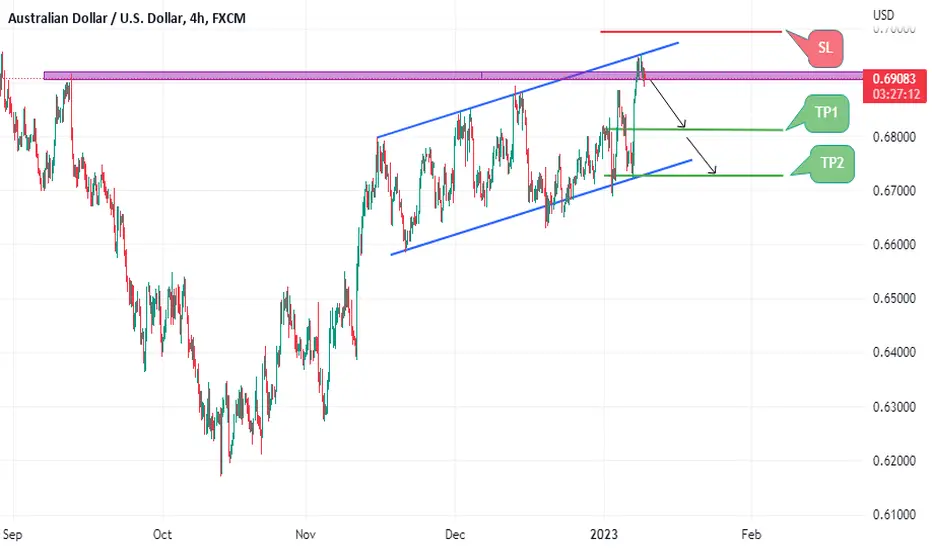
AUDUSD : Short Trade , 4hAUDUSD sell Entry : 0.69040
Stop : 0.69925 , Target1 : 0.68113 , Target2 : 0.67266
Risk/Reward Ratio : 2
AUDUSD- SHORT WHAT DO YOU THINK??Expecting a nice clean move on this pair as currently the price is suffering around our key level and we think price will reverse from last week close.
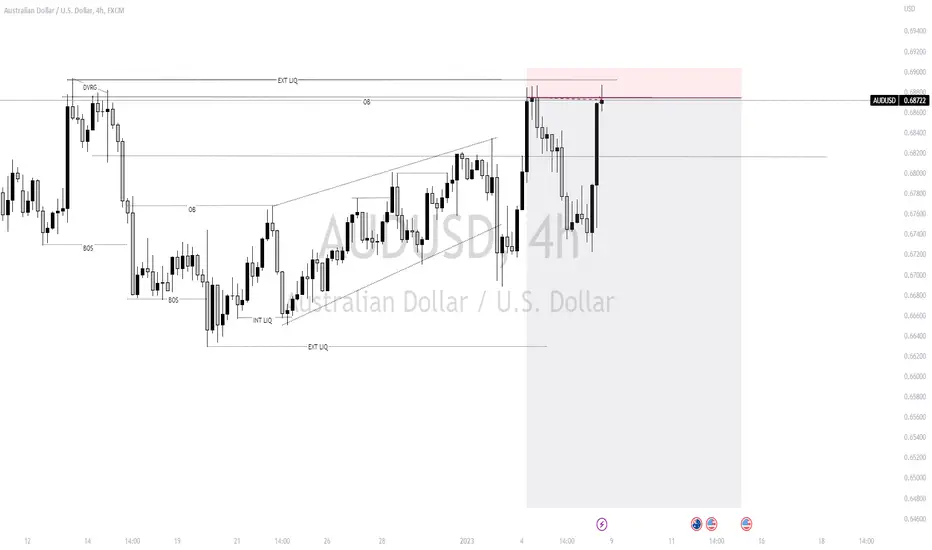
AUDUSD SHORT: Sell-Off In ImpulseAUDUSD is showing considerable weakness signs.
The structure on the up-side since mid-December is Corrective.
A sell-off in a big degree is expected.
I am anticipating Intermediate (C) (red).
My Aussie technicals:
* Ending Diagonal in Intermediate (C) (white)
* Elliott Wave Reversal Pattern
* Upcoming Bearish Divergence
* Running Flat in Minor B (white)
* Double Top Pattern
* Supply Zone
* 161.8% Fibonacci Extension
AUDRUSD SELL Signal:
* Entry @ 0.69250
* SL @ 0.7100
* TP1 @ 0.6620
* TP2 @ 0.6455
* TP3 @ 0.6325
* Safety Measure: when in the green, moving SL to BE.
* SELL Stops on the way down, after pull-backs.
Many pips ahead!
Richard, the Wave Jedi.

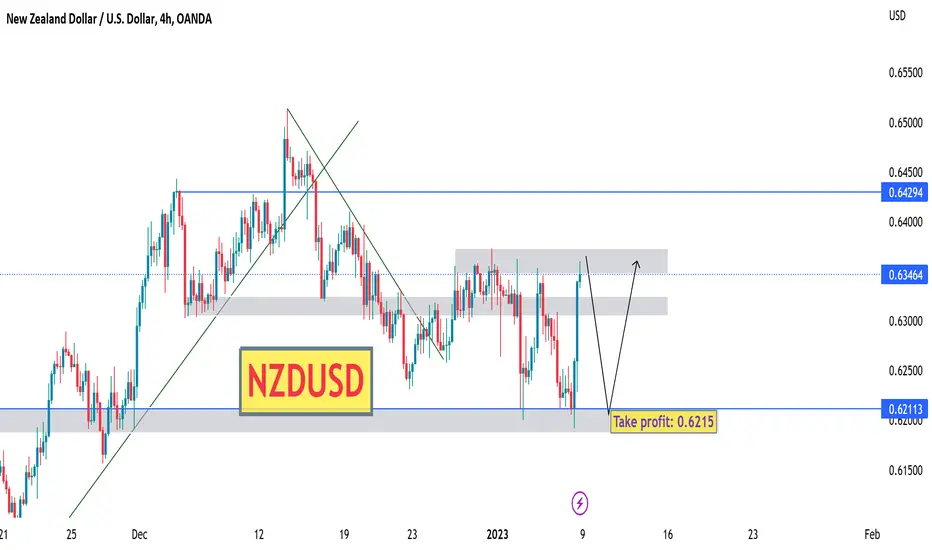
NZDUSD SellThe market of NZDUSD is standing exactly on its major resistance zone. Many chances that the market will fall from here.
AUDUSD sellThe AUDUSD is touching its resistance line of trend line. I believe it will fall from here.
AUD/USD :: price increase .AUD/USD :::
The middle line of the channel defines the trend well. In general, the channel is ascending and the price is moving towards the middle line of the channel.
The 0.7 range can be the next destination.
<<< Good luck >>>
AUDUSD-SHORT, 180 PIPS TARGET -AUDUSD expecting this pair to drop more from our order block though, it would be wise to target small take profit.
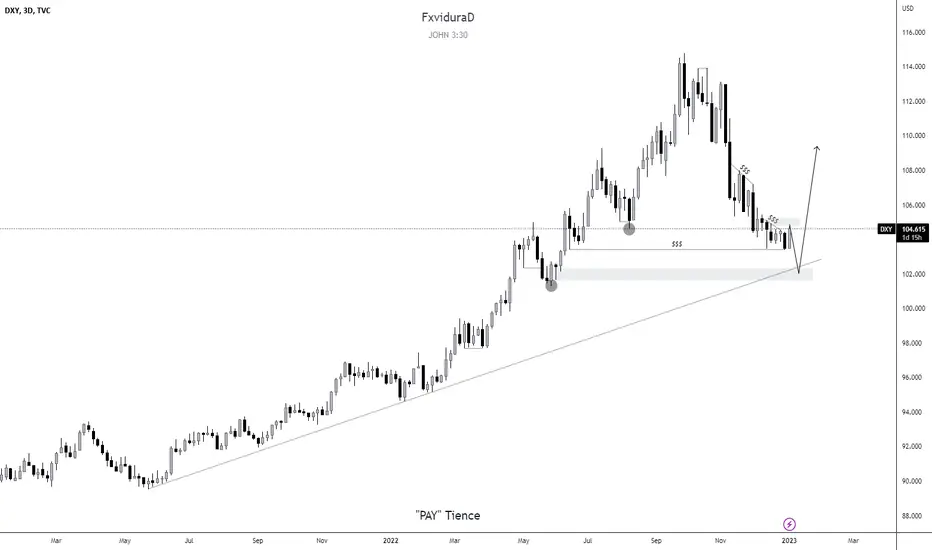
DXY IS ABOUT TO RISE ONCE AGAIN There are a lot of liquidity resting below on DXY and has a weekly trend line with a weekly demand, we might see another bearish trend once again on USD based pairs once we reach this certain level
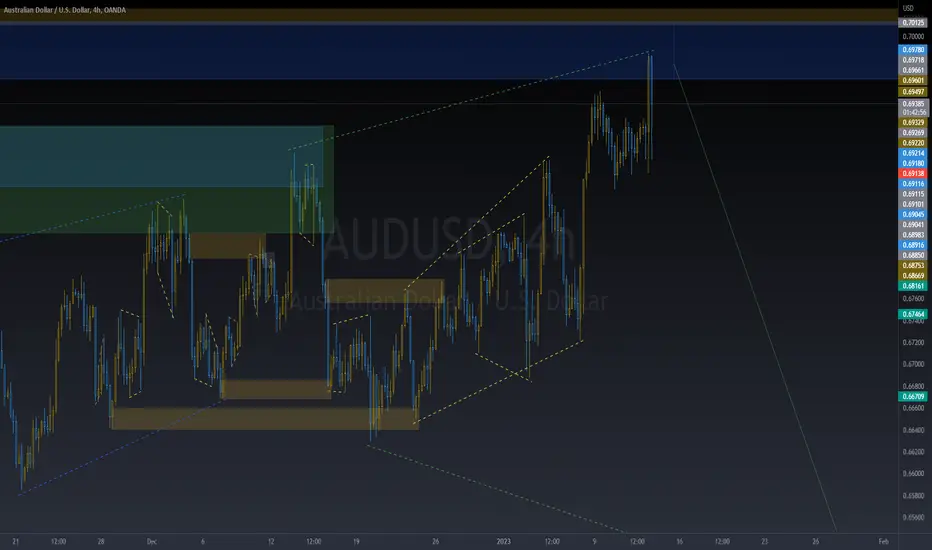
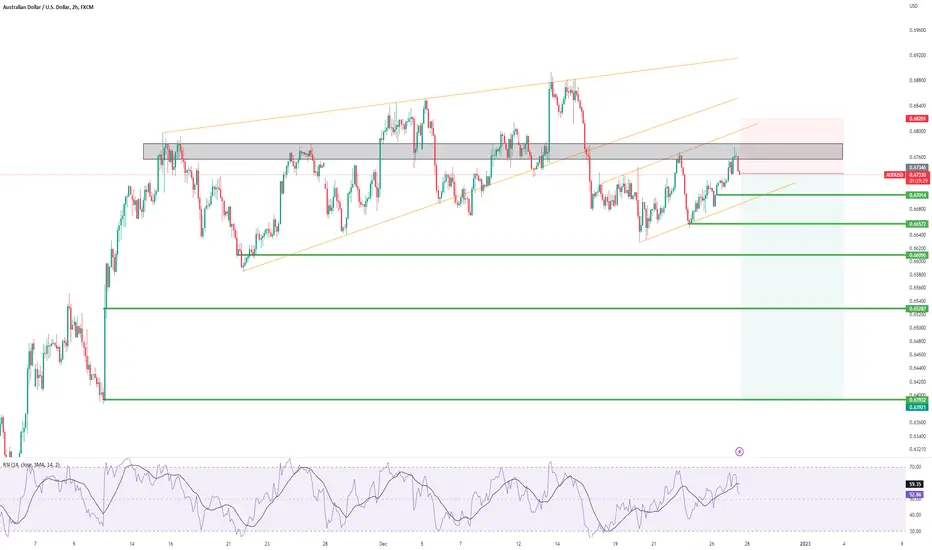
AUDUSD SHORT FOR Risk : reward of 1:3
As per the Daily chart we clearly see that Price has violated Demand Zones and we have a Fresh Daily Supply Zone formed, Price is aleady coming from a Monthly Supply in the higher timeframes and hence the Target is a Monthly Demand formed at 0.65512.
Once Price violates a Demand in lower timeframes like 1H and 4H we will have another trade with an amazing Risk: Reward ratio. But for now 1:3 is also a considerable Risk to reward ratio hence shorting.
Happy Money Making !!!

AUD/UDVery simple ... Very clear!
Everything is marked on the chart.
This is my personal opinion. Please do not trade based on my analysis and data.
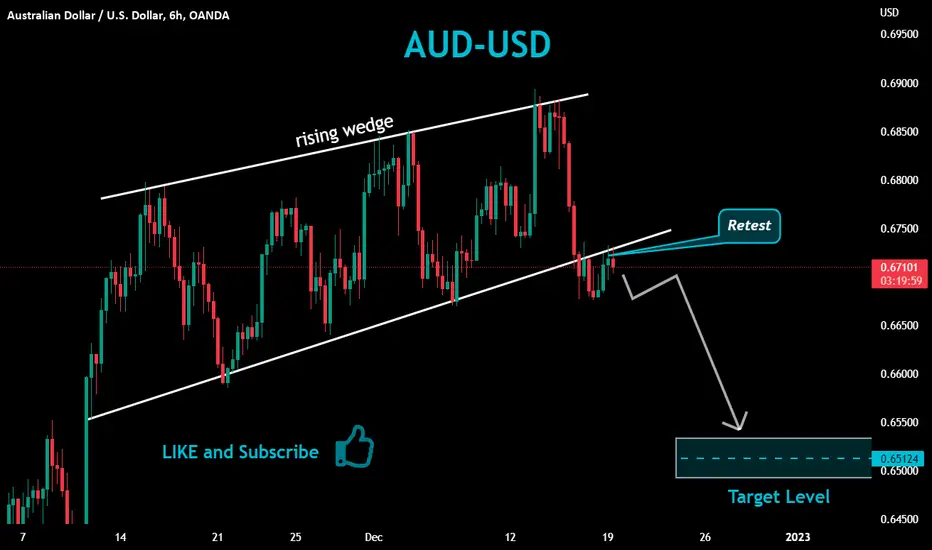
AUDUSD Will Fall! AUD-USD broke out of the rising wedge
And the breakout is confirmed
So after the pullback and retest
I will be expecting a move down
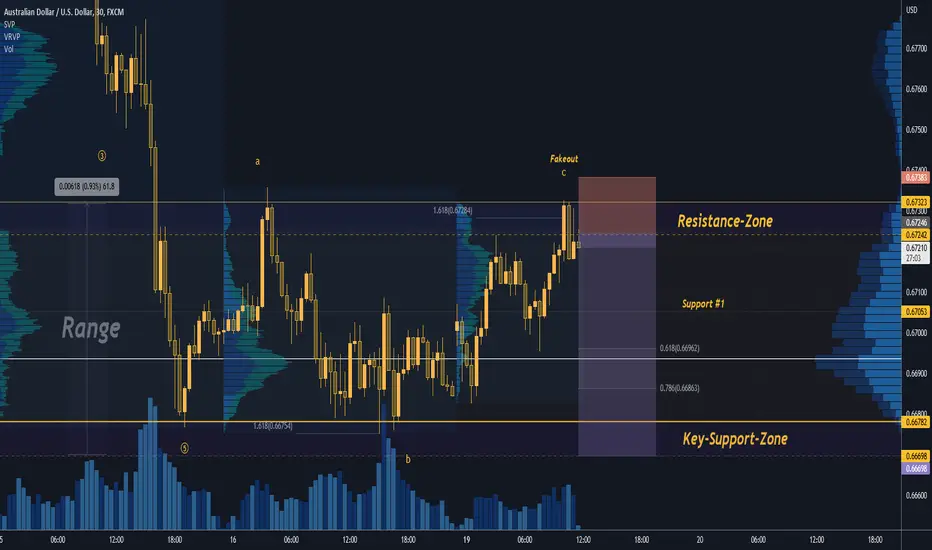
AUD/USD Likely to fall!Hey tradomaniacs,
good opportunity to short AUD/USD here as USD power is back!
Technically a great fakeout confirmed by the market-depth!
What do you think?