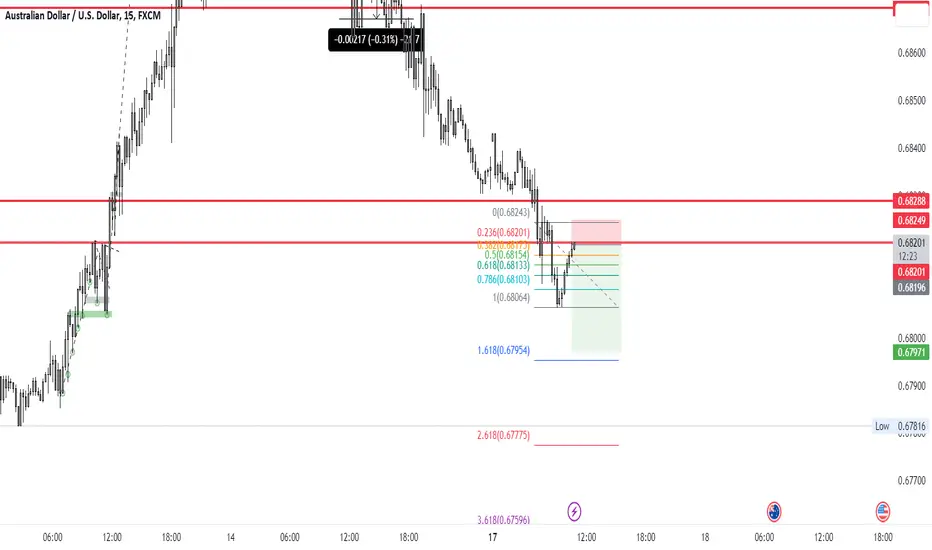
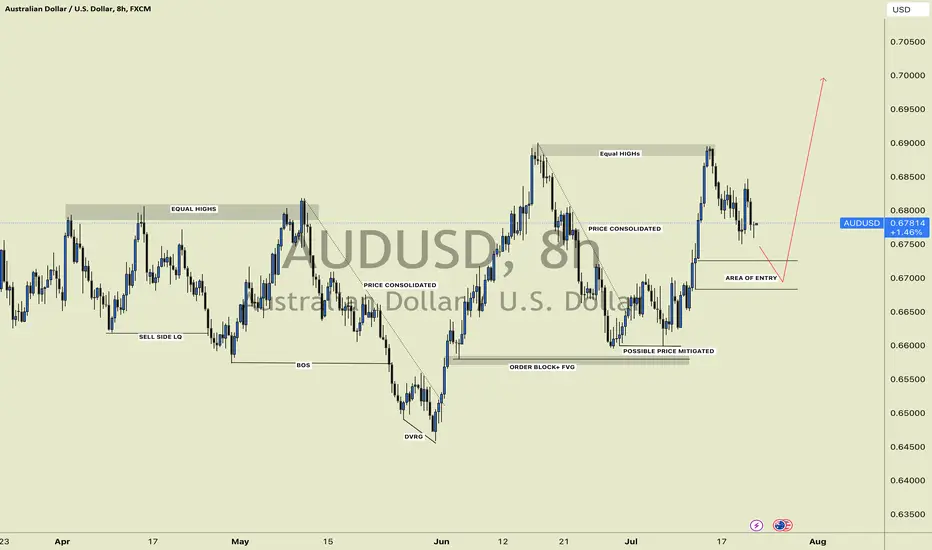
AUDUSD Buy IdeaLiquidity Grab on H2 and Expansion Shows that there are Some Pending Orders and Internal Liquidity (FVG) There. Expecting a Bullish Move Resumption in Zone
if MSS happened on M15.
Look for MSS/Sweep Based CHoCH/Swing CHoCH as Confirmation.
Audusdshort
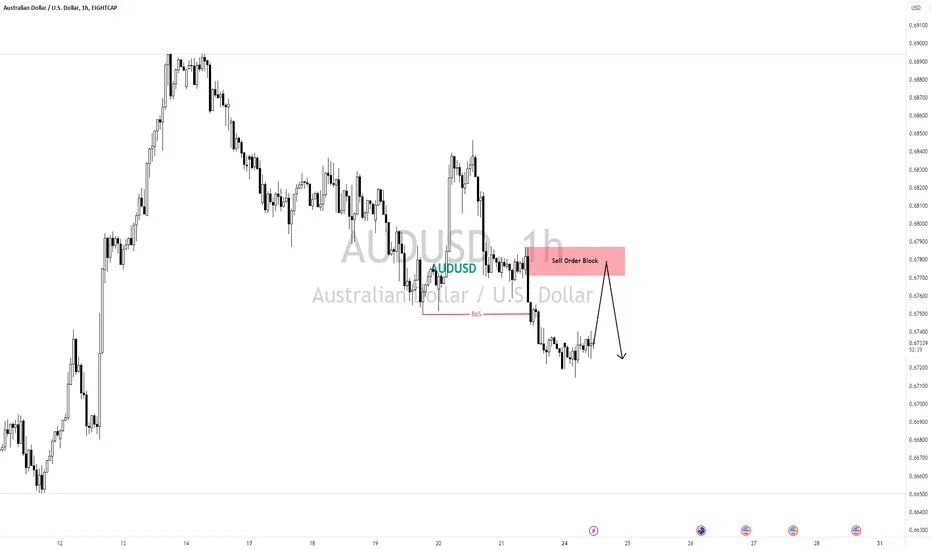
AUDUSD Prediction H1Here is my analysis for AUDUSD on H1 using Order Block. The price could go bearish, you can put a pending order on the Order block or find an entry on LTF within OB Zone. Trade Safe!

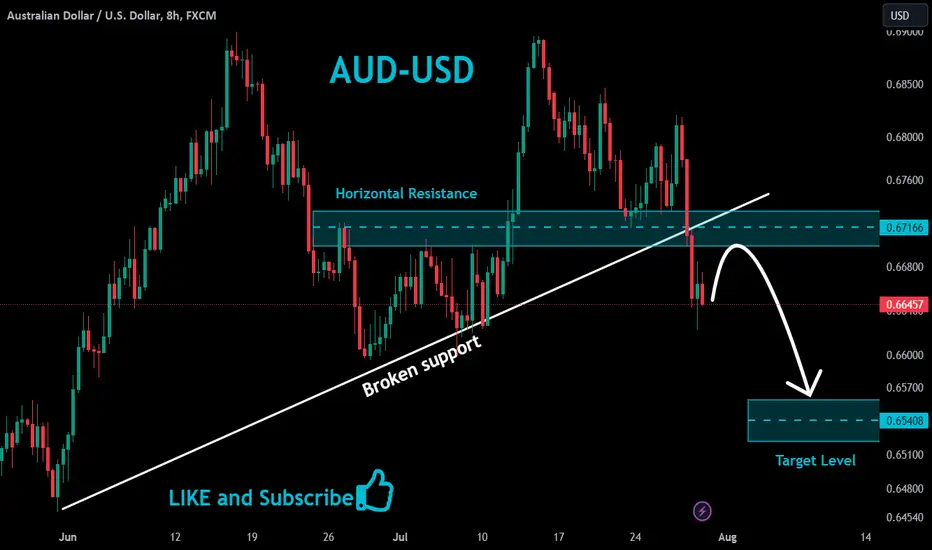
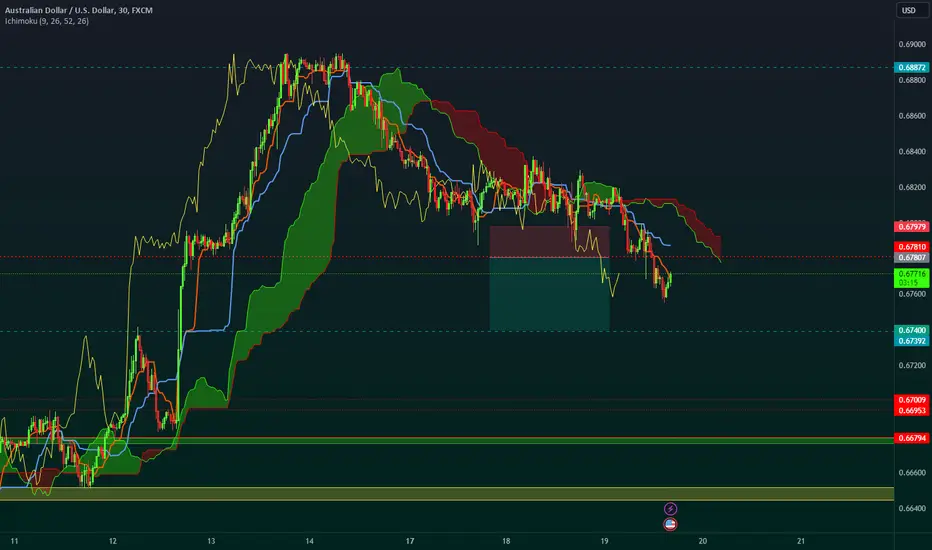
AUDUSD the condition is closing 4h candle under 0.6606 AUDUSD
stabilizing above 0.6606 will support rising to touch 0.6640 then 0.6694 then 0.6724
stabilizing under 0.6606 will support falling to touch 0.6542 and then 0.6501
the condition is closing 4h candle under 0.6606
Pivot Price: 0.6606
Resistance prices: 0.6640 & 0.6694 & 0.6724
Support prices: 0.6542 & 0.6501 & 0.6469
tendency: bearish
timeframe:4H

AUDUSD - SELL - Inflation and Interest rate forecastThere seems to be a movement in the opposite direction from the original bearish movement. My prediction is the Buyers are making a prediction forecast in the event of lower inflation for AUSSIE and a no-interest rate hike for USD.
However, according to my pattern analysis, the price has not completed its full reversal on price yet. Therefore, there is still a potential for a downside bearish movement.
Please note that the information presented on TradingView is sourced from a third-party provider. It is important to remember that you are solely responsible for making trading decisions for your account. Trading involves a very high level of risk. Any information or content provided is strictly for research, educational, and informational purposes and should not be considered as investment advice, consultation advice, or an investment strategy. The information provided is not customized to meet the investment requirements of any specific individual, and it does not take into account the investment objectives, financial situation, or needs of any recipient who may access it. This is not financial advice and we are not responsible for your losses that may occur following our analysis!!!
If you find this analysis of AUD/USD helpful, please give me a boost, or like to show your support. My first public Idea post

AUDUSD - SHORT SETUP - SELL
The Stochastic Oscillator %K value is 84.92% and the %D value is 91.64%. Both values are above 80, indicating an overbought condition. This suggests that the price has reached a relatively high level and a pullback or reversal may be likely. The price is likely to retrace back to around .66300.
From the Daily time frame, it is evident that the price is nearing a significant supply area. This suggests the possibility of a downward correction. We should observe whether the market will present us with a suitable trading setup.
Please note that the information presented on TradingView is sourced from a third-party provider. It is important to remember that you are solely responsible for making trading decisions for your account. Trading involves a very high level of risk. Any information or content provided is strictly for research, educational, and informational purposes and should not be considered as investment advice, consultation advice, or an investment strategy. The information provided is not customized to meet the investment requirements of any specific individual, and it does not take into account the investment objectives, financial situation, or needs of any recipient who may access it. This is not financial advice and we are not responsible for your losses that may occur following our analysis!!!
If you find this analysis of AUD/USD helpful, please give me a boost, or like to show your support. My first public Idea post
EURUSD and AUDUSD Top-down analysis Hello traders, this is a complete multiple timeframe analysis of this pair. We see could find significant trading opportunities as per analysis upon price action confirmation we may take this trade. Smash the like button if you find value in this analysis and drop a comment if you have any questions or let me know which pair to cover in my next analysis.

AUDUSD Will Fall!AUD-USD is now trading
Below the supply cluster
Of rising and horizontal
Resistance levels so I am
Bearish biased and a
Move down is to be expected !
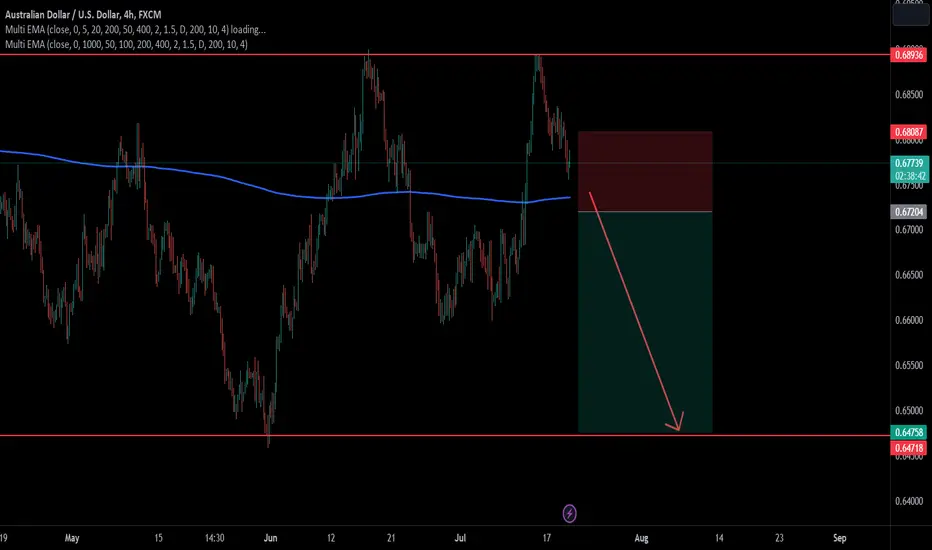
Possible "M" pattern in AUDUSD in the making?AUDUSD appears to be getting ready for a Short opportunity with a good Risk:Reward ratio. Cross of 200 EMA from above will be a confirmation.
Watch out for the same.
audusd sell. Don't forget about stop-loss.
Write in the comments all your questions and instruments analysis of which you want to see.
Friends, push the like button, write a comment, and share with your mates - that would be the best THANK YOU.
P.S. I personally will open entry if the price will show it according to my strategy.
Always make your analysis before a trade
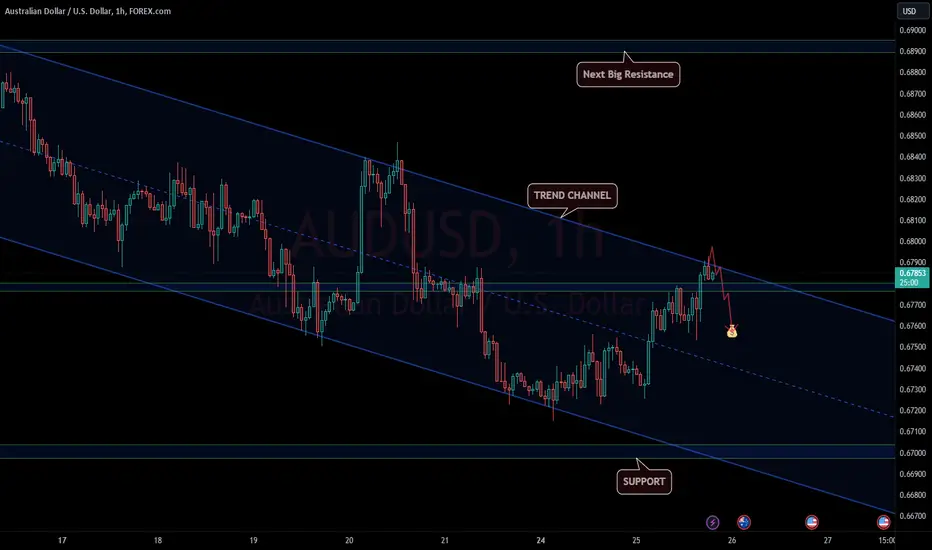
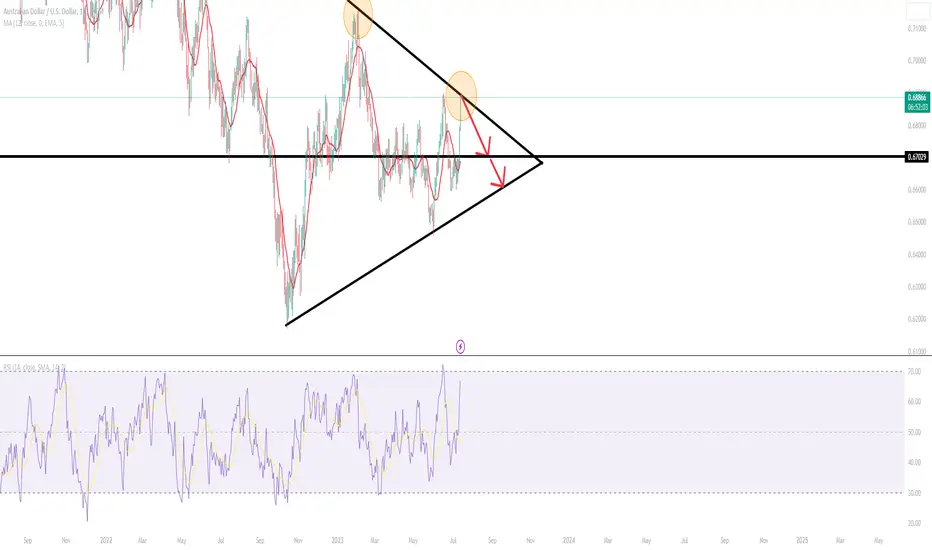
AUDUSD Correction inside Trend ChannelAfter my last AUDUSD idea was a success, I now think of a correction in the downtrend channel.
Still, AUDUSD would need to break above the vital hurdle at the June and July highs of around 0.6900 to confirm that the trend had reversed to up from down. Until then, the path of least resistance remains sideways, within the recently well-established range of 0.6500-0.6900
Data due on Wednesday is expected to show that Australia CPI eased to 1.0% on-quarter in the April-June quarter from 1.4% in the January-March quarter, and 6.2% on-year in Q2-2023 from 7.0% in the previous quarter. On a monthly basis, CPI is expected to have eased to 5.4% on-year in June from 5.6% in May.
Therefore, the bearish trend will remain suggested until now.
My target is 0.67580
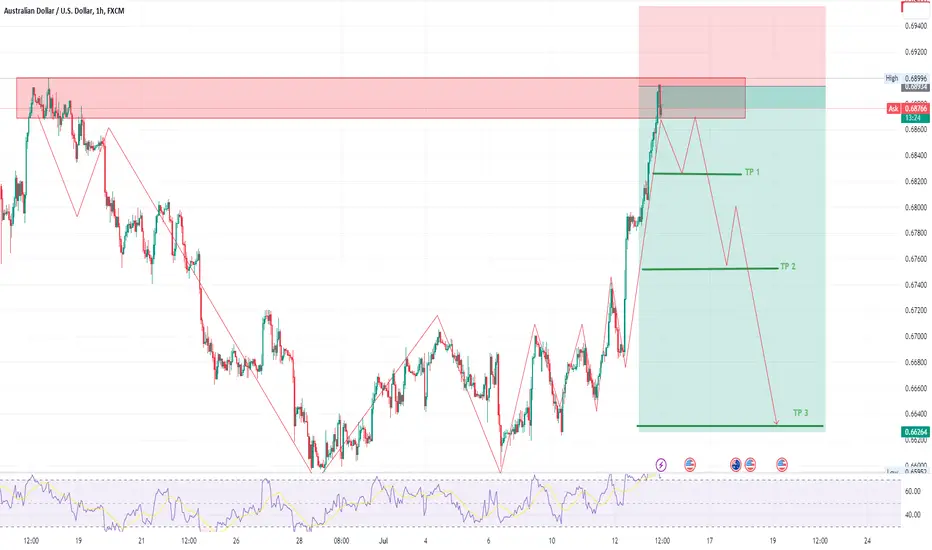
AUDUSD Analysis H1Here is my analysis for AUDUSD on H1 using Order Block. The price could go bearish, you can put a pending order on the Order block or find an entry on LTF within OB Zone. Trade Safe!
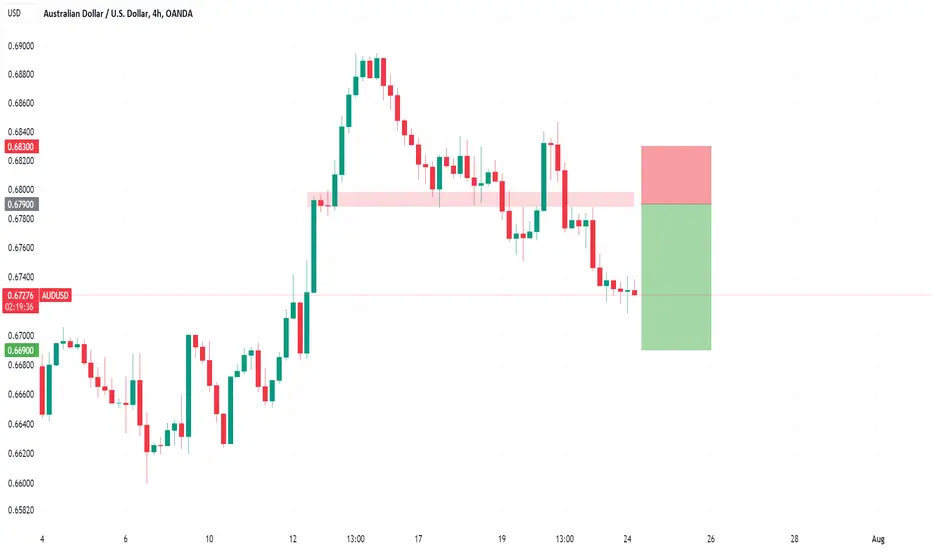
AUDUSD to see a temporary move higher?AUDUSD - 24h expiry
We are trading at oversold extremes.
A Doji style candle has been posted from the base.
A higher correction is expected.
Short term bias has turned negative.
We therefore, prefer to fade into the rally with a tight stop in anticipation of a move back lower.
We look to Sell at 0.6790 (stop at 0.6830)
Our profit targets will be 0.6690 and 0.6620
Resistance: 0.6810 / 0.6890 / 0.7010
Support: 0.6620 / 0.6460 / 0.6380
Risk Disclaimer
The trade ideas beyond this page are for informational purposes only and do not constitute investment advice or a solicitation to trade. This information is provided by Signal Centre, a third-party unaffiliated with OANDA, and is intended for general circulation only. OANDA does not guarantee the accuracy of this information and assumes no responsibilities for the information provided by the third party. The information does not take into account the specific investment objectives, financial situation, or particular needs of any particular person. You should take into account your specific investment objectives, financial situation, and particular needs before making a commitment to trade, including seeking advice from an independent financial adviser regarding the suitability of the investment, under a separate engagement, as you deem fit.
You accept that you assume all risks in independently viewing the contents and selecting a chosen strategy.
Where the research is distributed in Singapore to a person who is not an Accredited Investor, Expert Investor or an Institutional Investor, Oanda Asia Pacific Pte Ltd (“OAP“) accepts legal responsibility for the contents of the report to such persons only to the extent required by law. Singapore customers should contact OAP at 6579 8289 for matters arising from, or in connection with, the information/research distributed.
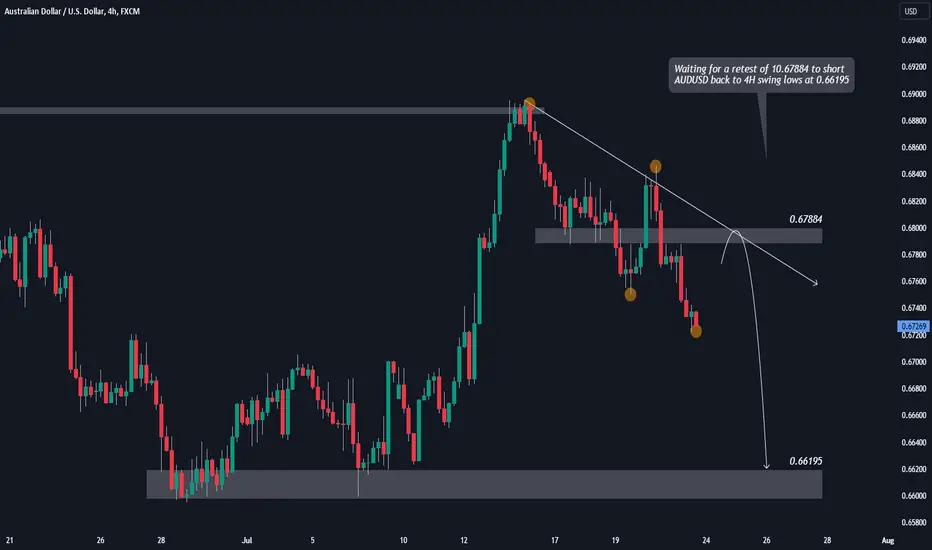
AUDUSD SHORT - BIG BEARISH SWING!Waiting for a retest of 10.67884 to short AUDUSD back to 4H swing lows at 0.66195
If you agree drop a like and if you have any questions leave a comment :)
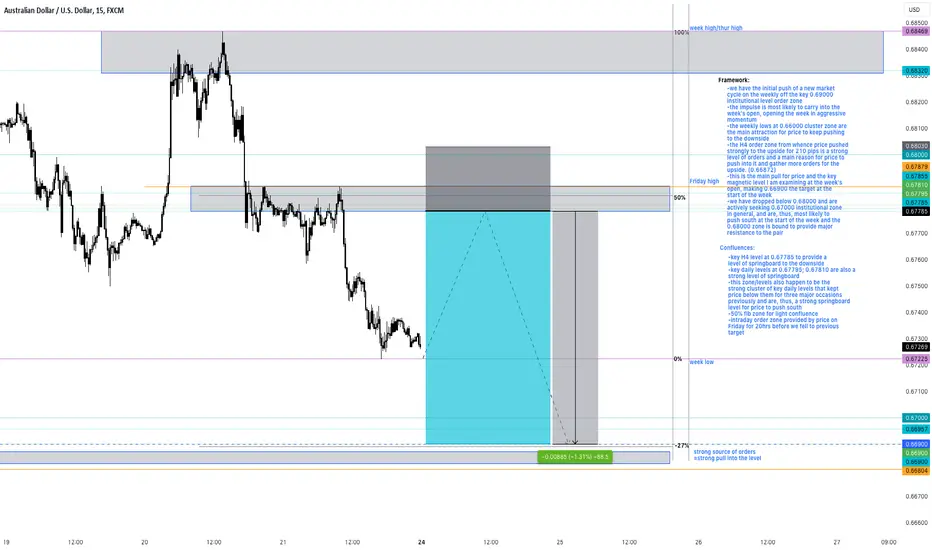
AUDUSD Sell SetupHere is the reason why I am anticipating this sell:
Weekly:
-we have an initial push to the downside off the key institutional level at 0.69000 which
provided a level of sell orders at the close of June
-we are in a new sell cycle and have initiated sells in a strong manner, establishing momentum
to the downside at the onset
-this momentum is the key reason for the sell outlook
-the weekly lows, clustering around 0.66000 institutional level are providing incentive for
price to push further to the downside
H4:
-we are officially bearish on H4
-we had a strong drop at the close of the week, culminating at around 0.67300 round level
-the next phase on H4 is most likely a bullish push to retrace the closed selloff impulse last week
-after that I anticipate a sell into the next target, the -27% extension of the recent swing, making
the target around 0.66890. This translates to my target of 0.66900 to be perfect for the setup
Midrange/H1
-I anticipate a push into the mid-level order zone clear on H4 around 0.67800
-the key daily levels thereon portend a strong area of resistance and had been used before by
price to keep the pair below this specific level (check daily chart)
-since we formed an order zone hereon recently, I expect price to reach to these levels around
0.67800 then push to the downside, aiming for the strong order level from which the most
recent highs came from, which is around 0.67782 and very much in the vicinity of the -27%
extension
This is the overall trade
NOTE: this is just an opinion of mine and should not be construed as financial advice. Use your own analysis to come up with your own decisions.
AUDUSD- 21/07/2023 UPDATE❤️Dear traders ,following our last setup on AUDUSD we now have a second entry which we can maximise for another 200 pips or more.
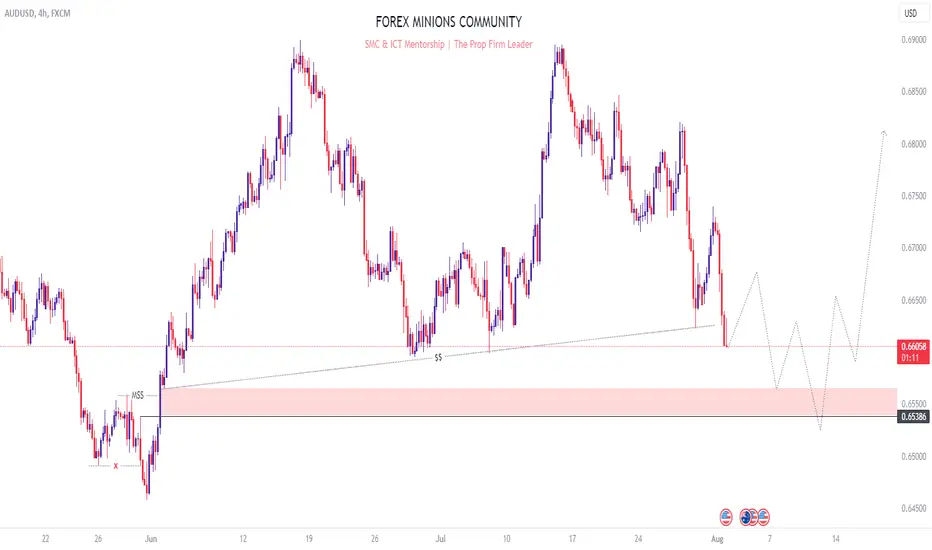
AUDUSD long term forecastAUDUSD, in the long run, is going to be one hell of a ride
Why? You may ask, while things look pretty straightforward at the moment, price doesn't always go as planned. Especially when trading on the lower time frame. However, for those who utilize the H1, H4, and even daily timeframe, this should be a good wave to ride.
First post here, will be offering more as time goes on.
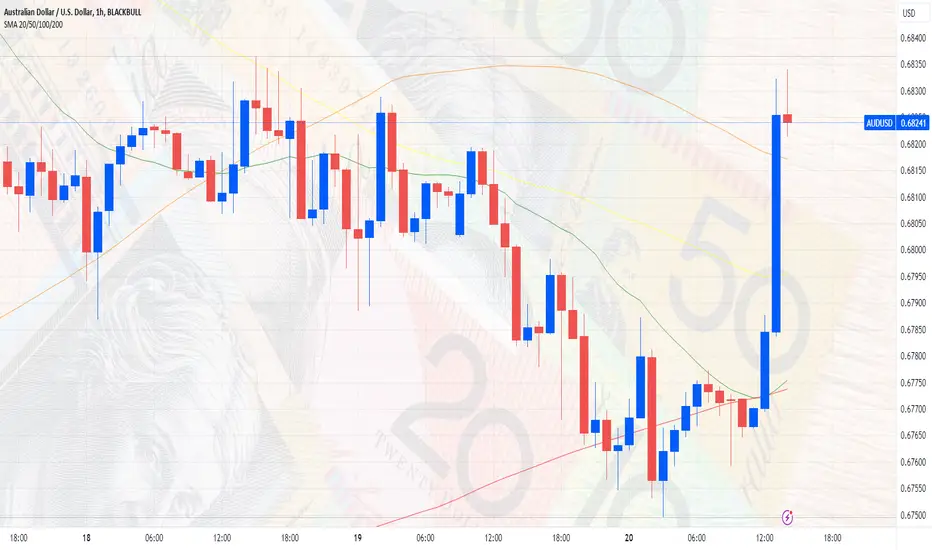
32,600 Jobs Added! Aussie Dollar Skyrockets!The Australian dollar has surged, driven by an impressive employment report that far exceeded expectations. In the month of June, Australia's net employment rose by a staggering 32,600 compared to the previous month, surpassing estimates by more than double.
This development propelled the Aussie currency up by over 0.9%, reaching an intra-day high of $0.6834. The New Zealand dollar also rode the wave, gaining 0.57% to reach $0.6299. Both Antipodean currencies are now poised to reverse the losses incurred over four consecutive trading sessions.
The current market sentiment favors the bulls, with both short and long-term momentum in their favor. Price action is trading above the 50 and 200-day moving averages, reinforcing the positive outlook for the Australian dollar.
Elsewhere in the currency market, the sterling is doing its best to counter deep losses following a sharp fall in the previous session. The decline was prompted by Britain's inflation data, which fell short of market expectations.
The British pound managed a modest recovery, trading 0.15% higher at $1.2958 in the latest session.
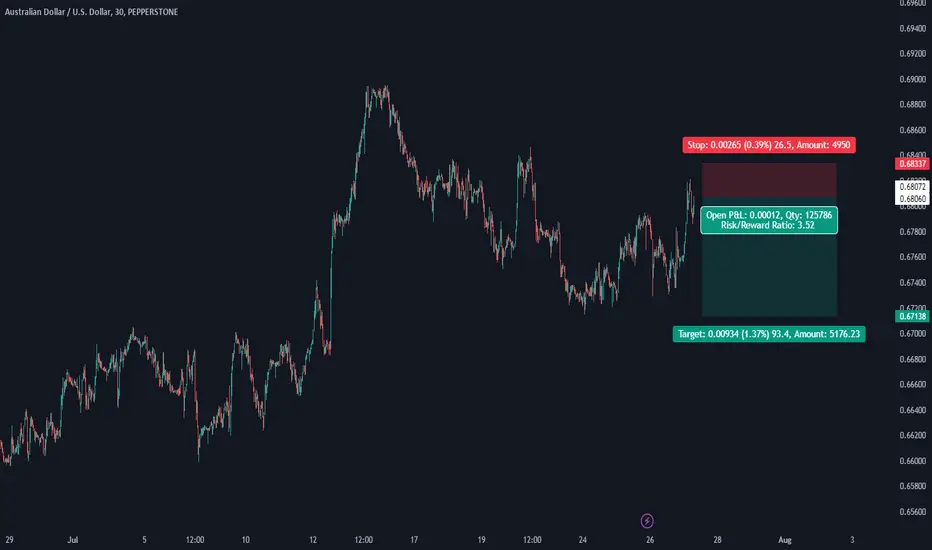
Sell AudUsd m30A suitable short-term opportunity has emerged for this currency pair, but do not forget to set a stop-loss. The risk-to-reward ratio is appropriate.
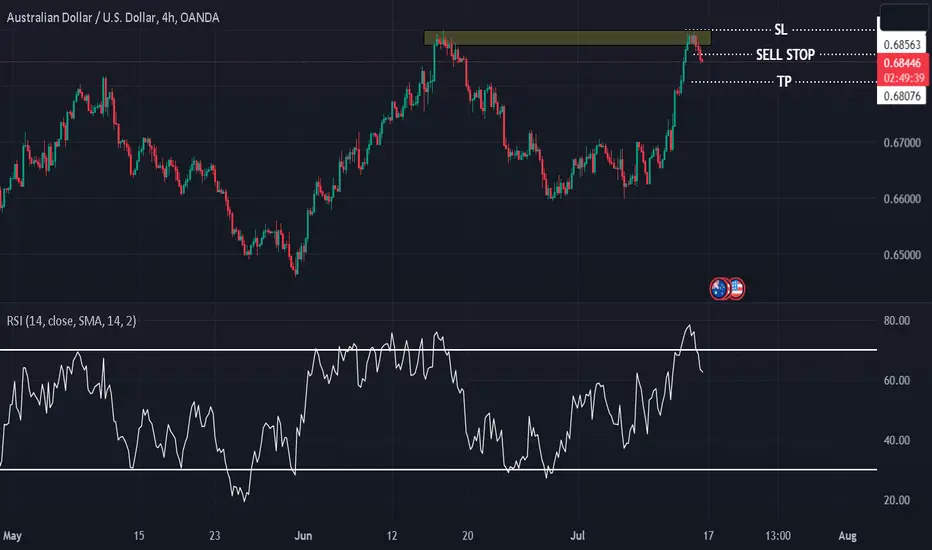
AUDUSD shortI am seeing major resistance stoppage for AUDUSD and I will be selling AUDUSD 0.68877 (current price) if you enter please put a stop loss of 25 pips from entry. Long term swing trade. TP is open.
AUDUSD BUYHi, according to my analysis of the AUDUSD pair. There is a possibility of an uptrend with a retest of the price. Double button model. There is strong support in this area 0.65000. And this is just a corrective wave. to return to height. Good luck everyone .Note: If you like this analysis, please give your opinion on it. in the comments. I will be happy to share ideas. Like and click to get free content. Thank you

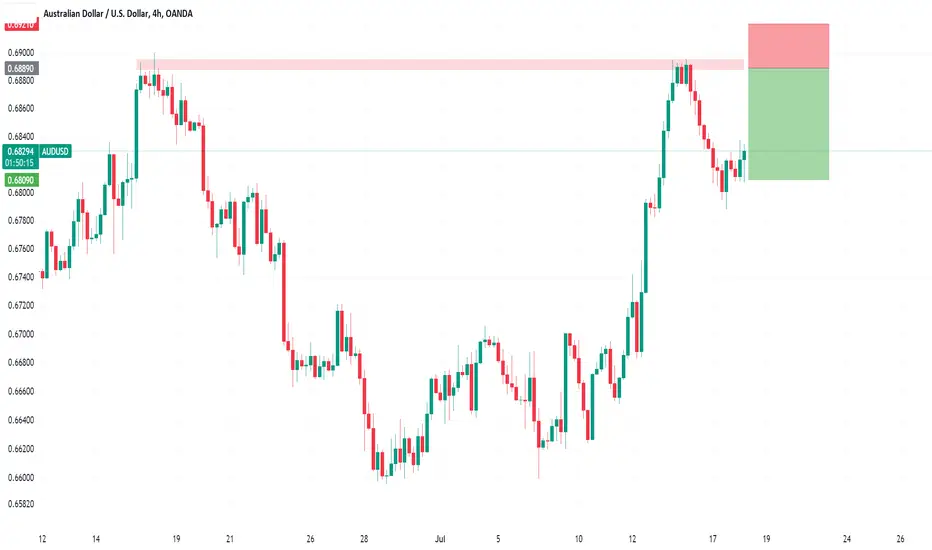
AUDUSD continues to hold back the bulls.AUDUSD - 24h expiry
0.6900 has been pivotal.
0.6895 has been pivotal.
0.6900 continues to hold back the bulls.
Preferred trade is to sell into rallies.
We look for a temporary move higher.
We look to Sell at 0.6889 (stop at 0.6921)
Our profit targets will be 0.6809 and 0.6785
Resistance: 0.6837 / 0.6850 / 0.6890
Support: 0.6807 / 0.6787 / 0.6770
Risk Disclaimer
The trade ideas beyond this page are for informational purposes only and do not constitute investment advice or a solicitation to trade. This information is provided by Signal Centre, a third-party unaffiliated with OANDA, and is intended for general circulation only. OANDA does not guarantee the accuracy of this information and assumes no responsibilities for the information provided by the third party. The information does not take into account the specific investment objectives, financial situation, or particular needs of any particular person. You should take into account your specific investment objectives, financial situation, and particular needs before making a commitment to trade, including seeking advice from an independent financial adviser regarding the suitability of the investment, under a separate engagement, as you deem fit.
You accept that you assume all risks in independently viewing the contents and selecting a chosen strategy.
Where the research is distributed in Singapore to a person who is not an Accredited Investor, Expert Investor or an Institutional Investor, Oanda Asia Pacific Pte Ltd (“OAP“) accepts legal responsibility for the contents of the report to such persons only to the extent required by law. Singapore customers should contact OAP at 6579 8289 for matters arising from, or in connection with, the information/research distributed.
AUDUSD SHOrt SqueezeAUDUSD is at stong resistance and being Monday a trend is to be set till Friday, more weekly short positions so going with trend