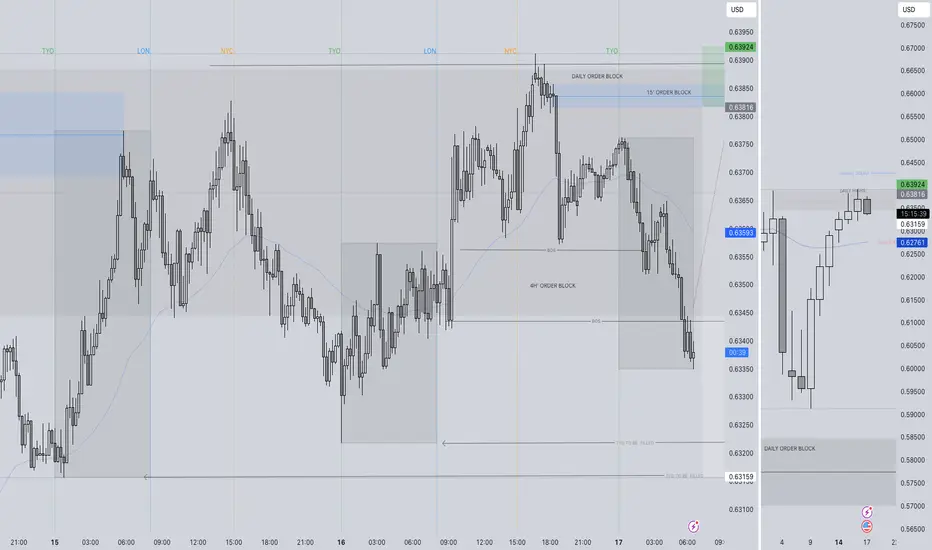
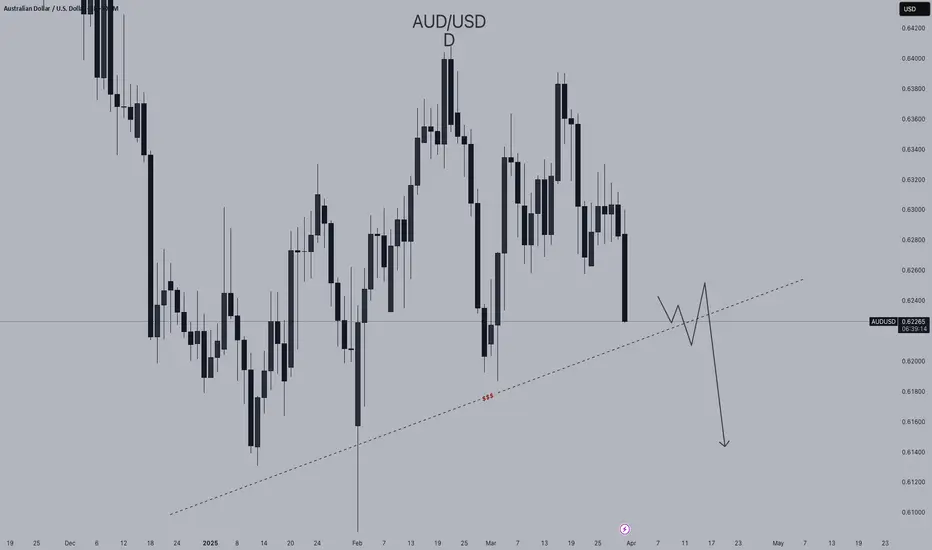
AUDUSD SHORT FORECAST Q2 W16 D17 Y25AUDUSD SHORT FORECAST Q2 W16 D17 Y25
GM GM.
Summary
+ Daily high rejection
+ Weekly order block rejection
+ Weekly 50 EMA edging closer to price action
+ 4H bearish close
+ 1H continued short
+ 15' intraday breaks of structure
Just a few confluences mentioned.
Entry Model
Tap
Lower time frame break of structure/ Bearish candle stick formation from point of interest.
FRGNT X
Audusdshort
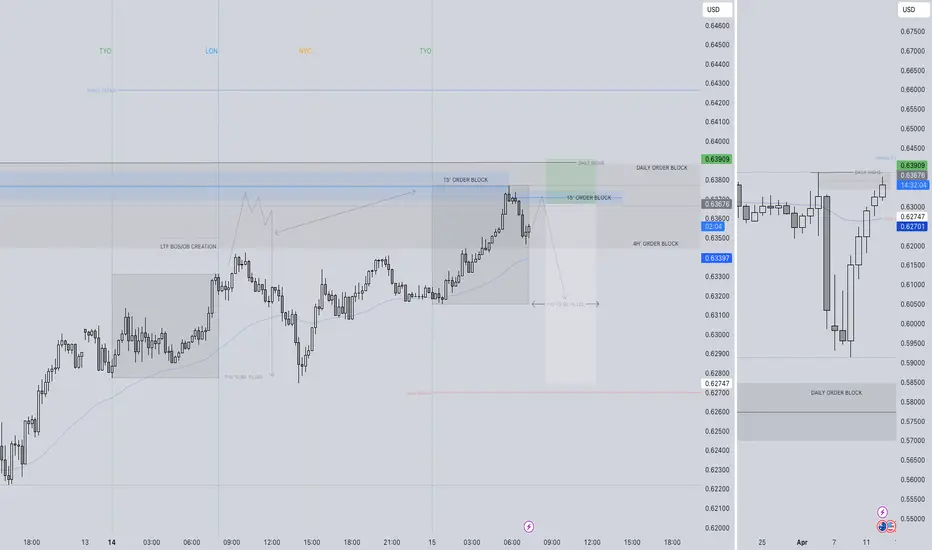
AUDUSD SHORT FORECAST Q2 W16 D16 Y25AUDUSD SHORT FORECAST Q2 W16 D16 Y25
GM.
Here's a short forecast for AUDUSD short based of 4 hour order block.
awaiting short confirmation in turn around in price in turn creating a lower time frame order block to be used to short from.
Let's await price action!
FRGNT X

AUDUSD Discretionary Analysis: Recovery Mode ActivatedIt’s that feeling when the engine’s been cold for a while, but now it’s starting to rev. AUDUSD is flashing signs it wants to push up — not in a rush, but with purpose. I’m seeing strength building, like it’s getting ready to climb. Recovery mode’s not just activated — it’s already in motion. I’m calling for upside here. If it plays out, I’ll be riding the move. If not, hey, I’ll wait for the next setup. But right now? I like the long.
Just my opinion, not financial advice.

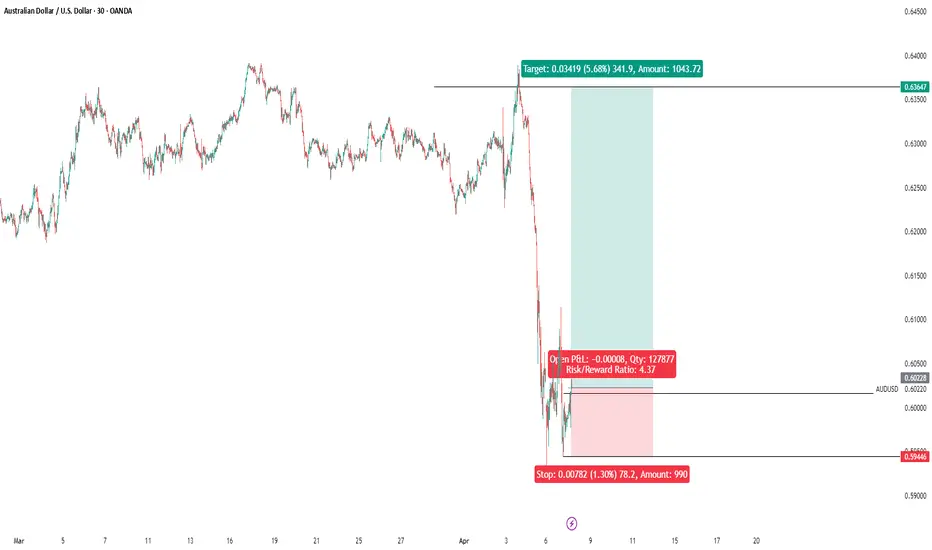
AUDUSD Short Setup Based on DXY AnalysisHello traders!
After closely analyzing the Dollar Index (DXY), I've spotted a key development that has shaped my bearish bias on AUDUSD. The DXY recently broke below a higher timeframe low, rejecting strongly off the July 2023 low after sweeping liquidity on the Weekly chart. This kind of price action signals potential bullish momentum on the dollar in the coming days.
As a result, I’m anticipating weakness across major USD pairs, AUDUSD, EURUSD, GBPUSD, and NZDUSD included.
Here’s my trade setup for AUDUSD:
Entry: 0.63550
Target 1: 0.62748
Target 2: 0.62061
Target 3: 0.61506
Target 4: 0.60951
Stop Loss: 0.64020
I’m expecting a move to the downside if the resistance level at 0.6355 continues to hold, especially with DXY looking primed for further upside.
📈 This idea is based on a combination of liquidity grabs, higher timeframe structure, and DXY confluence, a powerful trio when it comes to swing setups.
If this analysis resonates with your view or adds value to your trading, a boost would be greatly appreciated! 🙌
Stay sharp and trade safe! 💰
DXY (Dollar Index) on Weekly Timeframe
AUDUSD keeps surging upwardFrom a technical analysis perspective, the moving average system presents a typical bullish arrangement pattern. The 5-day moving average and the 10-day moving average are continuously rising and diverging 🚀, providing a solid support foundation for the exchange rate of the Australian dollar against the US dollar. At the moment, the MACD indicator is above the zero axis, and its histogram bars are also continuously expanding 📈, which clearly indicates that the bullish momentum is in a strong state 💪. At the same time, although the KDJ indicator is in the overbought area, there has been no significant sign of a turn, which means that the current upward trend is highly likely to continue 😎.
In terms of fundamentals, Australia's recent economic data has been rather remarkable 🌟. For example, Australia's employment data has shown a good growth trend, and the unemployment rate has decreased, indicating that the vitality of Australia's labor market is increasing 💪, which in turn provides strong positive support for the Australian dollar 😃. In addition, Australia's commodity export data is also quite excellent. As a resource-exporting country, the stable increase in commodity prices and the growth in export volume have greatly promoted Australia's economic development 🚀 and further enhanced the attractiveness of the Australian dollar 😍. In contrast, there is a certain degree of uncertainty in the economic policies of the United States. Especially, the progress of the fiscal stimulus plan has been slow, which has somewhat weakened the market's confidence in the US dollar 😕. Based on considerations of risk, investors have started to gradually shift their funds to other currencies, including the Australian dollar, injecting strong impetus into the rise of AUDUSD 💥.
💰💰💰 GBPUSD💰💰💰
🎯 Buy@1.3200 - 1.3230
🎯 TP 1.3300 - 1.3350
Traders, if you're fond of this perspective or have your own insights regarding it, feel free to share in the comments. I'm really looking forward to reading your thoughts! 🤗
👇The accuracy rate of our daily signals has remained above 98% within a month! 📈 We sincerely welcome you to join our channel and share in the success with us! 👉

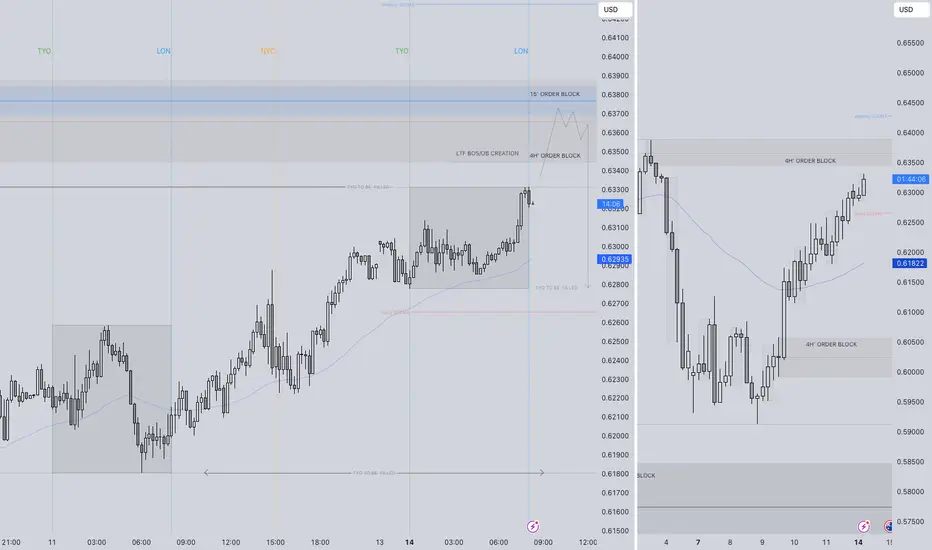
AUDUSD SHORT FORECAST Q2 W16 D15 Y25AUDUSD SHORT FORECAST Q2 W16 D15 Y25
Good Morning Traders!
A very similar setup to what was forecast yesterday! Take a look.
We are sitting in varies higher time frame order blocks with confluence stacking.
We have had a move off the point of interest identified yesterday and a 15' order block was created on the bearish move.
Let price action gravitate to our 15' order block in London for a continued short.
FRGNT X
AUDUSD SHORT FORECAST 4H ORDER BLOCK Q2 W16 D14 Y25
AUDUSD SHORT FORECAST 4H ORDER BLOCK Q2 W16 D14 Y25
Good morning Monday Traders!
FRGNT X
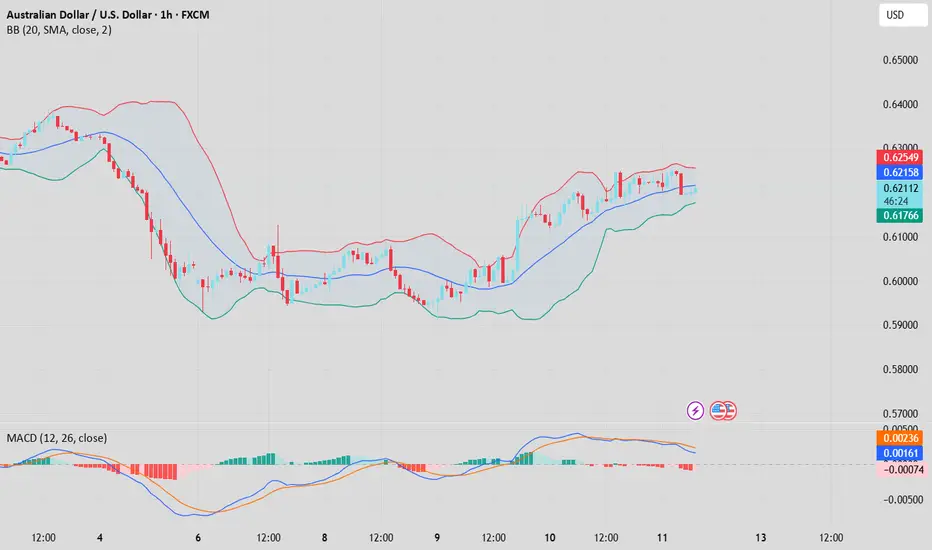
AUDUSD(20250411)Today's AnalysisMarket news:
The annual rate of the US CPI in March was 2.4%, a six-month low, lower than the market expectation of 2.6%. The market almost fully priced in the Fed's interest rate cut in June. Trump said inflation has fallen.
Technical analysis:
Today's buying and selling boundaries:
0.6195
Support and resistance levels:
0.6328
0.6278
0.6246
0.6144
0.6112
0.6062
Trading strategy:
If the price breaks through 0.6246, consider buying, the first target price is 0.6278
If the price breaks through 0.6195, consider selling, the first target price is 0.6144
AUDUSD SELL/ SHORTBy utilizing levels, historical patterns, , we can formulate a hypothesis that the market might follow a similar trajectory if bullish sentiment prevails.
audusd buy signal. Don't forget about stop-loss.
Write in the comments all your questions and instruments analysis of which you want to see.
Friends, push the like button, write a comment, and share with your mates - that would be the best THANK YOU.
P.S. I personally will open entry if the price will show it according to my strategy.
Always make your analysis before a trade
GBPUSD, EURUSD and AUDUSD Analysis todayHello traders, this is a complete multiple timeframe analysis of this pair. We see could find significant trading opportunities as per analysis upon price action confirmation we may take this trade. Smash the like button if you find value in this analysis and drop a comment if you have any questions or let me know which pair to cover in my next analysis.

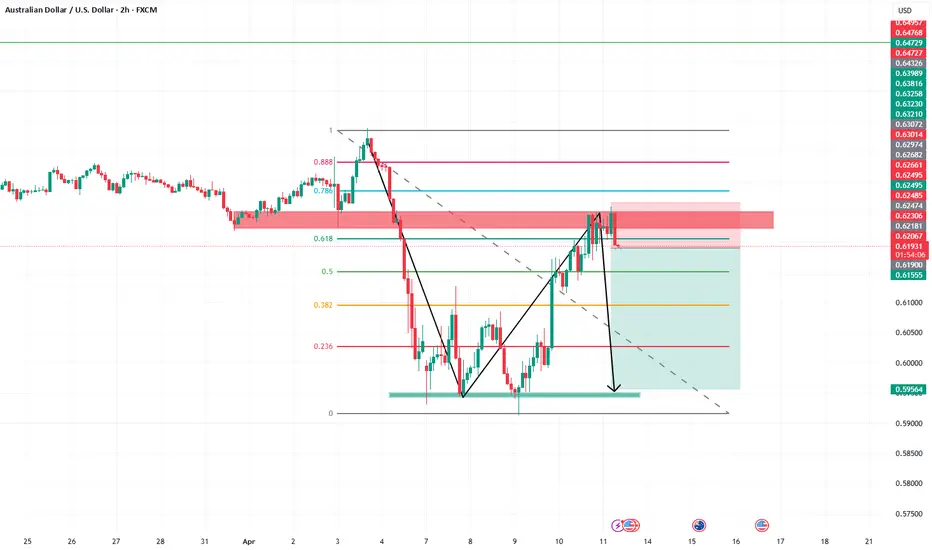
WEEK OF 4/6/25: AUDUSDLast week was clearly bearish leading to all time frames being bearish.
Starting the week with a high probability POI to look for entry models from to take shorts to the next daily demand level.
Impactful news: Inflation 4/10
Thanks for stopping by and goodluck traders!

AUDUSD Discretional Analysis: It's Going Down, BroI don't know man, I have a feeling it's gonna go down. If I'm right I'll make some money and if I'm wrong I'll lose some money.
Just my opinion, not financial advice.

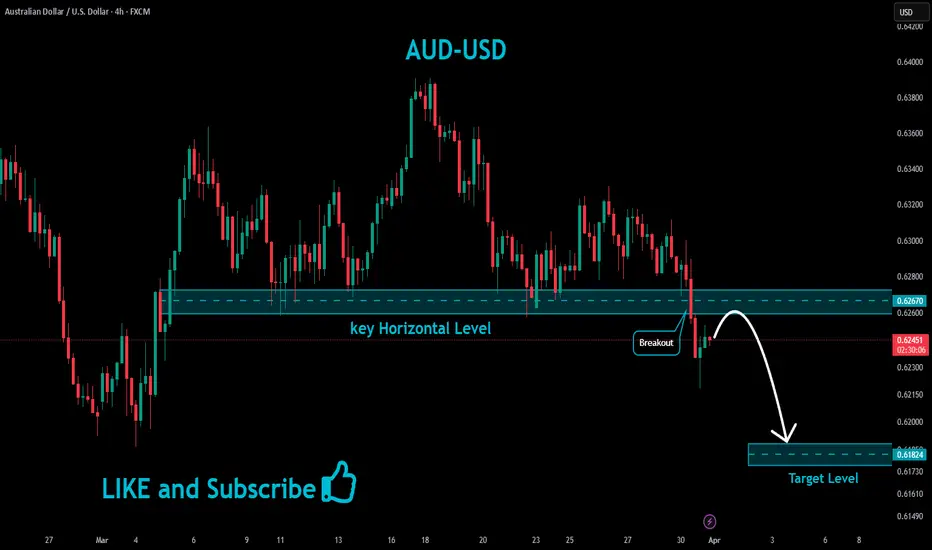
AUDUSD Bearish Breakout!
HI,Traders !
AUD-USD made a bearish
Breakout of key horizontal
Level of 0.62670 so we are
Bearish biased and after
A potential pullback we will
Be expecting a further
Bearish move down !
Comment and subscribe to help us grow !
That trend line looks juicy!Interesting structure...
Remember that a crowded area is a pending liquidity zone.
Don't forget that patience pays off!
Apply your own strategy to find the entry, or here's a little setup, that's what I'm waiting for...
Keep it simple!
Don't forget to follow me...
AUDUSD SELL 106 PIPS LIVE EXCAUTION AND EDUCATIONAL BREAKDOWN AUD/USD has ereased earlier gains to edge lower below 0.6300 in the Asian session on Monday. Trump's tariff concerns outweigh mixed Chinese NBS March PMI data, Australia's hot private inflation data and broad US Dollar weakness, exerting downward pressure on the pair as risk-aversion intensifies.

Continue to be bullish.Economic Fundamentals
Australia: Its economic growth, inflation and export prices affect the Aussie. Growth aids appreciation; inflation undermines it. Higher resource prices boost the currency.
US: Strong US data strengthens the dollar, weakening AUD/USD; weak data has the opposite effect.
Market & Geopolitical Factors
High risk appetite benefits the Aussie; low appetite favors the dollar. Geopolitical tensions prompt a flight to the dollar, hurting the Aussie.
💎💎💎 AUDUSD 💎💎💎
🎁 Buy@0.62500 - 0.62800
🎁 TP 0.63500 - 0.64000
The market has been extremely volatile lately. If you can't figure out the market's direction, you'll only be a cash dispenser for others. If you also want to succeed,Follow the link below to get my daily strategy updates

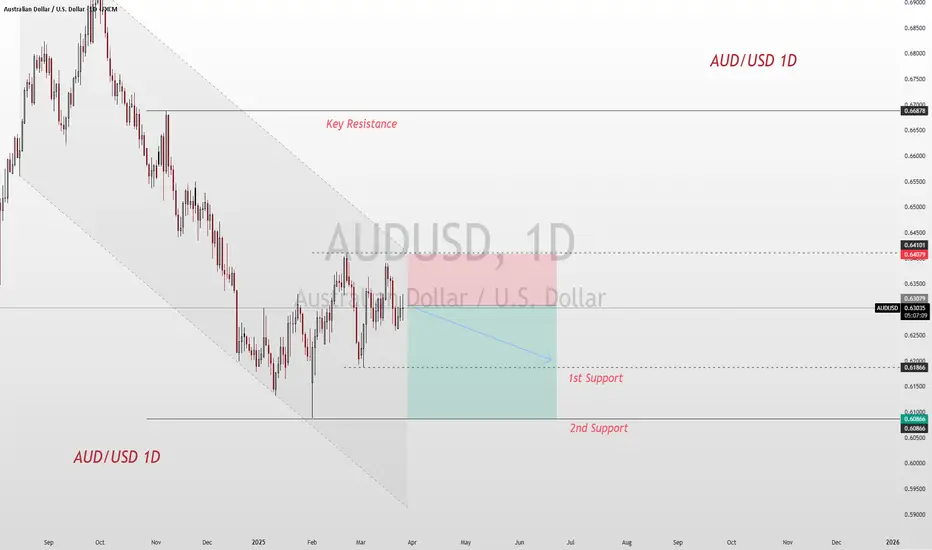
AUD/USD at a Crossroads: The Battle of Breakouts and SupportsTrade frictions remain a headwind in the market. US trade measures have triggered concerns, and the Australian economy, which is dependent on exports to China, may be impacted. Meanwhile, inflation triggered by tariffs conflicts with concerns about a slowdown in the US economy. The Federal Reserve has maintained the interest rate unchanged and adjusted its economic forecasts.
The Reserve Bank of Australia (RBA) cut interest rates in February, and future actions will depend on inflation data. Employment positions decreased in February while the unemployment rate remained stable. The upcoming release of the monthly CPI indicator for February is of great concern. The net short - positions of the Australian dollar have increased, and market sentiment is bearish.
Technically, if the AUD/USD breaks through key levels, there is upward potential. If the bears dominate, there are multiple support levels. Momentum indicators show mixed performance.
AUDUSD
sell@0.63500-0.63000
tp:0.62500-0.62000
I will share trading signals every day. All the signals have been accurate for a whole month in a row. If you also need them, please click on the link below the article to obtain them.
AUDUSD Short based on interest rates decision Australianas inflation slowing down,before next interest rates decision .Possible rates cuts
USA: Inflation up, FED no changes in interest rates,possible rate hikes
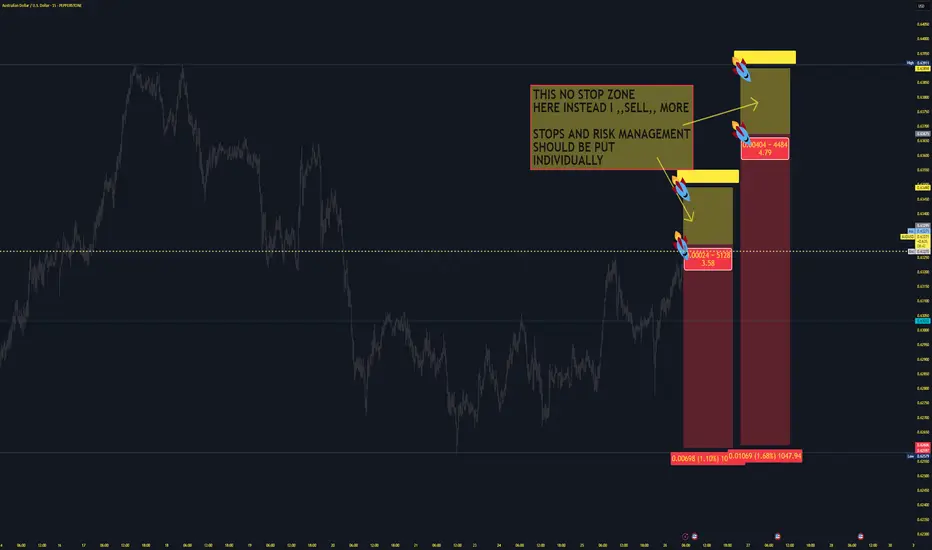
2 APPORACHES FOR TODAY;OR IF YOU WANNA WAIT ENTRY with more cautiios(Conservative entry)
Yellow zones are areas where we can cover more shorts
Short Idea - AUDUSDTrade entered. Entry rules met.
Confluences:
✅ Bearish overall bias
✅ Bearish demand zone
✅ Bearish ABCD extension pattern
✅ Bearish divergence
✅ Bearish break of structure
✅ Entering London close zone
✅ Price is in entry zone
✅ Required risk:reward met
⭐ I shared this watch zone in my weekly forex outlook this week, you can subscribe by clicking the link in my bio.
Mon 24th Mar 2025 AUD/USD Daily Forex Chart Sell SetupGood morning fellow traders. On my Daily Forex charts using the High Probability & Divergence trading methods from my books, I have identified a new trade setup this morning. As usual, you can read my notes on the chart for my thoughts on this setup. The trade being a AUD/USD Sell. Enjoy the day all. Cheers. Jim

Week of 3/23/25: AUDUSD AnalysisAnalysis of my main pair AUDUSD, last week resulted in the bears taking over and my analysis explains why my bias is bearish going into the new week.
Not much volatile news except for Unemployment Claims on Thursday.
Let me know what you guys think, your analysis, and if you want to see anything else!
Goodluck this week traders, let's kill it.

AUD/USD– Bearish Momentum Unleashed!AUD/USD 🐨💵 – Bearish Momentum Unleashed! 🚨📉
Price rejected from Daily & H4 FVG zones 🔥
Pullback expected… then a potential drop toward 0.61872 💔
Weekly Bias = Bearish ✅
Eyes on liquidity grab below recent lows 👀💣
Are you ready for the move? 💼💸 #ForexTrading #AUDUSD #SmartMoneyConcepts #FVG #PriceAction #LiquidityHunt
