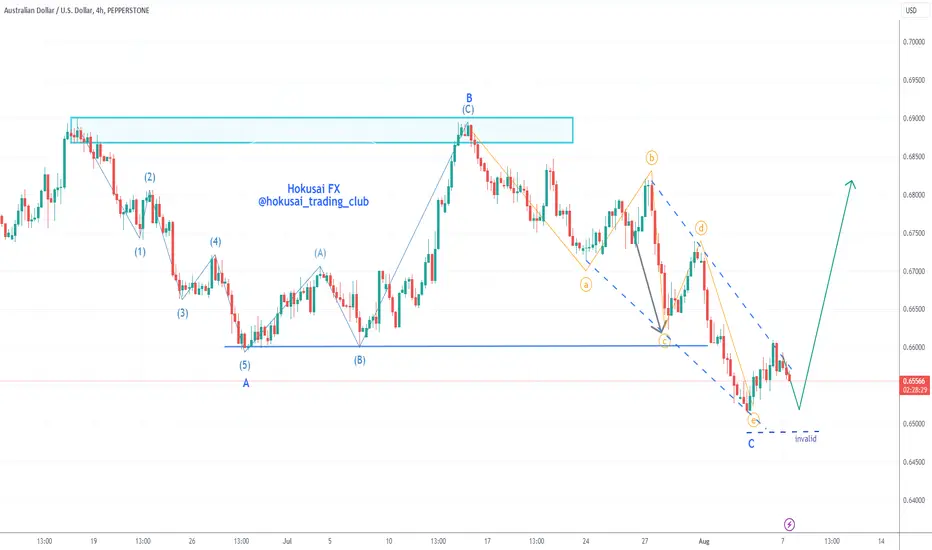
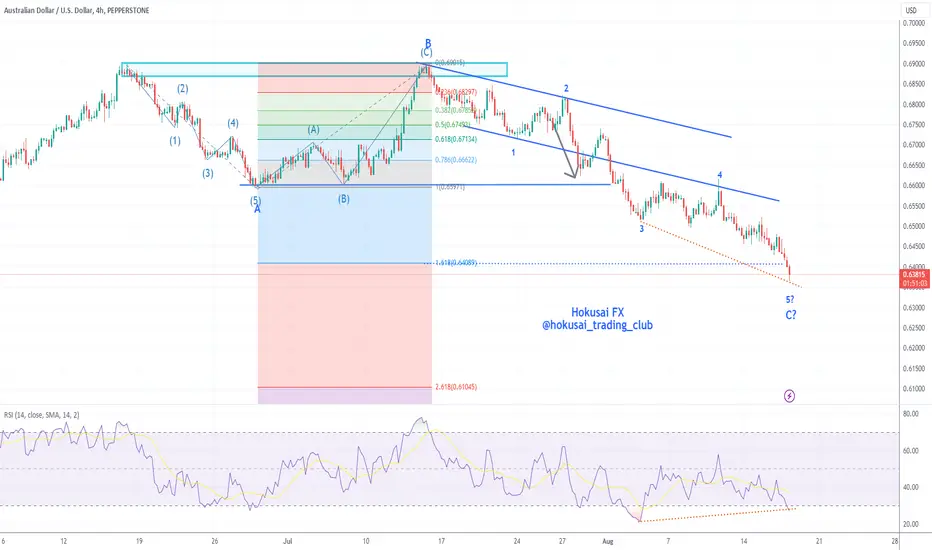
AUDUSD I Downside bias and short-term potential longWelcome back! Let me know your thoughts in the comments!
** AUDUSD Analysis - Listen to video!
We recommend that you keep this pair on your watchlist and enter when the entry criteria of your strategy is met.
Please support this idea with a LIKE and COMMENT if you find it useful and Click "Follow" on our profile if you'd like these trade ideas delivered straight to your email in the future.
Thanks for your continued support!
Audusdsignal

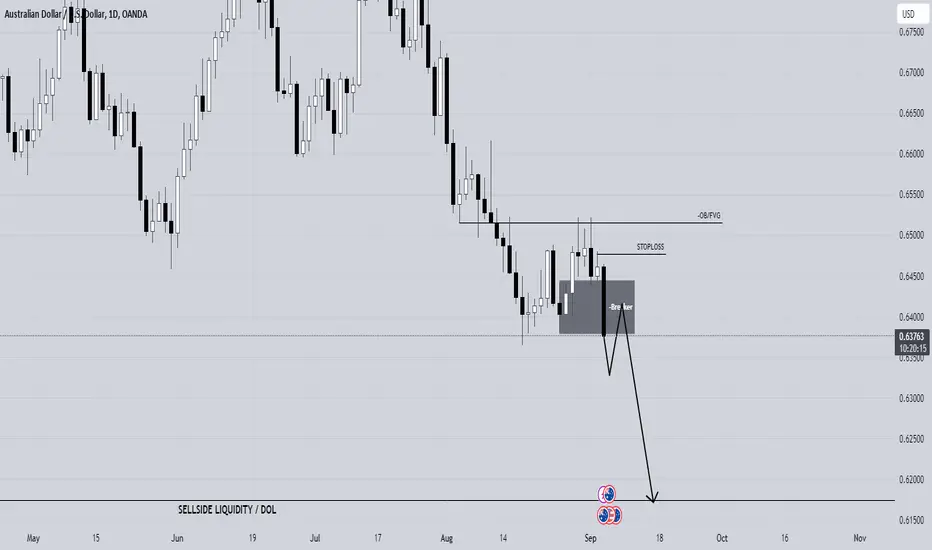
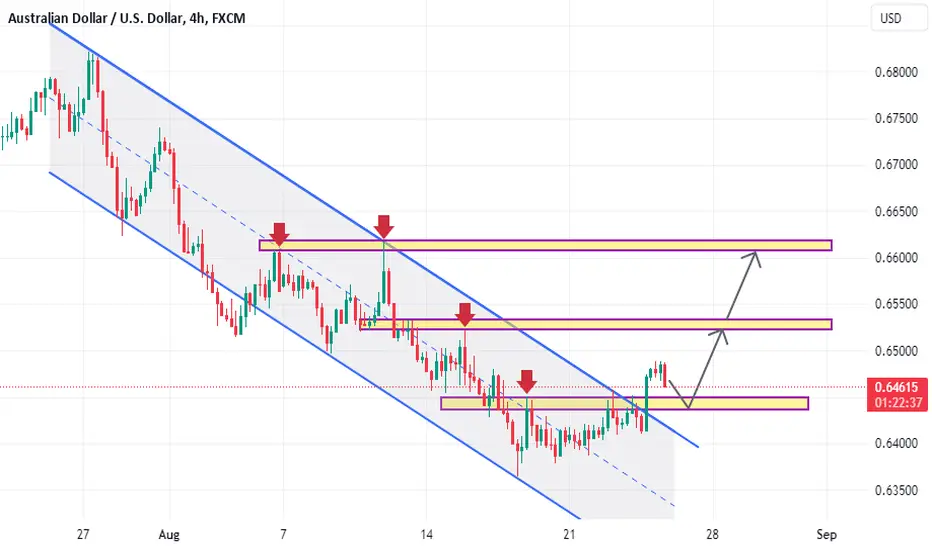
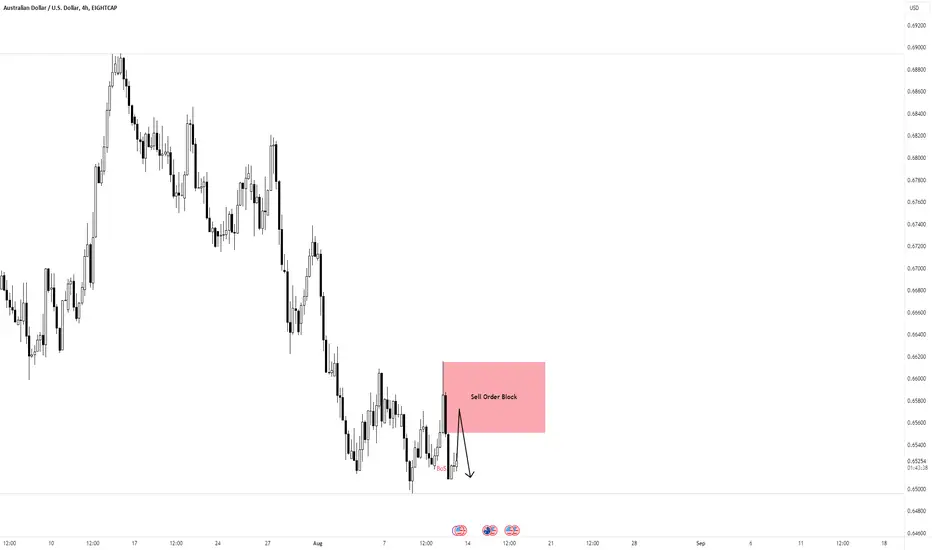
AUDUSD SHORT DO YOU AGREE?Has we can see all bearish PD Array are being respected and on Daily timeframe, we can see a bearish --breaker forming, Now moving to the 4H timeframe we can see an Orderblock that is yet to be mitigated which will be a potential area for a market structure shift which is my point of interest for a short entry.
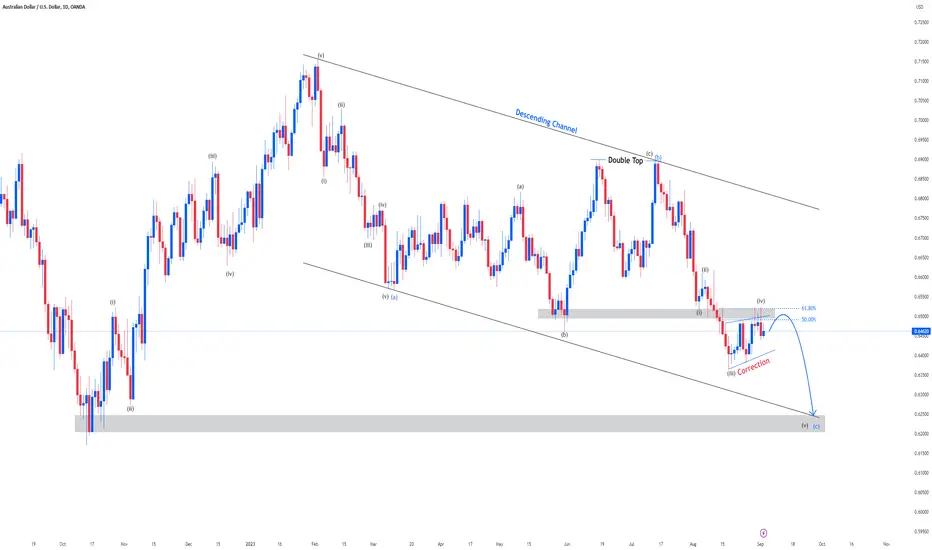
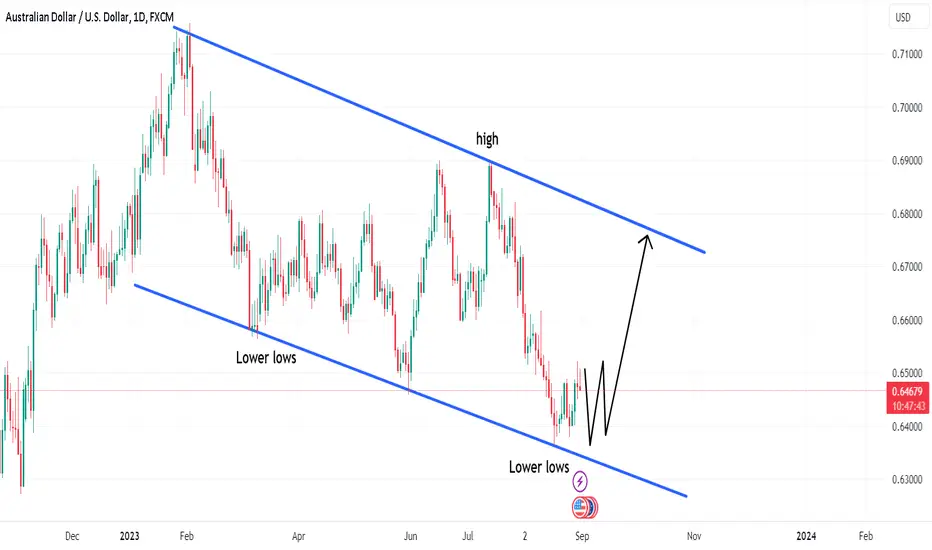
AUDUSD Analysis 1Sep2023Seeing the movement in the last few days, Audusd is likely to be correction with a bullish target in the SND area above. The price has not changed to the bullish trend as long as it hasn't risen more than the SND area. Although at this time the price has break Trendline bearish and forms 2x new high, but has not met the requirements indicating a positive price reversal
AUDUSD Long Term BUYING Trading IdeaHello Traders
In This Chart AUDUSD HOURLY Forex Forecast By FOREX PLANET
today AUDUSD analysis 👆
🟢This Chart includes_ (AUDUSD market update)
🟢What is The Next Opportunity on AUDUSD Market
🟢how to Enter to the Valid Entry With Assurance Profit
This CHART is For Trader's that Want to Improve Their Technical Analysis Skills and Their Trading By Understanding How To Analyze The Market Using Multiple Timeframes and Understanding The Bigger Picture on the Charts
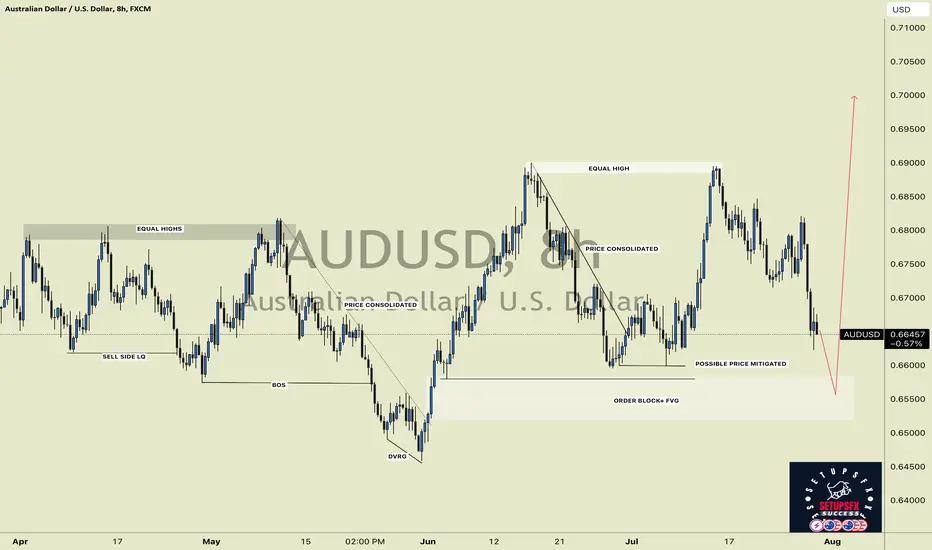
EURUSD and AUDUSD Top-down analysis Hello traders, this is a complete multiple timeframe analysis of this pair. We see could find significant trading opportunities as per analysis upon price action confirmation we may take this trade. Smash the like button if you find value in this analysis and drop a comment if you have any questions or let me know which pair to cover in my next analysis.

AUDUSD Sells in playAUDUSD Analysis :
1. Potential Bearish Trend.
2. USD is strong meanwhile AUD is still weak.
3. Short term buyers pressure.
We are looking to go Short on this pair, As the price is heading towards the resistance zone. We will look for confirmations on the lower time frames.
AUDUSD Top-down analysis Hello traders, this is a complete multiple timeframe analysis of this pair. We see could find significant trading opportunities as per analysis upon price action confirmation we may take this trade. Smash the like button if you find value in this analysis and drop a comment if you have any questions or let me know which pair to cover in my next analysis.

AUDUSD Top-down analysis Hello traders, this is a complete multiple timeframe analysis of this pair. We see could find significant trading opportunities as per analysis upon price action confirmation we may take this trade. Smash the like button if you find value in this analysis and drop a comment if you have any questions or let me know which pair to cover in my next analysis.

GBPUSD and AUDUSD Top-down analysis Hello traders, this is a complete multiple timeframe analysis of this pair. We see could find significant trading opportunities as per analysis upon price action confirmation we may take this trade. Smash the like button if you find value in this analysis and drop a comment if you have any questions or let me know which pair to cover in my next analysis.

AUDUSD : Long Trade , 4hHello traders, we want to check the AUDUSD chart. The price has broken the descending channel and there is a high probability that an upward trend will start. If the price pulls back to the specified key level, we expect this level to maintain the upward trend of the price and cause further price growth. We expect the price to grow up to around 0.65300 and if it can break this level, the next price target will be 0.66100. Good luck.
AUD/USD Retreats Amid Resilient US Dollar; Eyes on Upcoming PMI The AUD/USD pair faces downward pressure amid a resilient US Dollar, hitting 10-week highs. While US investors anticipate potential tightening of the Federal Reserve's interest rate policy, Australian inflation softening supports an unchanged rate by the RBA. Technical indicators point to mixed sentiment with bearish bias. Market eyes are on the US PMI data for further cues. Both economic and technical analysis remain crucial in shaping trading strategies.
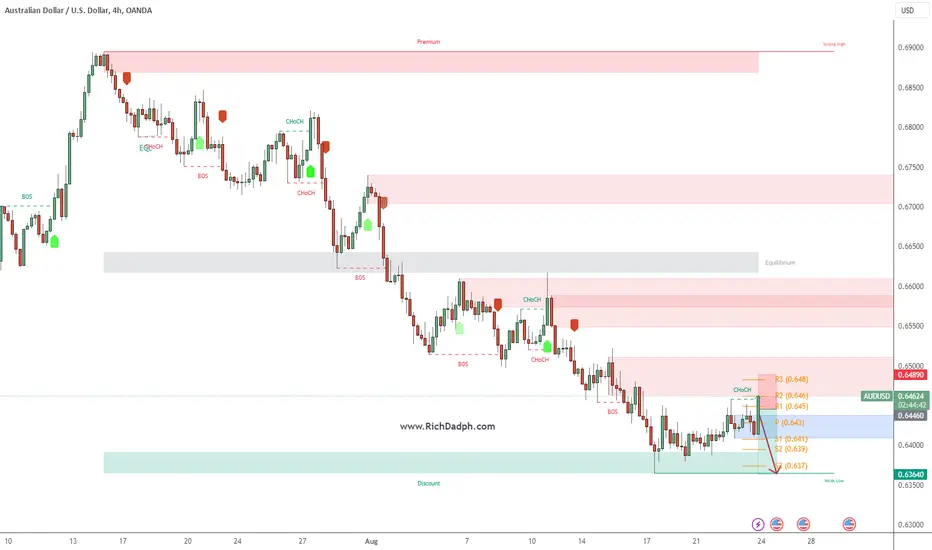
TRADE IDEA DETAILS
CURRENCY PAIR: AUD/USD
CURRENT TREND: Bearish (Short-term)
TRADE SIGNAL: SELL
👉ENTRY PRICE: Approximately 0.6446 (Nine-day EMA acting as immediate resistance)
✅TAKE PROFIT: 0.6364 (Near the monthly low, offering a technical support level)
❌STOP LOSS: 0.6489 (Just above the 23.6% Fibonacci retracement, acting as a key resistance)
ANALYSIS:
The AUD/USD pair has shown signs of bearish momentum in the short term. The technical indicators such as the MACD line and 14-day RSI being below 50 suggest a bearish bias.
From a fundamental perspective, the resilient US Dollar and the Federal Reserve's potential interest rate tightening contribute to a negative outlook on AUD, especially with the softening of inflation in Australia.
FINAL THOUGHTS:
This trade idea is based on both technical analysis and current economic factors influencing the AUD/USD pair. As with all trades, it's vital to remain vigilant and adjust the strategy as necessary, based on real-time data and market conditions. Given the expected US PMI data and the possible tightening of US monetary policy, traders should closely monitor these events, as they could significantly impact the pair's direction.
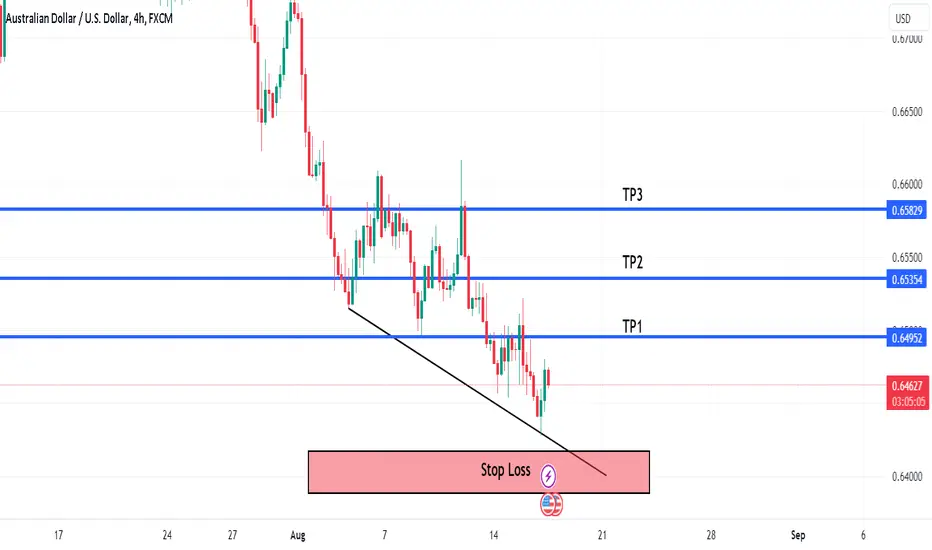
AUDUSD I Correction and continuation I SHORTWelcome back! Let me know your thoughts in the comments!
** AUDUSD Analysis - Listen to video!
We recommend that you keep this pair on your watchlist and enter when the entry criteria of your strategy is met.
Please support this idea with a LIKE and COMMENT if you find it useful and Click "Follow" on our profile if you'd like these trade ideas delivered straight to your email in the future.
Thanks for your continued support!

AUDUSD Analysis 17Aug2023If you look at the current audusd analysis, the price may be at the saturation point of sale. The RSI looks divergent. If we draw Fibo, the price extension is in the Fibo area of 1,618. Indeed, there is a possibility that the price will continue to go down and remain bearish. If you want to do a long-term trade, you would be better off waiting for a reversal when there is a bullish candle engulfing.
AUDUSD Long Term Trading IdeaHello Traders
In This Chart AUDUSD HOURLY Forex Forecast By FOREX PLANET
today AUDUSD analysis 👆
🟢This Chart includes_ (AUDUSD market update)
🟢What is The Next Opportunity on AUDUSD Market
🟢how to Enter to the Valid Entry With Assurance Profit
This CHART is For Trader's that Want to Improve Their Technical Analysis Skills and Their Trading By Understanding How To Analyze The Market Using Multiple Timeframes and Understanding The Bigger Picture on the Charts
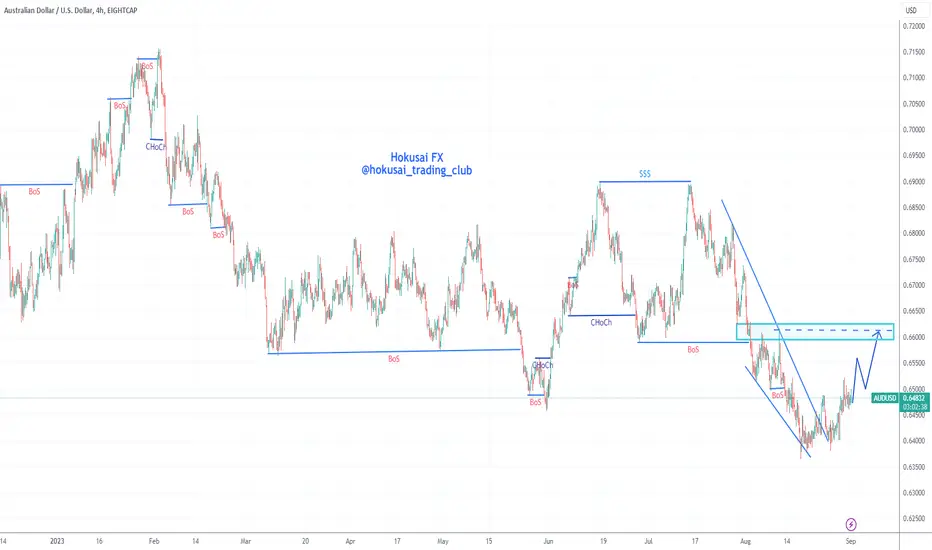
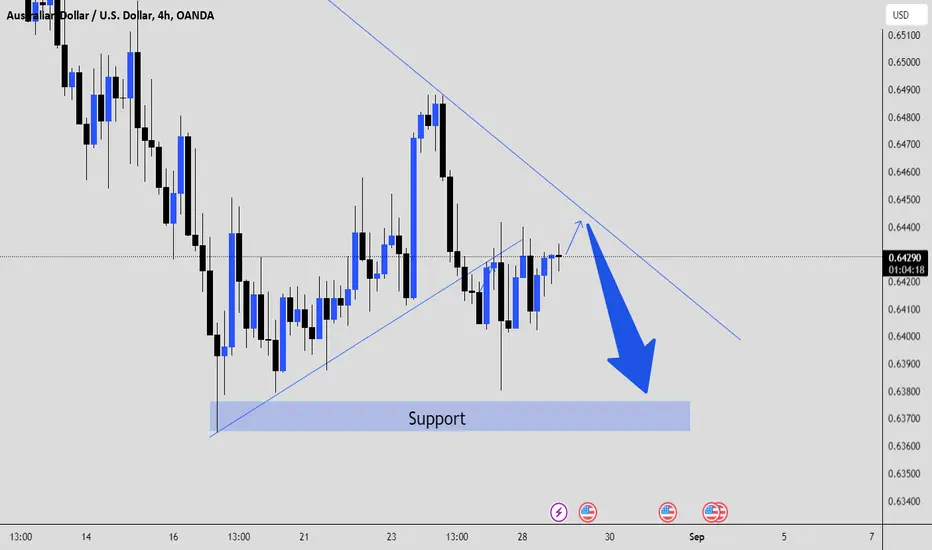
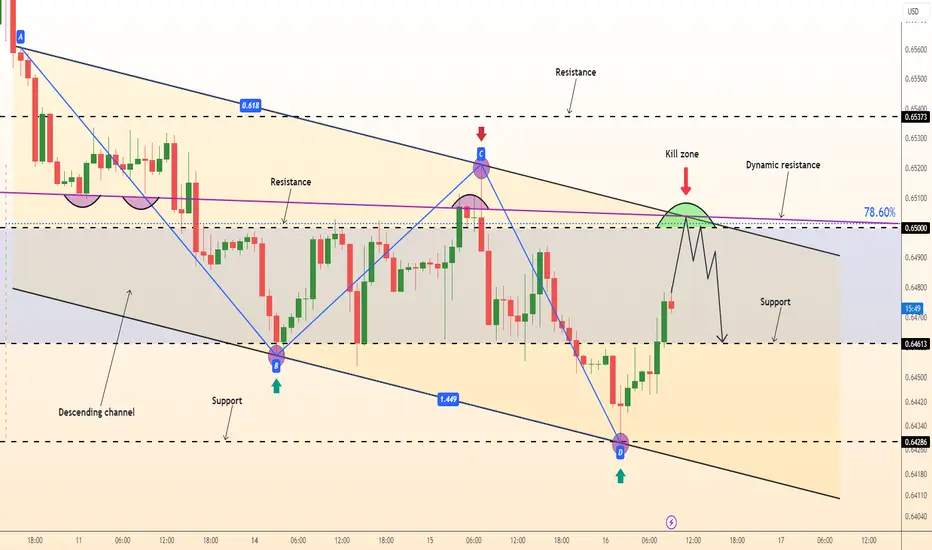
DeGRAM | AUDUSD kill zone for short opportunityAUDUSD is moving in the descending channel and has made lower lows.
The price is pulling back to the resistance level at 0.65000, which is the psychological level.
Price action formed a kill zone for the short opportunity: fibo level 78.60% and dynamic resistance.
We expect a bearish move from the kill zone.
-------------------
Share your opinion in the comments and support the idea with a like. Thanks for your support!
AUDUSD Top-down analysis Hello traders, this is a complete multiple timeframe analysis of this pair. We see could find significant trading opportunities as per analysis upon price action confirmation we may take this trade. Smash the like button if you find value in this analysis and drop a comment if you have any questions or let me know which pair to cover in my next analysis.

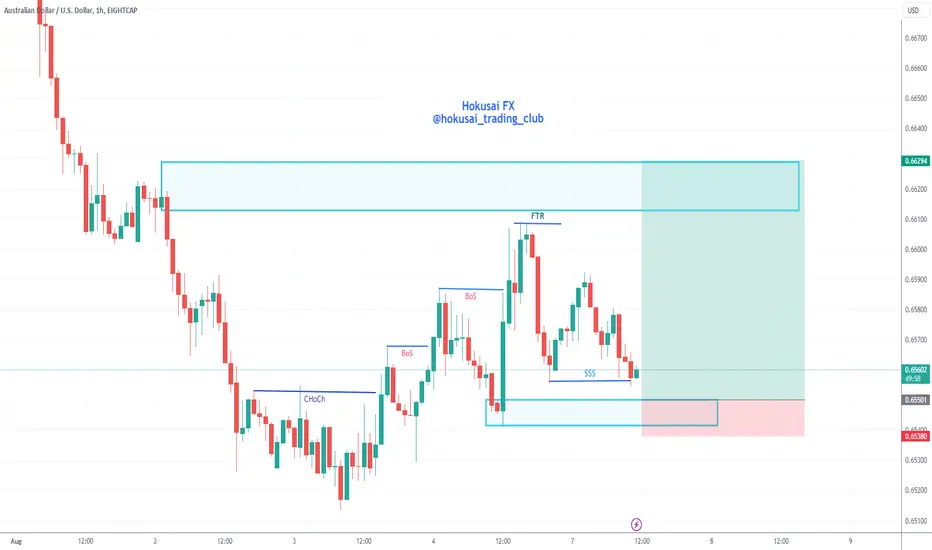
AUDUSD Analysis H4Here is my analysis for AUDUSD on H4 using Order Block. The price could go bearish, you can put a pending order on the Order block or find an entry on LTF within OB Zone. Trade Safe!
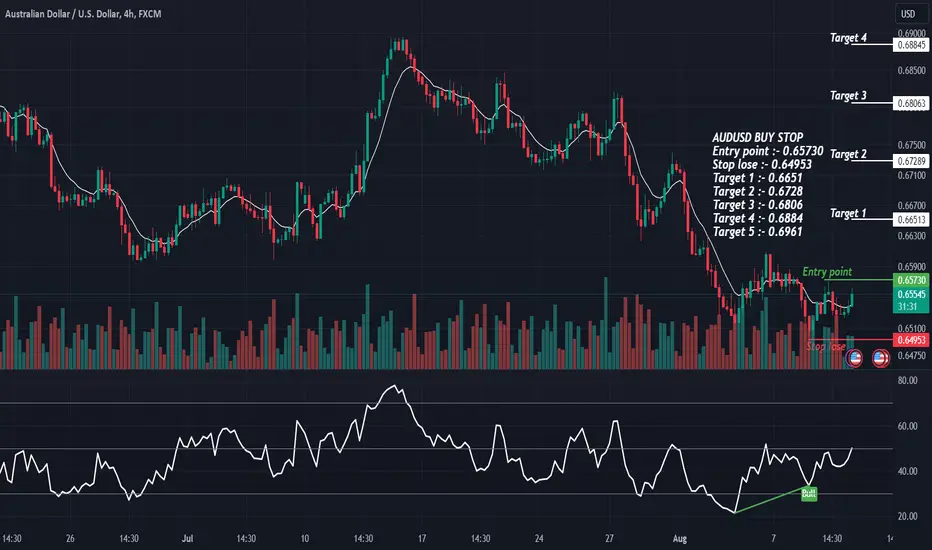
AUDUSD: Great area to BUY BIG :)Dear Traders, hope you are doing great, we have an excellent opportunity to buy AUDUSD, like other USD PAIRS we still believe prices to be bullish.
AUDUSD BUY STOP AUDUSD BUY STOP
Entry point :- 0.65730
Stop lose :- 0.64953
Target 1 :- 0.6651
Target 2 :- 0.6728
Target 3 :- 0.6806
Target 4 :- 0.6884
Target 5 :- 0.6961
AUDUSD Signal 7Aug2023I have noticed a correction in the H1 timeframe. The most recent HH was unable to reach the SND area, resulting in a FTR (Failed to Return) and a subsequent drop in corrected prices. For this AUDUSD analysis, we can set up a buy limit in the SND area with a ratio of RR reaching 1:6. It is important to use a good MM.
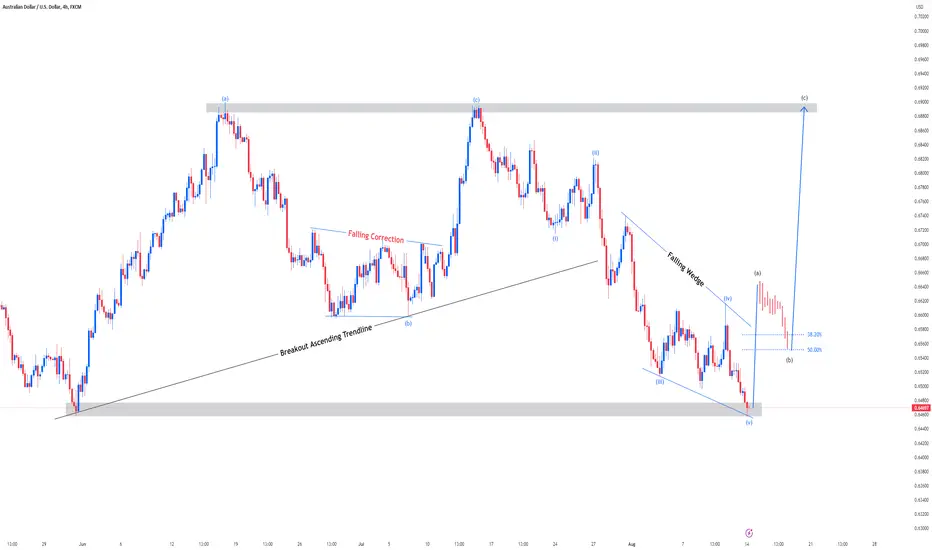
AUDUSD Analysis 7Aug2023There was a slight change in the position of Elliot's notation compared to last week's analysis. If you see a pattern that resembles a bullish falling wedge, then the possibility of the current Wave correction is at the end of the period and will enter the beginning of the bullish again. This analysis of crows when the price drops more than the invalid area