Market Analysis: AUD/USD Much Higher—Uptrend Shows StrengthMarket Analysis: AUD/USD Much Higher—Uptrend Shows Strength
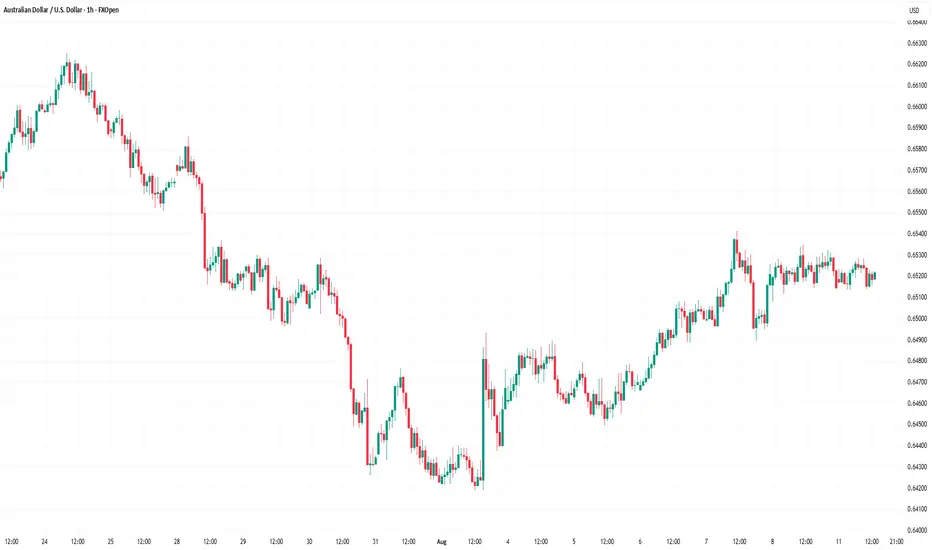
AUD/USD started a decent increase above the 0.6480 and 0.6500 levels.
Important Takeaways for AUD/USD Analysis Today
- The Aussie Dollar started a decent increase above the 0.6450 level against the US Dollar.
- There is a connecting bearish trend line forming with resistance at 0.6530 on the hourly chart of AUD/USD.
AUD/USD Technical Analysis
On the hourly chart of AUD/USD, the pair started a fresh increase from the 0.6450 support. The Aussie Dollar was able to clear the 0.6470 resistance to move into a positive zone against the US Dollar.
There was a close above the 0.6500 resistance and the 50-hour simple moving average. Finally, the pair tested the 0.6540 zone. A high was formed near 0.6541 and the pair recently started a consolidation phase.
There was a move below the 23.6% Fib retracement level of the upward move from the 0.6449 swing low to the 0.6541 high. On the downside, initial support is near the 0.6510 level.
The next major support is near the 0.6495 zone or the 50% Fib retracement level. If there is a downside break below 0.6495, the pair could extend its decline toward the 0.6470 level. Any more losses might signal a move toward 0.6450.
On the upside, the AUD/USD chart indicates that the pair is now facing resistance near 0.6530. There is also a connecting bearish trend line forming with resistance at 0.6530.
The first major resistance might be 0.6540. An upside break above it might send the pair further higher. The next major resistance is near the 0.6580 level. Any more gains could clear the path for a move toward the 0.6600 resistance zone.
This article represents the opinion of the Companies operating under the FXOpen brand only. It is not to be construed as an offer, solicitation, or recommendation with respect to products and services provided by the Companies operating under the FXOpen brand, nor is it to be considered financial advice.
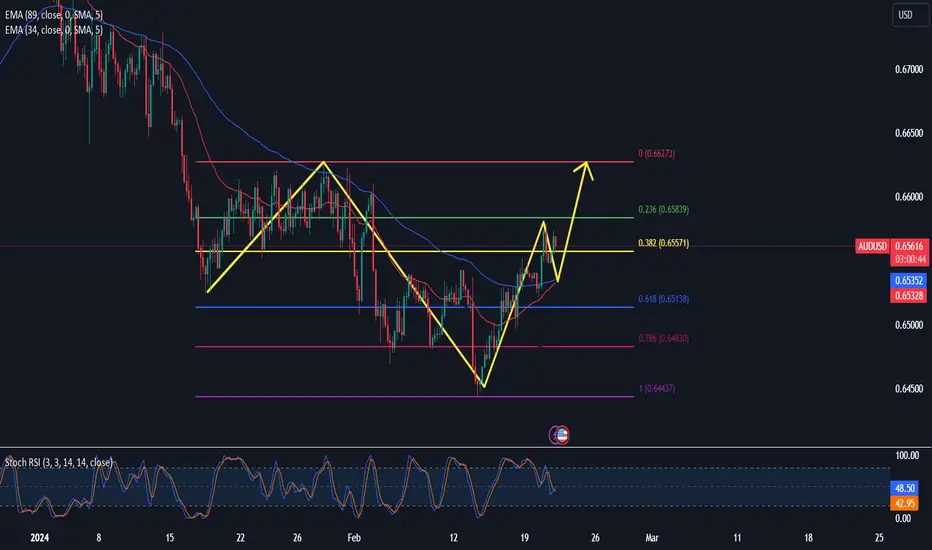
Audusdtrend
AUDUSD: Asian foreign exchange market increased slightly as the Most Asian currencies rose on Wednesday, seeing relief as the dollar eased in anticipation of more signals from the Federal Reserve on its path to adjusting interest rates.
Regional units are still suffering heavy losses in recent sessions as fading expectations of an early Fed rate cut sent the dollar rallying to a three-month high.
However, the greenback has fallen significantly from recent highs this week, bringing relief to Asian markets.
USD falls after Fed minutes, speakers in sight
The dollar index and dollar index futures both fell about 0.1% each during the Asian session, as investors took some profits in the greenback ahead of a series of signals Fed this week.
Minutes from the Fed's late January meeting are due later on Wednesday, after the bank kept interest rates steady and largely downgraded expectations for an early rate cut.
In addition to the minutes, a host of Fed officials will also speak this week, including Raphael Bostic and Michelle Bowman later on Wednesday.
AUDUSD | Technical Analysis| Good Long Opportunity If you find this technical analysis useful, please like & share our ideas with the community. Coming to the technical analysis of AUDUSD , I think we are going to see an upward movement. If you are going to go long now, make sure to place the stop below the previous support area .
What do you think is more likely to happen? Please share your thoughts in comment section. And also give a thumbs up if you find this idea helpful. Any feedback & suggestions would help in further improving the analysis.
Good Luck!
Disclaimer!
This post does not provide financial advice. It is for educational purposes only! You can use the information from the post to make your own trading plan for the market. But you must do your own research and use it as the priority. Trading is risky, and it is not suitable for everyone. Only you can be responsible for your trading.
What I'd love to see on AUDUSD!In sharp contrast to my recent idea on EURAUD, because of its negative correlation to AUDUSD, if price gets to my resistance trendline and holds, i look forward to see a price decline. Probabilities. Lets see
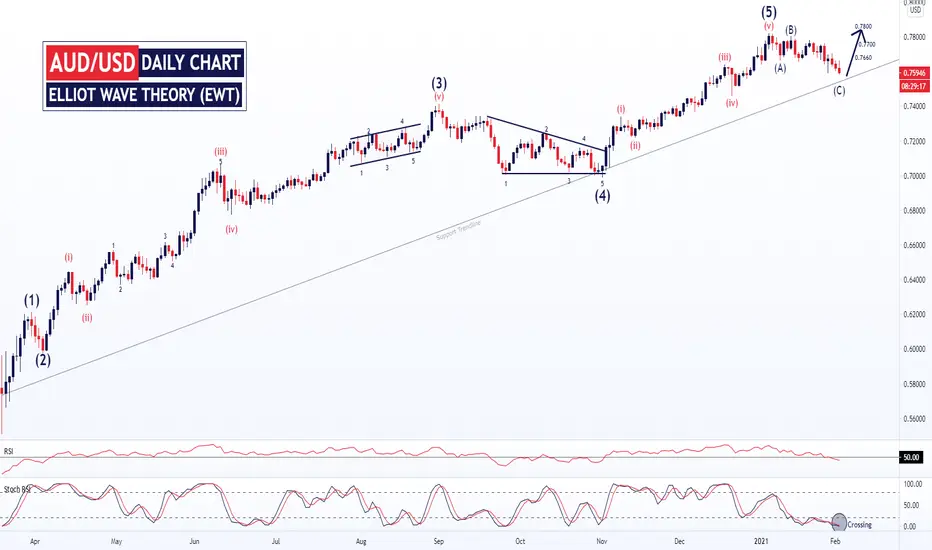
AUD/USD: ELLIOT WAVE THEORY (EWT)AUD/USD started to rise from the support trendline. And it's made the Elliott wave pattern on the daily time frame. After the ABC correction, now it's trying to hit 0.7660 - 0.7700 - 0.7800 .
But what if it breaks the support trendline?
If it starts to fall, the targets will be 0.7400 - 0.7360 .
AUDUSD - FULL ANALYSIS BREAKDOWN & UPDATE !!Welcome traders to a free analysis breakdown.
Today I am highlighting possible trade ares on AUDUSD, if you any questions on the pair let me know in the comment section below.
Once the pair gives us a valid trade entry I will be sharing the trade with the Alpha community, I hope you all found this breakdown helpful .
If you liked this free educational please like and follow the channel, there is lots more valuable content right around the corner.
Feel free to comment a pair or subject you would like me to cover next.
Trade Safe
Alpha Trading Group.

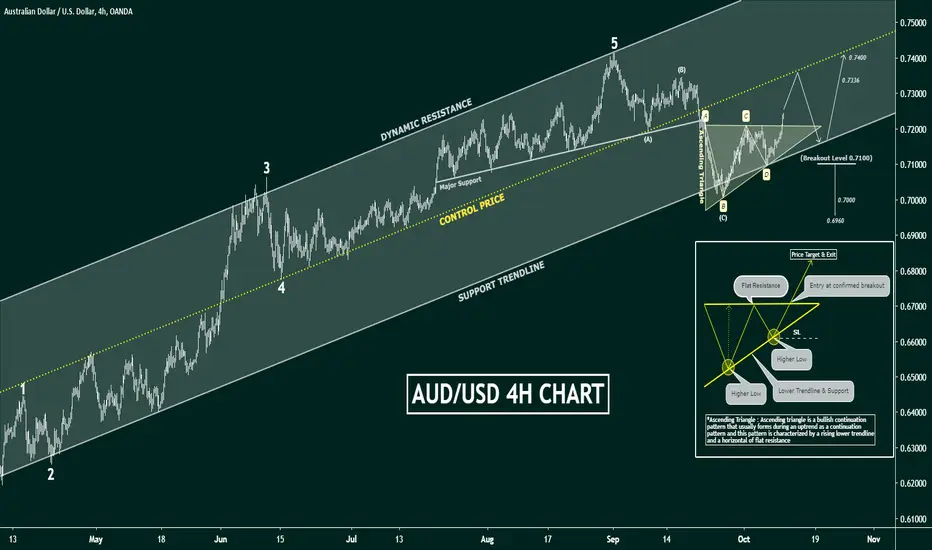
AUD/USD Analysis With An Elliott Wave And Triangle PatternThe above chart is an incremental trend, in which I have applied the Elliott wave pattern to get the levels. At the end of the major support, it's making an ascending triangle . That, I have described in detail in the above chart.
The trend is crossing the upper trendline of the triangle. It will fall from around 0.7300 . If there will be a situation of continuous fall, and it falls up to 0.7100 , then the targets will be ( 0.7000-0.6960 ).
But if there a reversal and with the help of support trendline trend rises, then it will knock the targets ( 0.7336 - 0.7400 ).
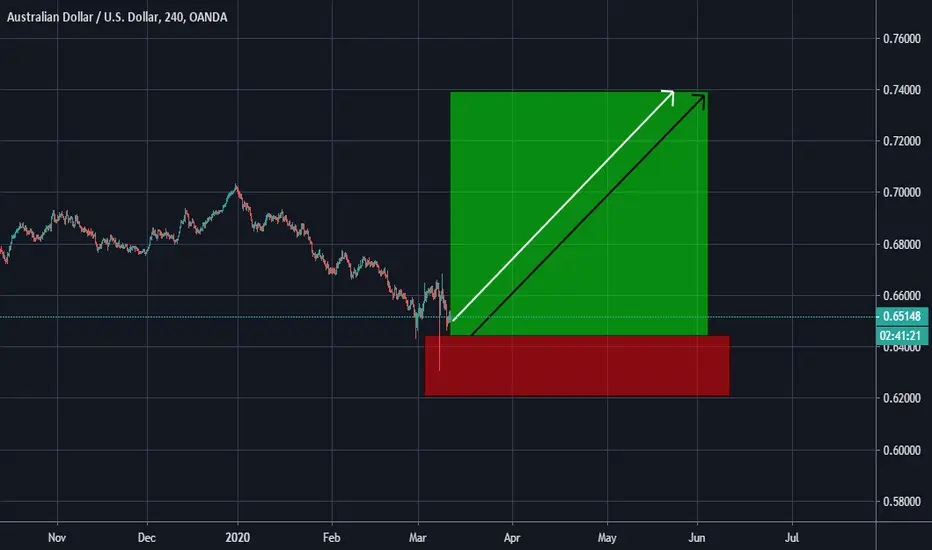
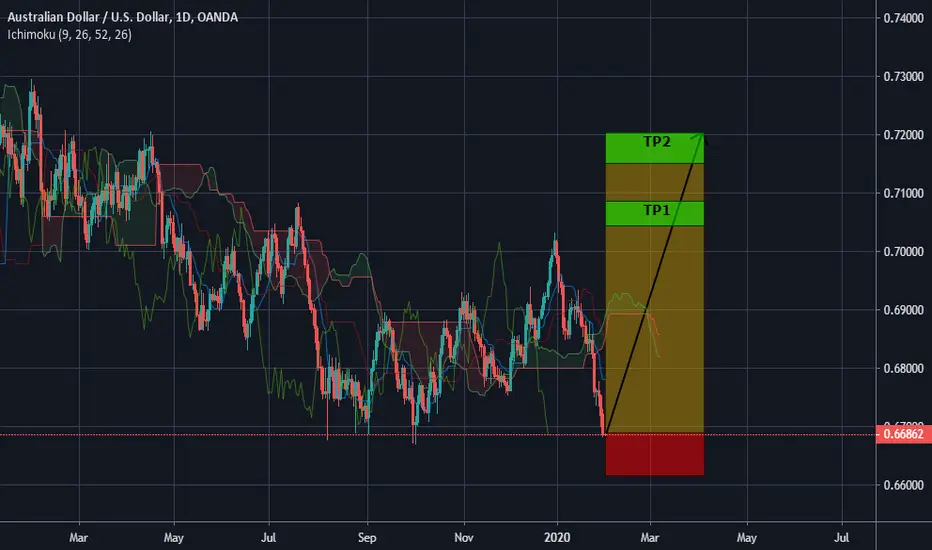
AUDUSD Aussie remain king for buyer !!!! and huge gain
we have booked.
China economy 80% back
to recovery and Aussie export largely depends on Chinese sector.
WE HAD REACHED OUR TP-1 & TP-2
Next week can cross 0.65 to 0.67
WE APPRECIATE UR LIKE AND COMMENTS

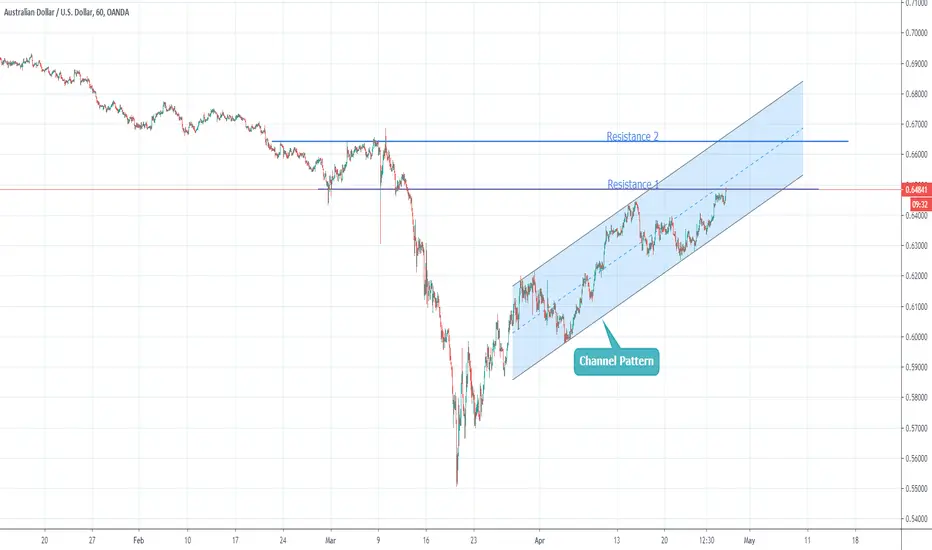
AUDUSD At Breakout Of Resistance Level.AUDUSD is trading consistently on an uptrend and in channel pattern, as you can see in the chart. At the current level, it will face resistance which is minor resistance 1. We might see a minor pullback from the current level and then further upside in AUDUSD.
If You Like Idea Do Follow/Comment/Like For More Quick Update as Time Is Money.
Note - Trade With Proper Risk Management System.
Thanks
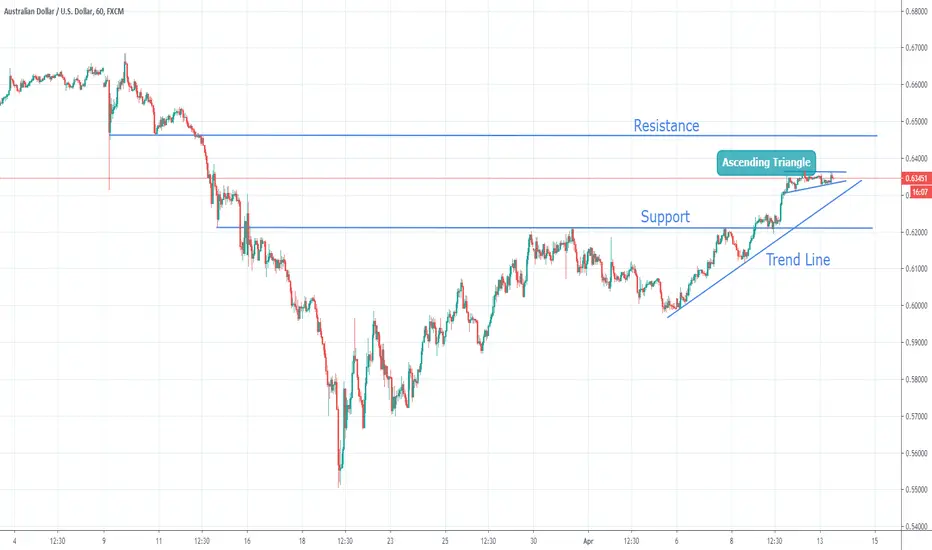
AUDUSD Ascending Triangle At TopAUDUSD is forming an ascending triangle in upward trend. It will be an interesting price action in AUDUSD pair. If AUDUSD breaks the ascending triangle on upside, we might see further trend continuation till resistance level (as mentioned in chart). If it breaks on downside we might see small pull towards trendline support as first small target. If it breaks trendline, the support line will be second target for AUDUSD.
Like/Comment/Follow For More Idea.
Note - Trade With Proper Risk Management System Only
Thanks
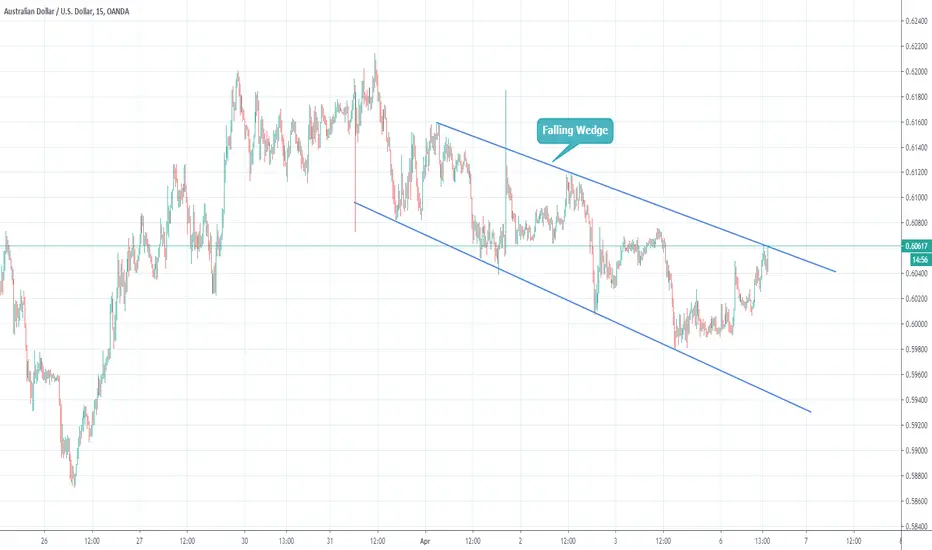
AUDUSD Trading At Resistance Of Falling WedgeAUDUSD is trading in falling wedge resistance line for shorter term trade. One can trade on short side with falling wedge as stoploss and target will be the support line of the falling wedge. The long term trend in AUDUSD is on downside.
Like/Comment/Follow Us For More Idea
Note - Trade With Proper Risk Management System Only
Thanks
AUDUSD TRADE IDEA FOR SHORT TERMAUDUSD TRADE LEVELS FOR SHORT TERM JUST TRADE WITH PROPER MONEY MANAGEMENT THANKS

My view still bullish in Audusd look for long audusdMy view still bullish in Audusd look for long audusd Just Trade with proper money mangement Thanks