Check if it can rise to around 0.5452
Hello, traders. Nice to meet you.
If you "Follow" us, you'll always get the latest information quickly.
Have a great day.
-------------------------------------
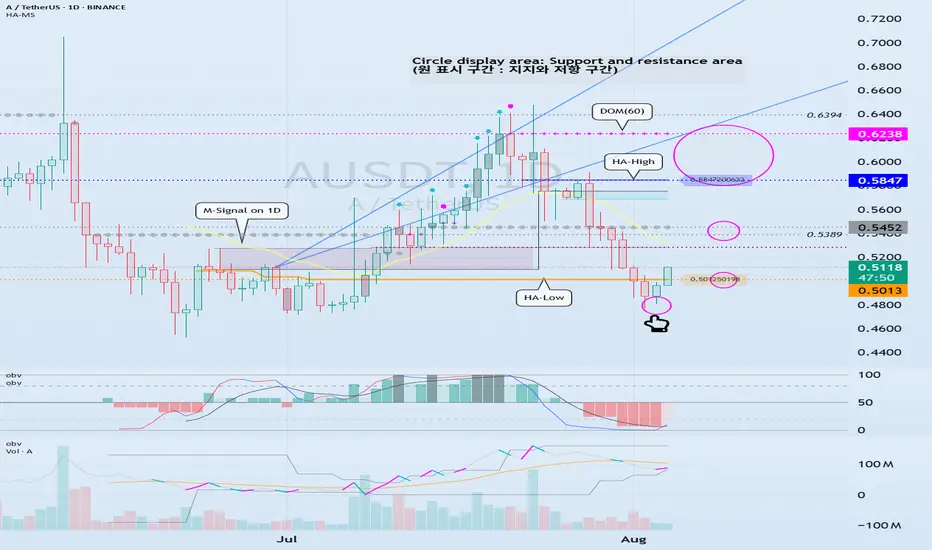
(AUSDT 1D chart)
It hasn't been long since EOS changed to A.
Nevertheless, the formation of the HA-Low and HA-High indicators suggests that a wave has begun to form.
However, since the DOM (-60) indicator hasn't yet formed, if it fails to find support from the HA-Low indicator, further declines could occur, so we need to consider countermeasures.
With the HA-Low and HA-High indicators in place, we can now trade in line with our basic trading strategy.
In other words, this refers to a trade where you buy in the DOM(-60) ~ HA-Low range and sell in the HA-High ~ DOM(60) range.
This ultimately refers to a trading strategy within a box range.
Trend trading strategies proceed by either rising in the HA-High ~ DOM(60) range or falling in the DOM(-60) ~ HA-Low range.
In other words, a rise in the HA-High ~ DOM(60) range is likely to lead to a stepwise uptrend, while a decline in the DOM(-60) ~ HA-Low range is likely to lead to a stepwise downtrend.
In this sense, key support and resistance levels are the 0.5013 point and the 0.5847-0.6238 range.
Currently, the price is rising above 0.5013, so if support is found around 0.5013, it would be a good time to buy.
The first sell zone is around 0.5452, where a volume profile zone has formed.
If the price rises above this level and maintains, it is expected to continue upward, likely reaching the 0.5847-0.6238 range.
-
The low trendline has not yet been formed.
The low of the candlestick indicated by the finger is the first selection point for drawing the low trendline.
Since a high trendline has been formed, we should also examine whether the price can rise along the high trendline.
-
Thank you for reading to the end.
I wish you successful trading.
--------------------------------------------------
- This is an explanation of the big picture.
(3-year bull market, 1-year bear market pattern)
I will explain in more detail when the bear market begins.
------------------------------------------------------
AUSD
EOS -> Vaulta : (0.5013 support is the key)
Hello, traders.
If you "Follow", you can always get new information quickly.
Have a nice day today.
-------------------------------------
EOS switched from banking to blockchain during the network reorganization.
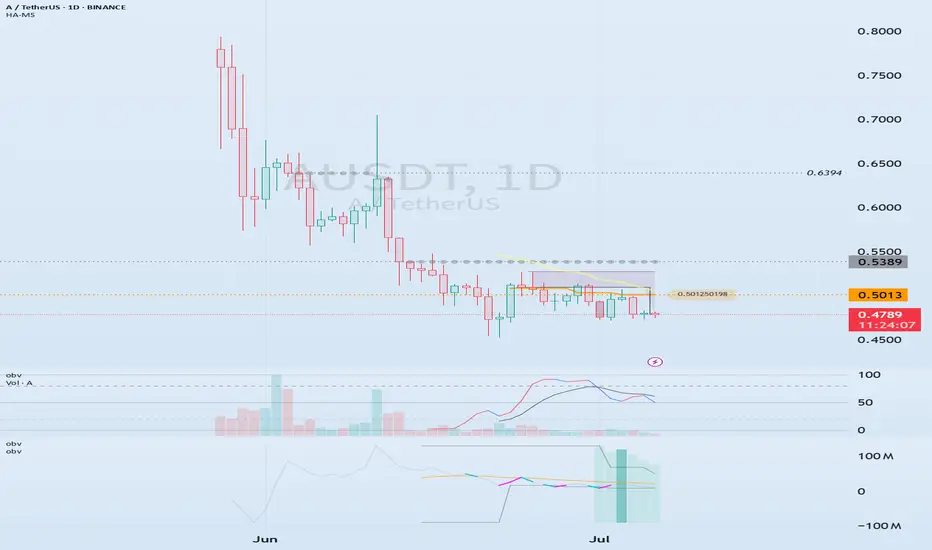
(AUSDT 1D chart)
The key is whether it can rise to around 0.5013 and receive support.
If not, it is likely to show a step-down trend.
-
(4h chart)
In terms of day trading,
Support range: 0.4942-0.4822
Resistance range: 0.5959-0.6394
We need to see whether it can receive support and rise in the above range.
However, since the M-Signal indicator of the 1D chart is passing around 0.5013, it is important to see how the volume profile formed around this area and 0.5389 will rise.
-
Thank you for reading to the end.
I hope you have a successful trade.
--------------------------------------------------
- Here is an explanation of the big picture.
(3-year bull market, 1-year bear market pattern)
I will explain the details again when the bear market starts.
------------------------------------------------------
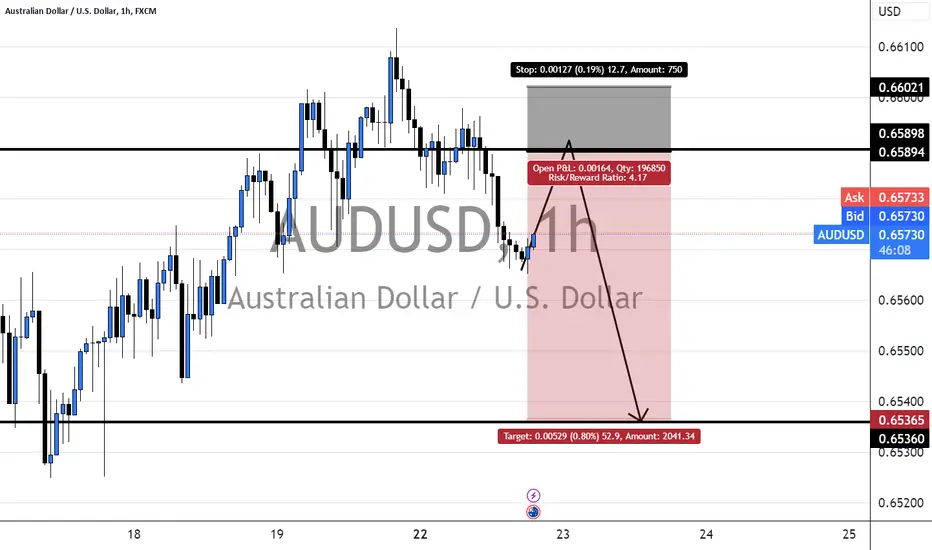
AUDUSDConsider selling AUDUSD based on historical seasonality trends and anticipated positive monetary policy by the 2024 Federal Reserve head. Monitor seasonal patterns, economic indicators, and central bank communications. Exercise caution, implement risk management, and seek professional advice as trading carries inherent risks.