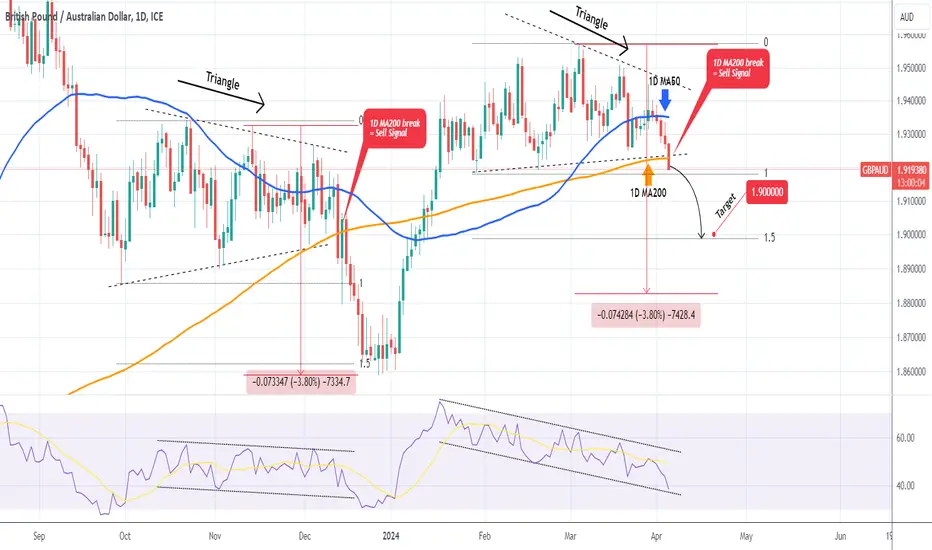
GBPAUD Sell signal on 1D MA200 Bearish Break-outThe GBPAUD pair gave us an excellent buy signal last time we looked at it (December 29 2023, see chart below), easily hitting our 1.9000 Target:
This time we have a Sell Signal that the pair just flashed as it just broke today below the 1D MA200 (orange trend-line) for the first time since January 15. Last time that happened was on December 13 2023, when GBPAUD also broke below a Triangle pattern and reached as low as the 1.5 Fibonacci extension level. The RSI patterns of the two sequences are also similar, being within Channel Down patterns.
As a result, we turn bearish on this pair today, targeting 1.9000.
-------------------------------------------------------------------------------
** Please LIKE 👍, FOLLOW ✅, SHARE 🙌 and COMMENT ✍ if you enjoy this idea! Also share your ideas and charts in the comments section below! This is best way to keep it relevant, support us, keep the content here free and allow the idea to reach as many people as possible. **
-------------------------------------------------------------------------------
💸💸💸💸💸💸
👇 👇 👇 👇 👇 👇
Australiandollar
AUDNZD Reversal expected. Cyclical bearish signal emerging.Has been a while since we looked into the AUDNZD pair, following our Sell Signal on November 16 2023 (see chart below):
The price has now reached the 1.093250 Symmetrical Resistance, which has basically only broken once in the last 12 months. Ahead of a potential 1D MACD Bearish Cross, we see a high resemblance of the current High with the June 20 2023 peak.
As a result, we are turning bearish on this pair, targeting the 0.618 Fibonacci retracement level (as the July 14 2023 Low) at 1.07100.
-------------------------------------------------------------------------------
** Please LIKE 👍, FOLLOW ✅, SHARE 🙌 and COMMENT ✍ if you enjoy this idea! Also share your ideas and charts in the comments section below! This is best way to keep it relevant, support us, keep the content here free and allow the idea to reach as many people as possible. **
-------------------------------------------------------------------------------
💸💸💸💸💸💸
👇 👇 👇 👇 👇 👇

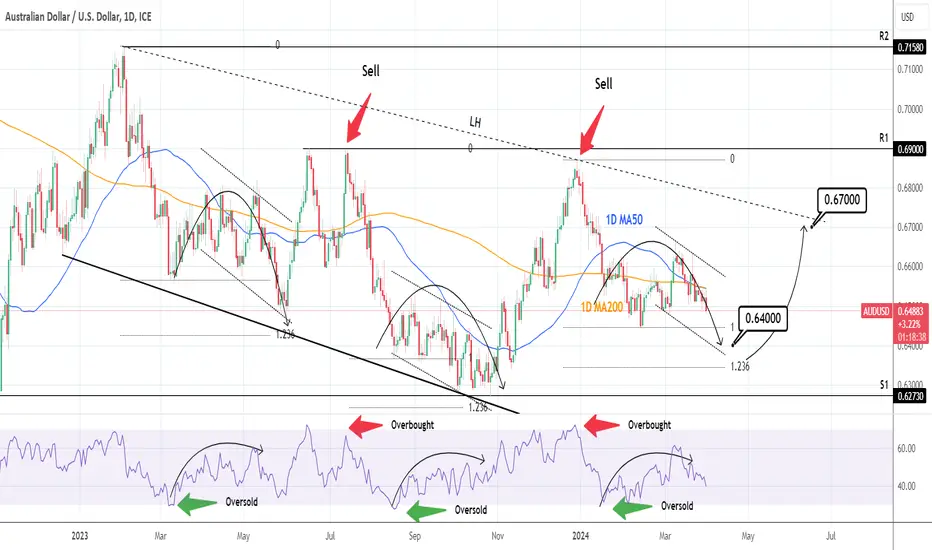
AUDUSD: Wait to buy this dip.AUDUSD is marginally bearish on its 1D technical outlook (RSI = 40.176, MACD = -0.001, ADX = 34.265) as it entered a Channel Down similar to those of August - October 2023 and April - May 2023. That is why we are expecting a bullish reveral the closer we get to the 1.236 Fibonacci extension. As long as the 1D RSI doesn't break into the oversold zone (<30.000), we will buy that dip and target the LH trendline (TP = 0.6700).
See how our prior idea has worked out:
## If you like our free content follow our profile to get more daily ideas. ##
## Comments and likes are greatly appreciated. ##
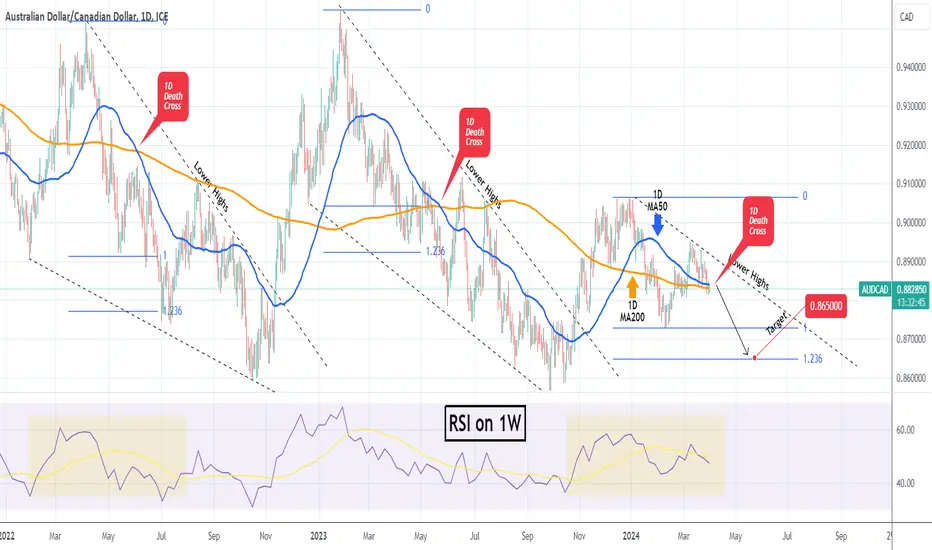
AUDCAD Sell opportunity with Death Cross emergingThe AUDCAD pair is on a Lower Highs rejected and ahead of a Death Cross formation on the 1D time-frame. Since 2022, we have seen two Falling Wedge patterns, which accelerated selling after the completion of a 1D Death Cross. The first target on both occasions was the 1.236 Fibonacci extension.
As a result, we are bearish on this pair, targeting 0.86500 (Fib 1.236 ext).
-------------------------------------------------------------------------------
** Please LIKE 👍, FOLLOW ✅, SHARE 🙌 and COMMENT ✍ if you enjoy this idea! Also share your ideas and charts in the comments section below! This is best way to keep it relevant, support us, keep the content here free and allow the idea to reach as many people as possible. **
-------------------------------------------------------------------------------
💸💸💸💸💸💸
👇 👇 👇 👇 👇 👇
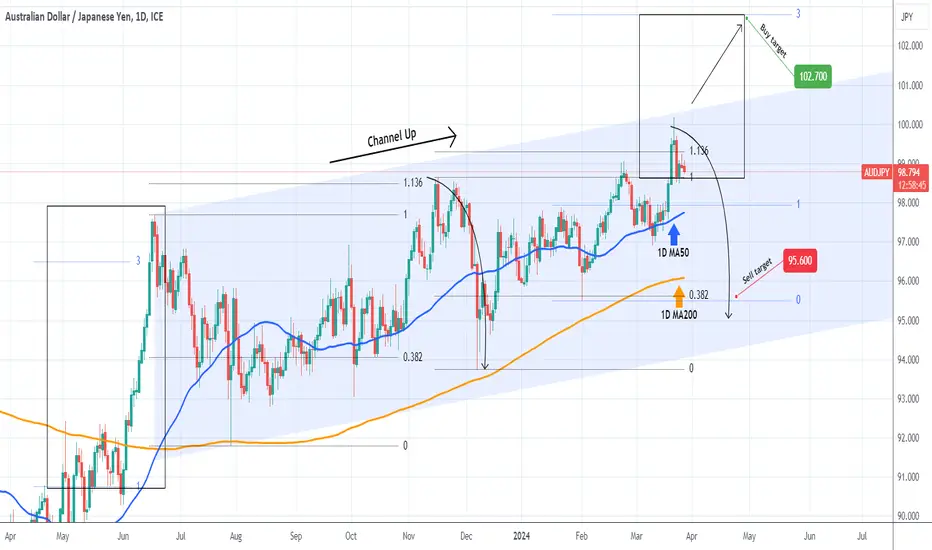
AUDJPY Hit the top of the Channel Up.The AUDJPY pair has recently hit our long-term bullish Target of 99.300, which we set on our last trading idea (December 18 2023, see chart below):
That was at the top (Higher Highs trend-line) and the 1.136 Fibonacci extension of the 9-month Channel Up. We are technically expecting a pull-back now towards the bottom (Higher Lows trend-line) of the Channel Up and our Target is the 0.382 Fibonacci retracement level at 95.600.
If however the price breaks above the Higher High and the Channel Up, we will have a formation bullish break-out and as a result we will take the small loss on the short and go long instead, targeting the 3.0 Fibonacci extension at 102.700. In that case we will be expecting a rally similar to June 2023, which led to the creation of the current Channel Up.
-------------------------------------------------------------------------------
** Please LIKE 👍, FOLLOW ✅, SHARE 🙌 and COMMENT ✍ if you enjoy this idea! Also share your ideas and charts in the comments section below! This is best way to keep it relevant, support us, keep the content here free and allow the idea to reach as many people as possible. **
-------------------------------------------------------------------------------
💸💸💸💸💸💸
👇 👇 👇 👇 👇 👇
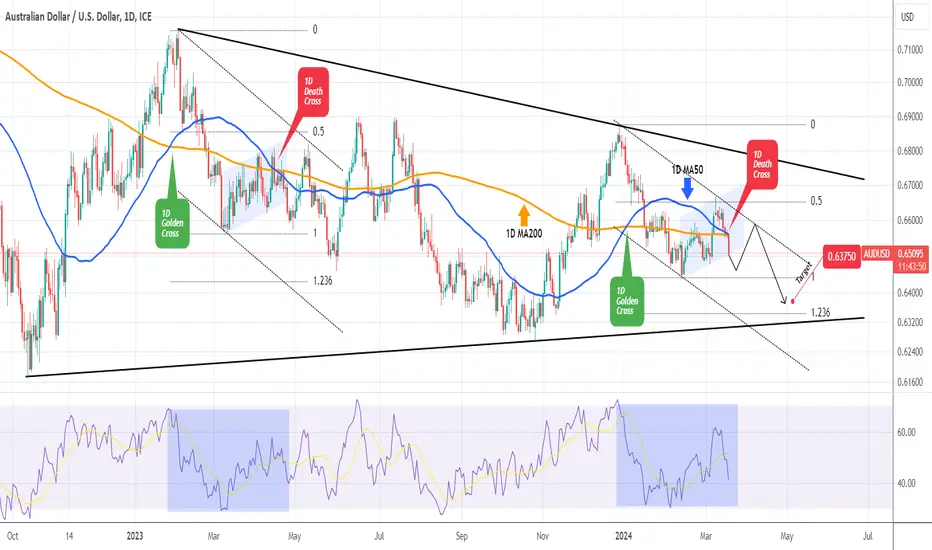
AUDUSD 1D Death Cross formed. Any bounce is a sell opportunity.The AUDUSD pair is forming today a 1D Death Cross, as the 1D MA50 (blue trend-line) is crossing below the 1D MA200 (orange trend-line), for the first time in 11 months (since April 14 2023). Obviously it is a major technical sell signal and in fact the price action since the start of the year (Channel Down), is very similar to the one of early 2023.
The 1D RSI fractals are virtually identical and in relative terms we are at the point where the (blue) Bear Flat is about to break downwards. Any rebound at this stage is a sell opportunity and our Target is just above the 1.236 Fibonacci extension at 0.63750.
-------------------------------------------------------------------------------
** Please LIKE 👍, FOLLOW ✅, SHARE 🙌 and COMMENT ✍ if you enjoy this idea! Also share your ideas and charts in the comments section below! This is best way to keep it relevant, support us, keep the content here free and allow the idea to reach as many people as possible. **
-------------------------------------------------------------------------------
💸💸💸💸💸💸
👇 👇 👇 👇 👇 👇
AUDCHF: Bullish Outlook Explained 🇦🇺🇨🇭
AUDCHF broke and closed above a key daily horizontal supply cluster.
The broken structure turned into a demand zone.
We can anticipate a bullish wave to 0.5837 resistance now.
❤️Please, support my work with like, thank you!❤️

AU projected target of 0.6600With China economic news, US election news, and NFP this upcoming Friday, we have a lot of fundamental events moving the markets. We just recently broke a LH on AU. I'm looking for a projected target of 0.6600
We will plan accordingly with whatever the market shows us and stick to our trading plans

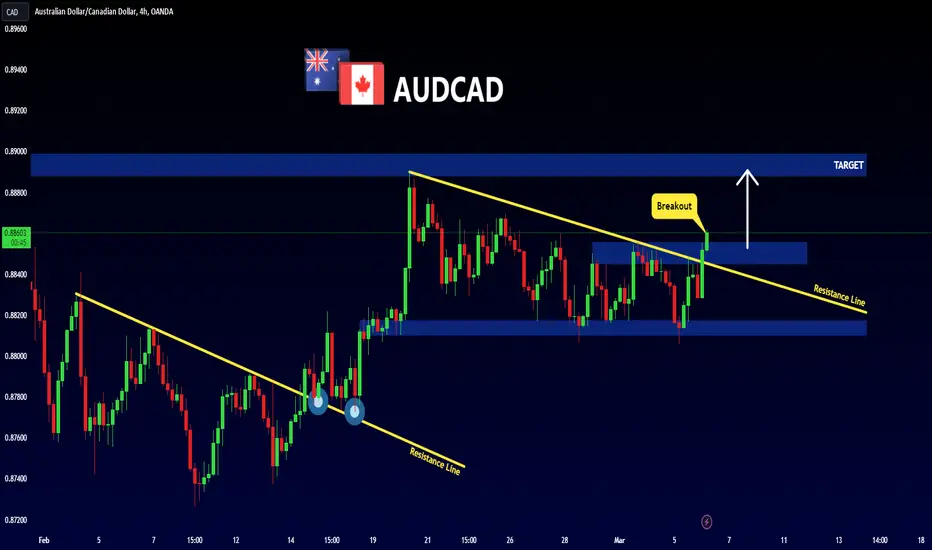
AUDCAD - NEW BREAKOUT 🚀
Hi Traders !
After a Huge Bullish Move, The AUDCAD Reached The Resistance Level.
Currently, The Price Formed a Descending Triangle.
The Resistance Line is Broken.
So, I Expect Another Bullish Move📈
------------
TARGET: 0.88880🎯
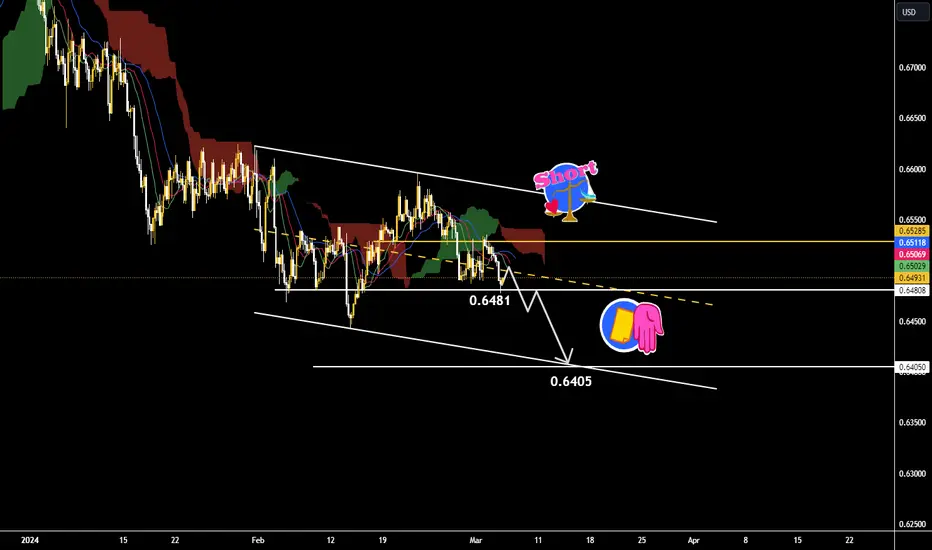
The AUDUSD is falling due to the weak performance of CHINA📌✔️Examining the trend in the four-hour time frame, the Australian dollar/US dollar is fluctuating in a descending channel, and considering the bearish camo cloud and the decline in the moving averages of the ALLIGATOR indicator, there is a possibility of price reduction.
📌✔️Overall, the scenario is strengthened as AUD/USD registers a one-hour candlestick close below the resistance at 0.6481, which could drop to support at the bottom of the descending channel at 0.6405.✔️🎯
AUD/CAD: Identifying Significant ZonesTraders,
Let's delve into the key zones for AUD/CAD:
We're witnessing a formidable bullish channel, but beware, it could break, triggering stop losses, only to rise again.
Our 1-hour zone is currently active. Consider partially closing positions when it aligns with the 15-minute and 4-hour zones.
Additionally, we'll increase our volume around the lower 1-hour zone.
Stay vigilant and adapt to market movements accordingly.
Best regards,

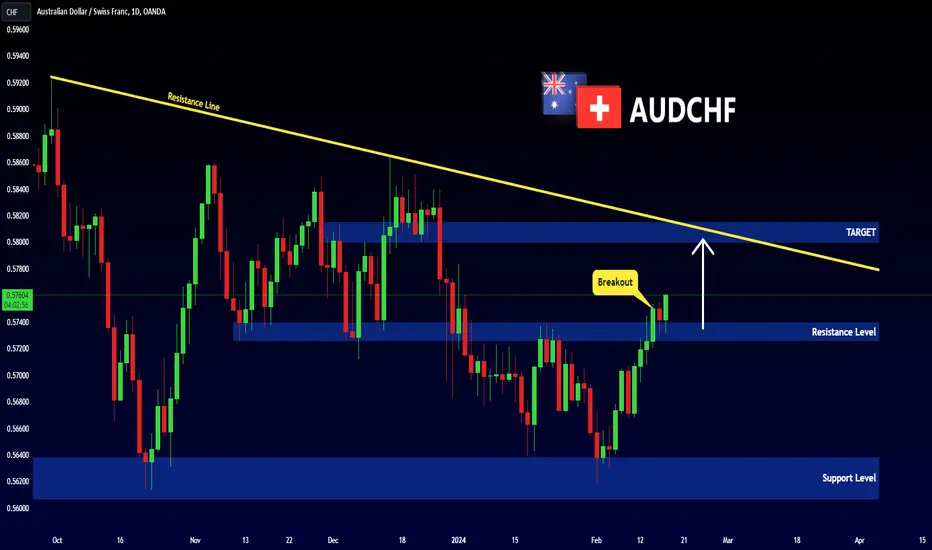
AUDCHF - Important Breakout 🚀Hi Traders !
On The Daily Time Frame The AUDCHF Broke a Strong Resistance Level (0.57396 - 0.57261).
This Resistance Level Becomes a New Support Level.
So, I Predict a Bullish Move 📈
------------
TARGET: 0.58000🎯
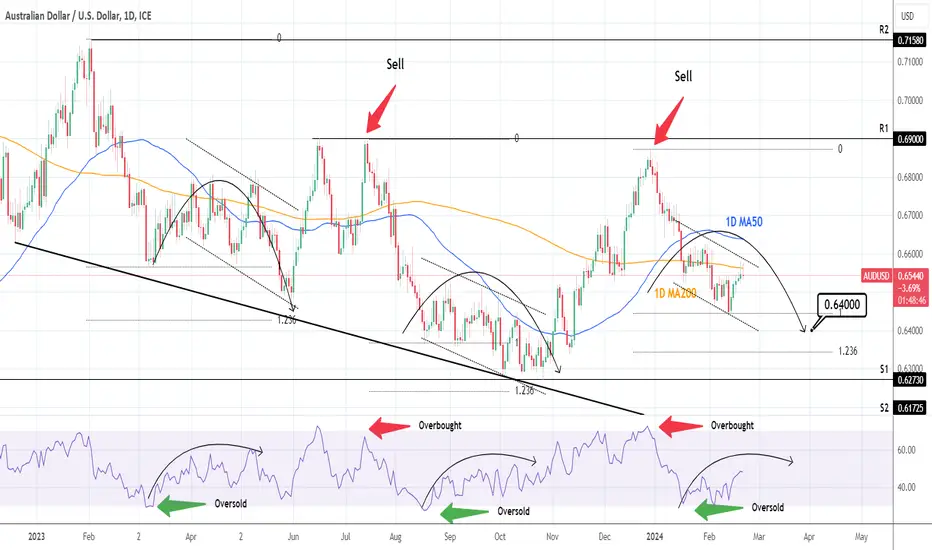
AUDUSD: Sustainable bearish trend.AUDUSD is trading inside a Channel Down pattern for the majority of 2024 so far and the neutral 1D technical outlook (RSI = 48.127, MACD = -0.003, ADX = 26.175) suggests that this is a potential sell entry. The price is below the 1D MA50 and exactly on the 1D MA200, where a rejection, validates the preservation of the bearish trend. If the price stays under it, we will remain bearish, targeting near the 1.236 Fibonacci extension (TP = 0.64000).
See how our prior idea has worked out:
## If you like our free content follow our profile to get more daily ideas. ##
## Comments and likes are greatly appreciated. ##
AUDCHF: Pullback From Key Level
🇦🇺🇨🇭AUDCHF broke a support line of a rising channel and a neckline of a double top pattern
on a 4 hour time frame, after a test of a key horizontal resistance.
We can expect a pullback from the underlined area at least to 0.5754
❤️Please, support my work with like, thank you!❤️

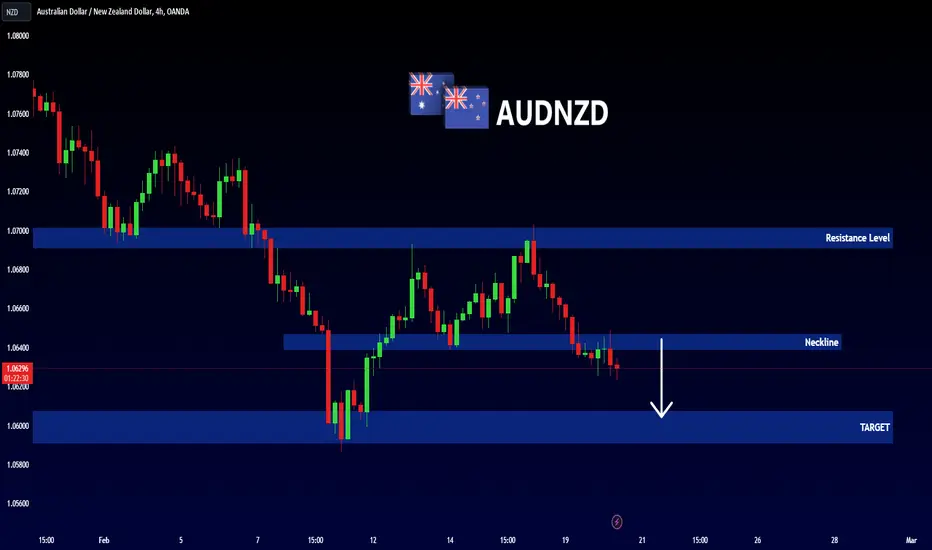
AUDNZD - Bearish Double TOP Hello Traders !
On Tuesday 13 Feb, The AUDNZD Reached a Resistance Level (1.06912 - 1.07016).
The Price Formed a Double TOP Pattern.
Currently, The Neckline is Broken !
So, I Expect a Bearish Move📉
-------------
TARGET: 1.06075🎯
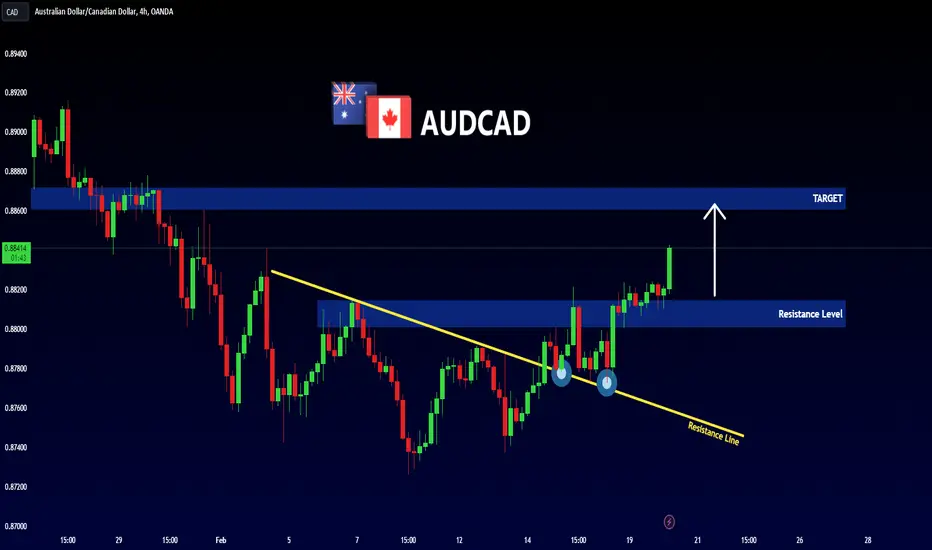
AUDCAD - Resistance Becomes Support 📈Hello Traders !
The AUDCAD Broke The Daily Resistance Level (0.88146 - 0.88014).
This Resistance Level Becomes a New Support Level.
The Resistance Line is Broken.
So, I Predict a Bullish Move 📈
------------
TARGET: 0.88610🎯
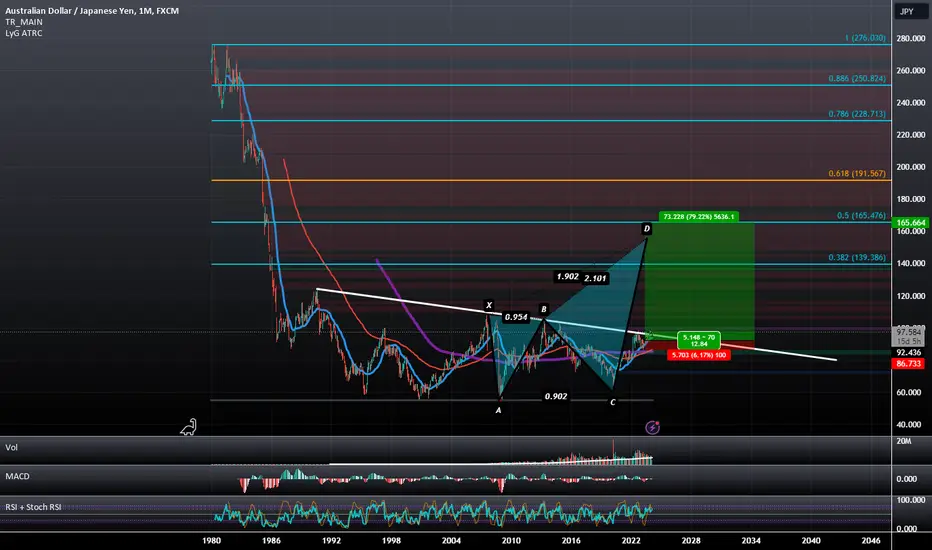
AUDJPY: BAMM Breakout Headed for a 50% RetraceI suspect as the Japanese Carry trade is pressured, that there will be an effort made by institutions to convert to AUD in anticipation of Australian Interest Rates potentially rising above US Interest Rates, this would revive the more traditional Australian Carry Trade and serve to reduce the downwards pressure put on the Japanese carry trade while also reducing their overall leverage and should allow them to prolong the Bull Market in equities at least until the spring. Meantime the conversion to AUD should Temporarily push the value of the AUD up higher and given how much leverage would be going from JPY to AUD, I'd suspect the rise we see in AUD to be a bit on the extreme side which could lead to us very quickly seeing AUDJPY reach the more macro Fibonacci retraces between 139 JPY to 191.567 JPY.
GBPAUD: Time For Pullback?! 🇬🇧🇦🇺
GBPAUD may retrace from a key horizontal resistance.
After an impulsive yesterday's movement, the pair became overbought
and formed a double top pattern on an hourly time frame.
I expect a bearish move to 1.946
❤️Please, support my work with like, thank you!❤️

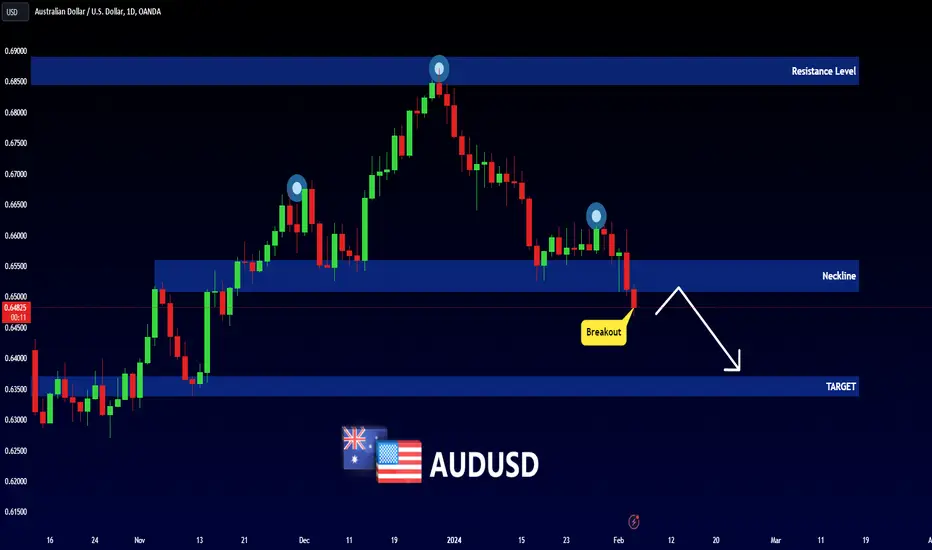
AUDUSD - Head and Shoulders 📉Hello Traders !
On The Daily Time Frame, The AUDUSD Reached a Strong Resistance Level.
The Price Formed a Head and Shoulders Pattern.
Currently, The Neckline is Broken !
So, I Expect a Bearish Move📉
-------------
TARGET: 0.63700🎯
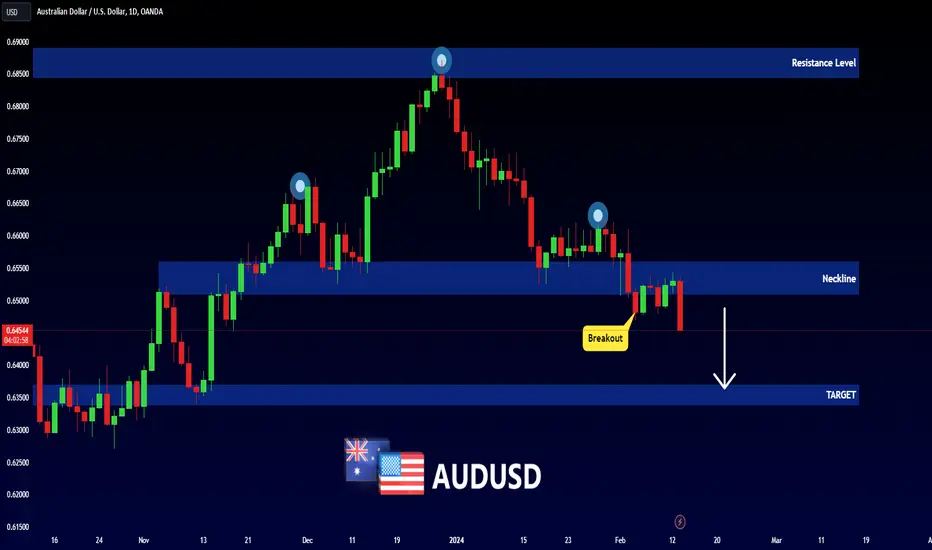
AUDUSD - Bearish Head and Shoulders 📉
As We Talked in The Previous Analysis:
The Price Formed a Head and Shoulders Pattern.
The Neckline is Broken !
Currently: The Price Pull Back to Important Structure.
and it Will Continue its Bearish Movement.
TARGET: 0.63700🎯
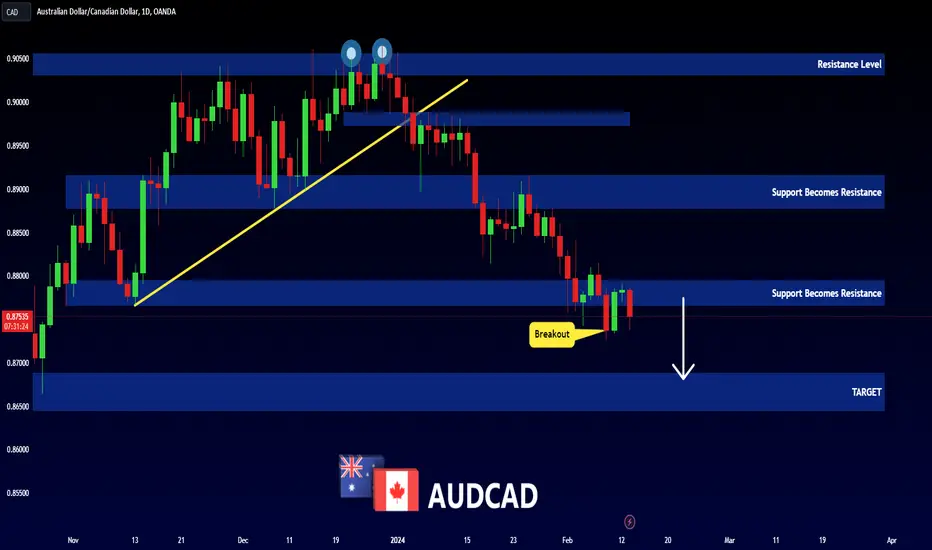
AUDCAD - Important Breakout 📉
Previously, The AUDCAD Formed a Bearish Double TOP Pattern.
Currently, The Price Broke The Support Level (0.87950 - 0.87662).
So, I Predict a Bearish Move.
-------
TARGET: 0.86880🎯
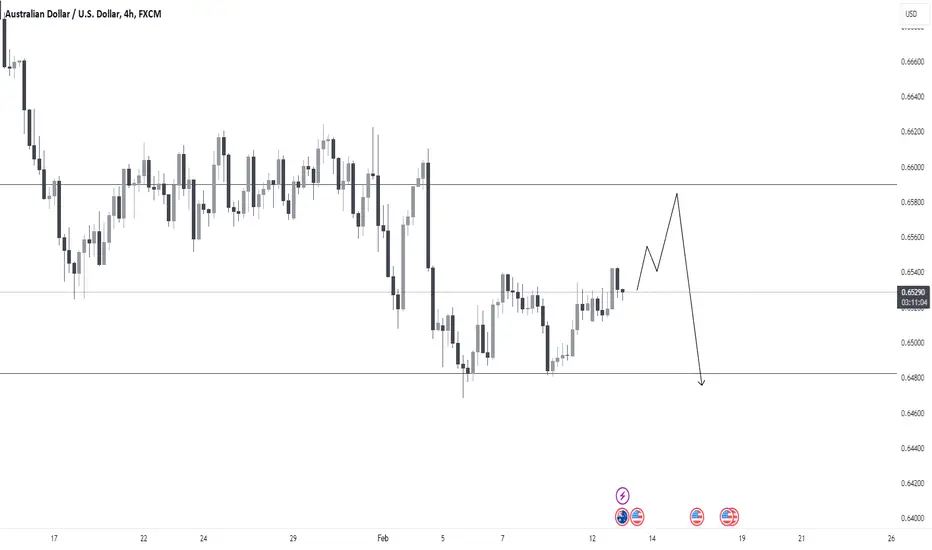
AUDUSD (Australia)AUDUSD at 4h time frame we have FVG area i think it will rise to FVG area and after FVG taken price instantly will drop to 0.64850
New lows for Aussie Dollar Futures Coming? CME Australian dollar futures have pulled back to the neckline of the recent head and shoulders pattern, which presents bears with a formidable selling opportunity. Recent strength in the USD has certainly been a boon to Australian dollar futures, and with the influx of encouraging economic data in the U.S.over the past few weeks, it appears likely that strength will persist. Moreover, greater confidence in the breakdown of Aussie dollar futures can be drawn with the increased selling pressure on the break through the neckline on the right shoulder. Over the course of the next few weeks, it is likely that the neckline will begin to act as resistance if prices indeed accelerate lower.
Check out CME Group real-time data plans available on TradingView here: tradingview.sweetlogin.com
Disclaimers:
CME Real-time Market Data help identify trading set-ups and express my market views. If you have futures in your trading portfolio, you can check out on CME Group data plans available that suit your trading needs tradingview.sweetlogin.com
*Trade ideas cited above are for illustration only, as an integral part of a case study to demonstrate the fundamental concepts in risk management under the market scenarios being discussed. They shall not be construed as investment recommendations or advice. Nor are they used to promote any specific products, or services.
Futures trading involves substantial risk of loss and may not be suitable for all investors. Trading advice is based on information taken from trade and statistical services and other sources Blue Line Futures, LLC believes are reliable. We do not guarantee that such information is accurate or complete and it should not be relied upon as such. Trading advice reflects our good faith judgment at a specific time and is subject to change without notice. There is no guarantee that the advice we give will result in profitable trades. All trading decisions will be made by the account holder. Past performance is not necessarily indicative of future results.
