Australian Dollar Strengthens Following RBA DecisionAustralian Dollar Strengthens Following RBA Decision
Today, the AUD/USD pair experienced a spike in volatility. According to ForexFactory, analysts had forecast that the Reserve Bank of Australia (RBA) would cut interest rates from 3.85% to 3.60%. However, the market was caught off guard as the central bank opted to keep rates unchanged.
The RBA stated the following:
→ It remains cautious in its inflation outlook and awaits further evidence confirming that inflation is on track to return to the 2.5% target.
→ The decision to hold the rate was made by a vote of six to three — a rare instance of a split opinion among committee members.
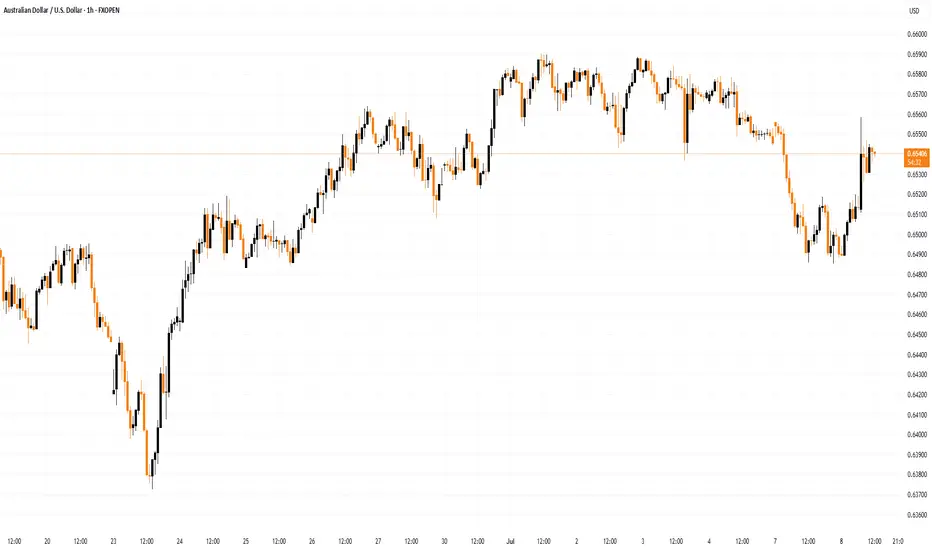
The initial market reaction to the RBA’s unexpected move was a sharp appreciation of the Australian dollar. However, this was followed by a quick pullback in the minutes that followed (as indicated by the arrows).
Technical Analysis of the AUD/USD Chart
Since early July, price action in AUD/USD has been forming a descending channel (marked in red). In this context:
→ Today’s sharp rally and subsequent retracement underscored the significance of the upper boundary of the channel;
→ The pair tested a previously broken ascending trendline (the lower line of the blue channel);
→ Although the price briefly rose above the 0.65450 level, this area may now act as resistance going forward.
There is a possibility that, as forex trading unfolds throughout the day, AUD/USD could retreat towards the median line of the descending channel. Such a move could be interpreted as follows:
→ The initial reaction to the RBA decision may have been premature;
→ Selling pressure persists, which might trigger a move towards the support zone near 0.64850.
Looking ahead, the trajectory of AUD/USD in July 2025 will be largely influenced by developments surrounding a potential trade agreement between the United States and other countries, including Australia.
This article represents the opinion of the Companies operating under the FXOpen brand only. It is not to be construed as an offer, solicitation, or recommendation with respect to products and services provided by the Companies operating under the FXOpen brand, nor is it to be considered financial advice.
Australiandollarforecast
AUSTRALIAN DOLLAR FUTURES (6A1!) Monthly, WeeklyDates in the future with the greatest probability for a price high or price low.
The Djinn Predictive Indicators are simple mathematical equations. Once an equation is given to Siri the algorithm provides the future price swing date. Djinn Indicators work on all charts, for any asset category and in all time frames. Occasionally a Djinn Predictive Indicator will miss its prediction date by one candlestick. If multiple Djinn prediction dates are missed and are plowed through by same color Henikin Ashi candles the asset is being "reset". The "reset" is complete when Henikin Ashi candles are back in sync with Djinn price high or low prediction dates.
One way the Djinn Indicator is used to enter and exit trades:
For best results trade in the direction of the trend.
The Linear Regression channel is used to determine trend direction. The Linear Regression is set at 2 -2 30.
When a green Henikin Ashi candle intersects with the linear regression upper deviation line (green line) and both indicators intersect with a Djinn prediction date a sell is triggered.
When a red Henikin Ashi candle intersects with the linear regression lower deviation line (red line) and both indicators intersect with a Djinn prediction date a buy is triggered.
This trading strategy works on daily, weekly and Monthly Djinn Predictive charts.
Trades made when the monthly and weekly arrows are pointing in the same direction are the most profitable.
This is not trading advice. Trade at your own risk.
