XAUUSD – Mid-Channel Rejection Near Key Supply ZoneGold has made an impressive recovery off the $3,250 zone, pushing back into the $3,380–$3,390 region — a key supply area which previously led to strong sell-offs.
We’re now sitting at the upper boundary of a 1H ascending channel and just under a significant resistance area seen on the 4H and daily timeframes.
Although bullish momentum is still present, price is showing early signs of exhaustion at this level — with small rejections forming and volume beginning to taper off.
The key zone to watch is $3,384 – $3,390. If price fails to break and close above this zone cleanly on the 4H, we may see a corrective pullback back toward the midline of the channel — or even a full retest of the lower boundary near $3,305 or $3,268 depending on momentum.
Bias: Short-term bearish / corrective – waiting for confirmation of rejection or bearish candle formation below $3,384.
Automarkets

Gold. - Bullish (structure still valid) • Daily: Maintaining higher lows along the trendline. Strong support at 3,300.
• 4H: Still respecting the diagonal, and showing strength despite short-term pullbacks.
• 1H: Breakout from descending trendline and now retesting the breakout zone at 3,350.
⚠️ Watch For:
• Clean bullish break above 3,365 confirms new impulse wave toward 3,400+.
• Support at 3,335 must hold to avoid flipping neutral.
• Patience required if price consolidates between 3,340–3,360.

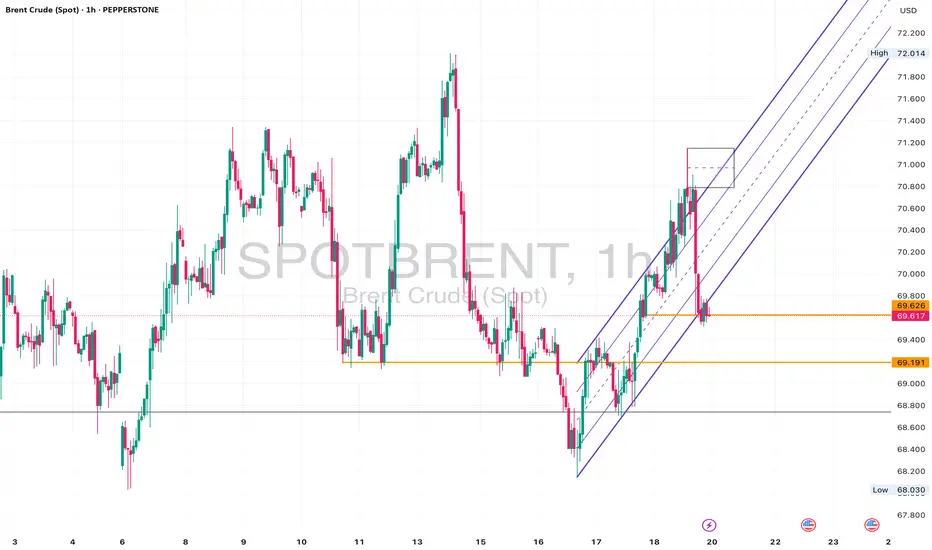
Brent UKOil - Neutral Slightly Bearish • Daily: Price is sitting above long-term trendline support, but momentum is waning.
• 4H: Structure looks indecisive with constant failures near 71.00.
• 1H: Recent break of the upward channel. Now retesting that zone from below.
⚠️ Watch For:
• Retest of 69.60–70.00 as resistance.
• Break and close below 69.20 could signal deeper downside.
• If it holds above 70.20 again, bullish bias resumes.
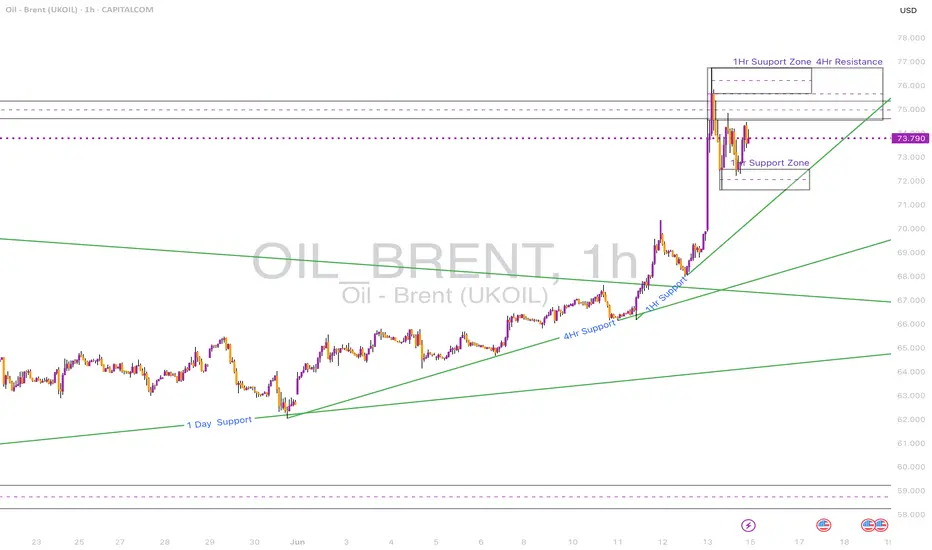
Brent Crude Hits Key Supply Zone After BreakoutPrice has aggressively broken out from the descending wedge and reached a strong 4H & 1D resistance zone between 74.50–76.00.
• 1D Chart: Sharp breakout from long-term descending trendline. Approaching resistance from Feb-April supply area.
• 4H Chart: Bullish structure confirmed by higher lows and breakout of ascending channel.
• 1H & 23m Chart: Consolidating beneath resistance, forming a triangle structure.
Key Zones:
• Support: 71.50–72.00
• Resistance: 74.50–76.00
Bias: Neutral short-term (range). Bullish if 76 is broken and held.
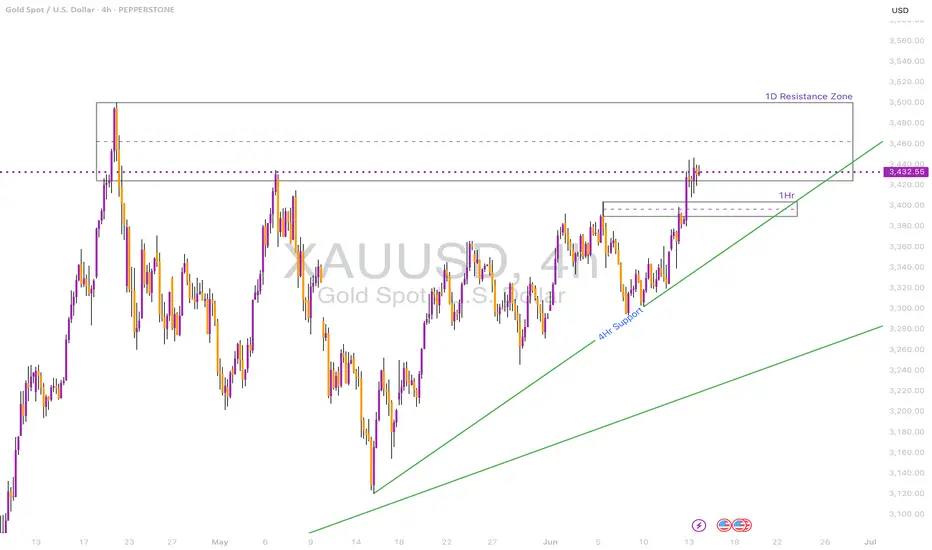
Gold Testing Daily Resistance – Will the Breakout Hold?Gold is currently testing a major 1D resistance zone at 3432–3450 after a strong bullish move.
• 1D Chart: Price has rallied back into the resistance zone after bouncing from ascending trendline support.
• 4H Chart: Strong momentum candle broke through the prior 4H resistance zone at ~3360, confirming bullish pressure.
• 1H & 23m Chart: Price is holding within a bullish channel, but showing signs of consolidation under key resistance.
Key Zones:
• Support: 3380 / 3360
• Resistance: 3432–3450
Bias: Bullish above 3360. Needs daily close above 3450 for continuation.