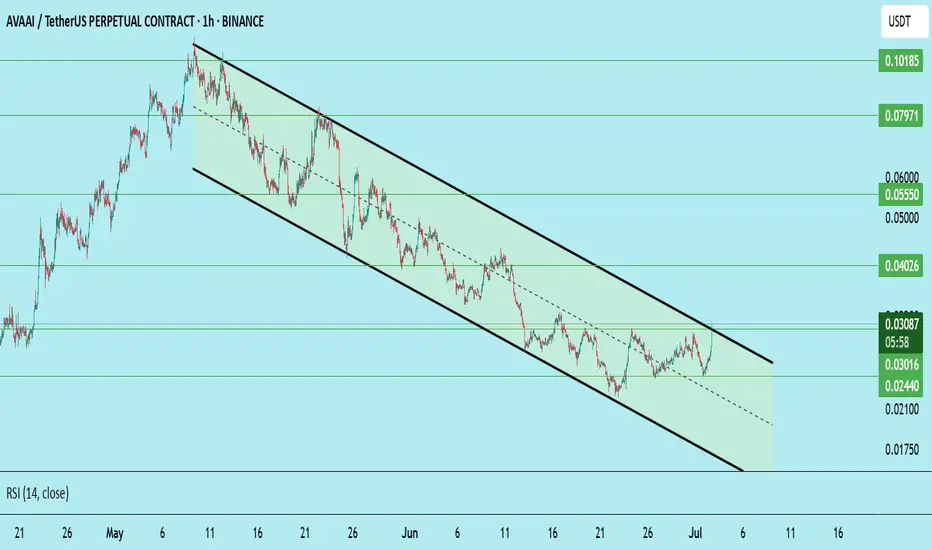
AVA/USDT – Long-Term Bullish Reversal in PlayAVA has been trading within a well-defined downward channel for weeks, making consistent lower highs and lower lows. However, price has now broken above the upper boundary of the channel with strong volume and momentum, signaling a potential trend reversal.
Technical Analysis:
Channel Breakout:
Price has successfully closed above the descending trendline (channel top), confirming breakout and bullish intent.
RSI Surge:
RSI has shot past 80, a sign of strong bullish momentum. Short-term pullbacks may occur, but long-term sentiment is shifting.
Higher Lows Forming:
Structure is starting to shift from bearish to bullish, especially with current candle body closings above $0.03016.
Volume Spike:
Notable increase in buying volume, often seen before trend flips in micro caps or small altcoins.
Key Levels to Watch:
Support Zones:
$0.03016 – Key breakout level; should act as support now
$0.02440 – Historical accumulation zone
$0.02100 – Long-term base support
Resistance / Target Zones:
T1: $0.04026 – Local structure and previous consolidation
T2: $0.05550 – Psychological and technical resistance
T3: $0.07971 – Major reversal zone
T4: $0.10185 – Long-term target from macro high
Stoploss:
$0.02400 (close below re-enters channel and invalidates breakout)
Entry Idea:
Accumulation Zone: $0.029–$0.031
This is the ideal area for positioning with minimal risk and a good reward ratio.
Not Financial Advice | DYOR Always