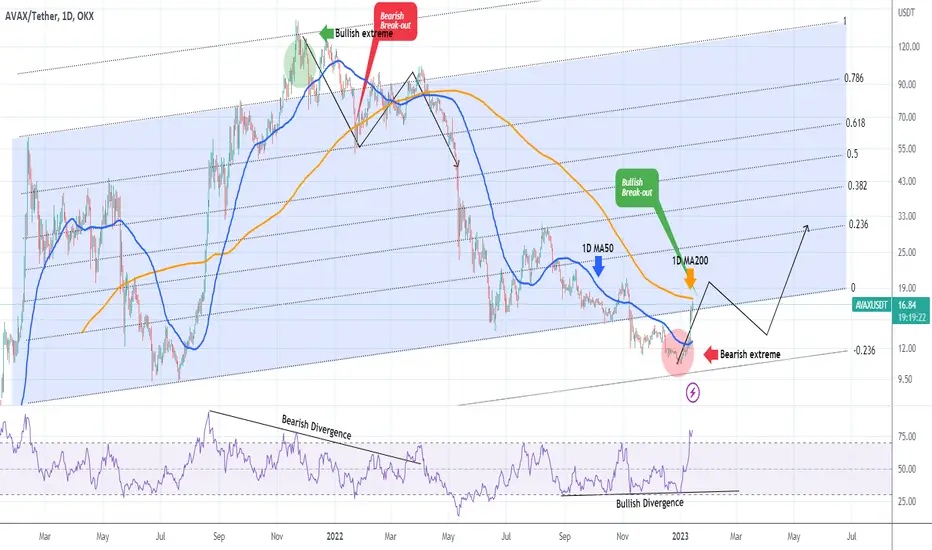
AVAXUSD is the closest to its 1D MA200 it's been since April!Avalanche (AVAXUSD) is about to hit its 1D MA200 (orange trend-line) for the first time since April 11 2022! Needless to say, a break-out there would be a major long-term bullish signal for the coin.
With AVAX trading within a Channel Up since the February 2021 High, we can see that the best Sell entry and (potentially now) best Buy entry have come around its +0.236 and -0.236 Fibonacci extension (extreme) levels respectively. Those extremes have both come after the 1D RSI went deep into a Bearish and Bullish Divergence respectively. On the November 21 2021 High, while AVAX was rising on Higher Highs, the RSI was falling on Lower Highs, hence a Bearish Divergence, indicating loss of strength on the trend. Similarly on the December 30 2022 Low, while AVAX was falling on Lower Lows, the RSI was rising on Higher Lows, hence a Bullish Divergence, indicating a weakening bearish trend.
In both cases, the breaking of the 1D MA200 was the confirmation of trend reversal. And since in late January 2022 after the 1D MA200 bearish break-out, AVAX bounced back on the short-term above the 1D MA50 (blue trend-line) before making the deep collapse, we expect this time also after the 1D MA200 bullish break-out to pull-back on the medium-term before starting to fill the upper Fibonacci levels of the Channel Up one by one in the new Bull Cycle.
-------------------------------------------------------------------------------
** Please LIKE 👍, FOLLOW ✅, SHARE 🙌 and COMMENT ✍ if you enjoy this idea! Also share your ideas and charts in the comments section below! **
-------------------------------------------------------------------------------
💸💸💸💸💸💸
👇 👇 👇 👇 👇 👇
Avalanche
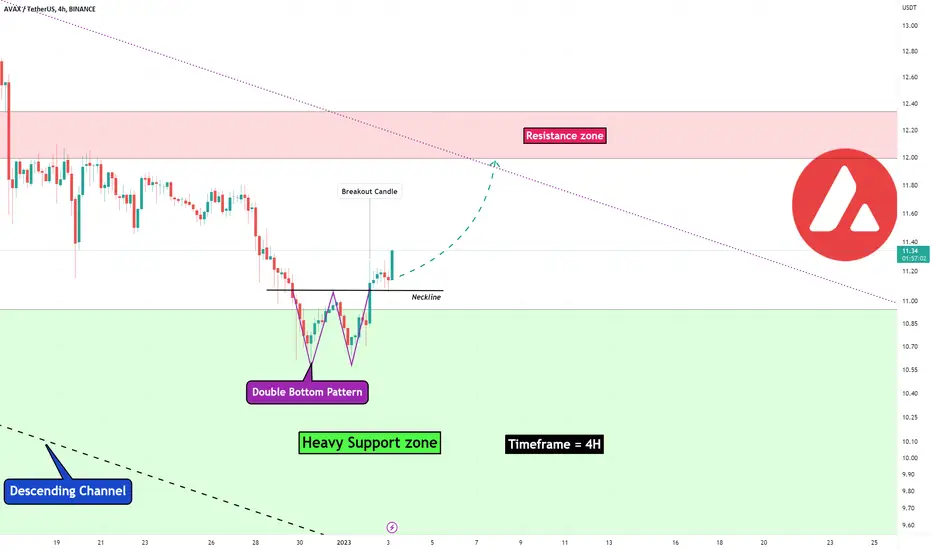
Avalanche Analyze (Short term, Timeframe 4H, 01/03/2023)!!!Avalanche was able to make a double-bottom pattern on the heavy support zone.
I expect Avalanche will go up at least until the middle line of descending channel and resistance zone.
Avalanche Analyze ( AVAXUSDT ) Timeframe 4h⏰ (Log Scale).
Do not forget to put Stop loss for your positions (For every position that you want to open).
Please follow your strategy, this is just my idea, and I will be glad to see your ideas in this post.
Please do not forget the ✅' like '✅ button 🙏😊 & Share it with your friends; thanks, and Trade safe.
In order to transition to a mid- to long-term uptrend...Hello?
Traders, welcome.
If you "Follow", you can always get new information quickly.
Please also click "Boost".
Have a nice day.
-------------------------------------
(AVAXBTC 1W Chart)
AVAX, one of the coins that are expanding the coin ecosystem, is rising to a section where it is likely to emit the power of rising.
If it rises above 0.0009 187, it is judged that there is a possibility of exploding the power of the rise.
------------------------------------------
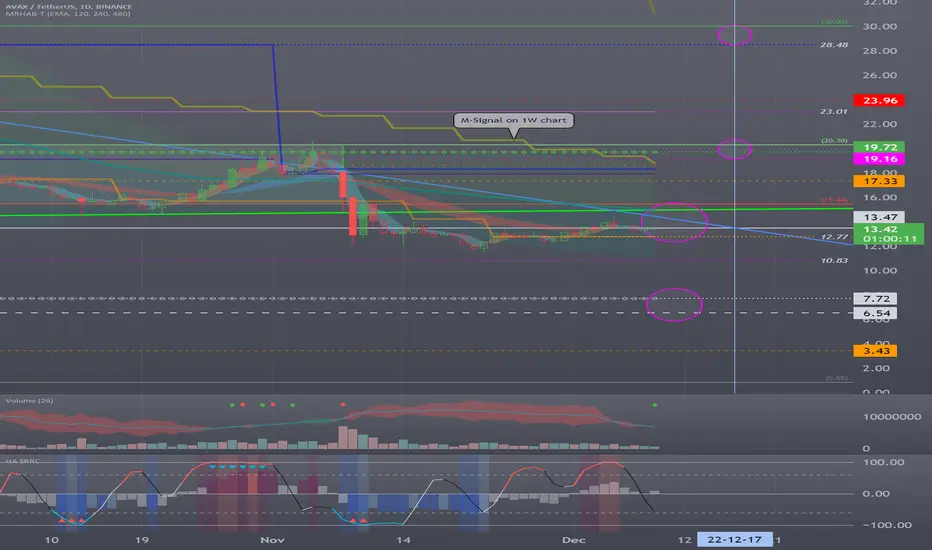
(AVAXUSDT 1W Chart)
It shows a movement out of the volume profile section of 6.54-13.47.
If the price rises above the MS-Signal and maintains the price, there is a high possibility that it will turn into an upward trend from a mid- to long-term perspective.
(1D chart)
The key is whether it can rise above 19.72 with support in the 14.99-16.65 section.
If not, you should check if the price holds within the 12.40-13.47 zone or higher.
Since the M-Signal on the 1W chart is formed around 16.65, it is important whether it can rise above 16.65.
-------------------------------------------------- -------------------------------------------
** All descriptions are for reference only and do not guarantee profit or loss in investment.
** If you share this chart, you can use the indicators normally.
** The MRHAB-T indicator includes indicators that indicate points of support and resistance.
** HA SRRC indicators are displayed as StochRSI (line), RSI (columns), and CCI (bgcolor).
** The CCI indicator is displayed in the overbought section (CCI > +100) and oversold section (CCI < -100).
(Short-term Stop Loss can be said to be a point where profit or loss can be preserved or additional entry can be made by split trading. This is a short-term investment perspective.)
---------------------------------

AVAX BUILD UP BREAKOUTKUCOIN:AVAXUSDT
AVAX has broken out of bullish smaller cup and handle and possibly printing a buildup (visible clearer on LTF). On break possible Long for upto 26% upside.
SOL - posted yesterday broke to +30% and consolidating for possible leg higher
If you liked this idea or if you have your own opinion about it, write in the comments.
The information and publications are not meant to be, and do not constitute, financial, investment, trading, or other types of advice or recommendations.

AVA/USDT | Pretty Solid Consolidation..!!
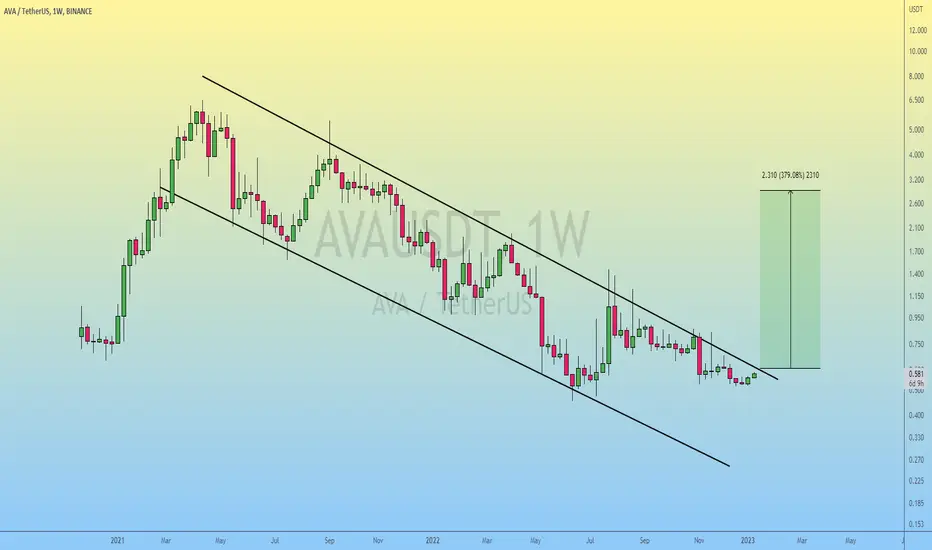
#AVA Forming Descending Channel in the Weekly timeframe Chart.
Looks Bullish here & Seems like Ready for Massive Breakout..
Bulls need to Close the Weekly Candle Above 0.6$ to Confirm the Breakout.
In Case of Upside Breakout, Expecting 3-4x Bullish Rally in the Midterm..
Please like the idea for Support & Subscribe for More ideas like this and share your ideas and charts in Comments Section..!!
Thanks for Your Love & Support..!!
Avalanche Trading IdeaAvalanche Trading Idea. - lets see how it goes. marked the levels for plans and triggers

January 6 BTCUSD BingX Chart Analysis and Today's HeadlineBingX’s Bitcoin Chart
In the first trading week of 2023, the market was still consolidated with extremely low volatility and trading volume. Bitcoin's volatility has hit record lows one after another, and a new round of changes is brewing. The probability of Bitcoin's upward turnup still exists, but it needs to wait patiently for market confidence to recover.
Today’s Cryptocurrency Headline
Shopify Supported All Merchants to Directly Sell and Mint NFT on Avalanche
According to Decrypt, the e-commerce giant Shopify announced that it has supported millions of online merchants on the platform to directly sell and mint NFT on the Avalanche chain without guiding customers to the NFT market such as OpenSea or Magic Eden. This function was developed in cooperation with Venly, a blockchain technology startup.
Disclaimer: BingX does not endorse and is not responsible for or liable for any content, accuracy, quality, advertising, products, or other materials on this page. Readers should do their own research before taking any actions related to the company. BingX is not responsible, directly or indirectly, for any damage or loss caused or alleged to be caused by or in connection with the use of or reliance on any content, goods, or services mentioned in the article.

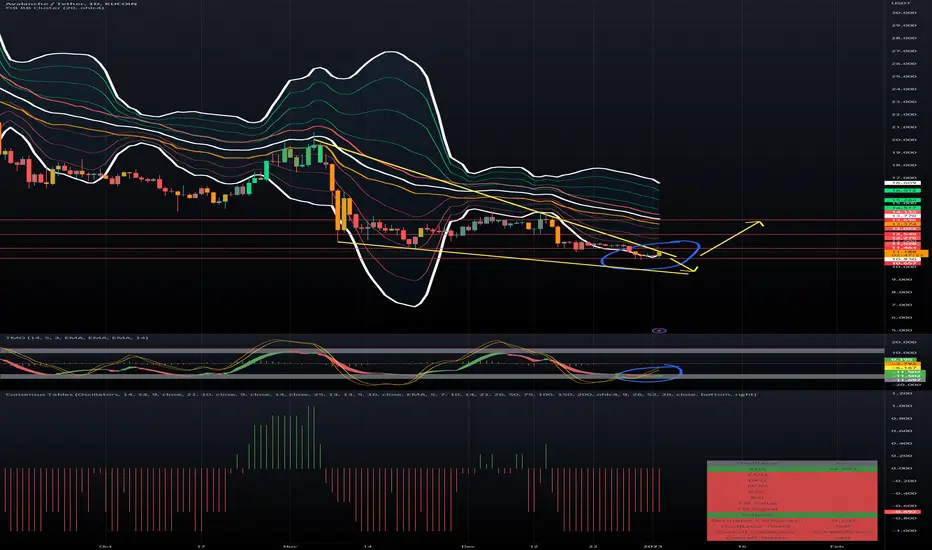
AVAX Breakout PotentialIndicators used:
True Momentum Oscillator
Fibonacci Bollinger Band Cluster
Consensus Tables
The daily AVAXUSDT chart seems primed for a breakout, with lower timeframe charts beginning bullish movement. The TMO is in the oversold lower range with the momentum heating up towards the zero line. Price is hovering around the bottom-most band of the Fib. Bollinger Band cluster, past the 1st, 2nd, and 3rd deviations. Price action is testing upper bounds of a larger trendline, potentially as part of a falling wedge. Wedges of the sort have a tendency to break into inverse head and shoulder patterns, which could lead to a price recovery into the $13.50-14.40 range, provided BTC holds up. Otherwise, a test of the lower trend line is likely.
The point to be supported is...Happy new year!
Traders, welcome.
If you "Follow", you can always get new information quickly.
Please also click "Boost".
Have a good day.
-------------------------------------
(AVAXBTC 1W Chart)
In order to dissipate the rising force, it must rise above 0.008 602 ~ 0.0009 187.
--------------------------------------
(AVAXUSDT 1M Chart)
The key question is whether the price can sustain its rise above 13.47.
If not, it is better to wait until HA-Low is created in the long term.
(1W chart)
If it continues to decline along the downtrend channel, there is a possibility of a decline to around 6.54, so we need to think about countermeasures.
(1D chart)
The question is whether it can break out of the downtrend channel by moving sideways around 10.83.
If not, a decline to around 7.72 is likely.
-------------------------------------------------- -------------------------------------------
** All descriptions are for reference only and do not guarantee profit or loss in investment.
** If you share this chart, you can use the indicators normally.
** The MRHAB-T indicator includes indicators that indicate points of support and resistance.
** HA SRRC indicators are displayed as StochRSI (line), RSI (columns), and CCI (bgcolor).
** The CCI indicator is displayed in the overbought section (CCI > +100) and oversold section (CCI < -100).
(Short-term Stop Loss can be said to be a point where profit or loss can be preserved or additional entry can be made by split trading. This is a short-term investment perspective.)
---------------------------------

AVAXUSDNot a bad looking chart and considering its still making LL, we just need to bulls to step in and take control of these bears. AVAX ticks a lot off my check list when it comes to location, indicator confirmation but still lacking price structure. Another thing to add is that I like to look at charts that have a decent risk reward which AVAX seems to have. As always, trade at your own risk and never go full retard on any one trade.

AVAXUSDT: Breakout of Bearish Channeling,Goes Under $12.00 soon?Hello Fellow Global Crypto Investor/Trader, Here's a Technical outlook on Avalanche Coin!
Chart Perspective
The breakout of the bearish channeling is an indication of a potential bearish sentiment. Recently, The MACD Indicator made a death cross, confirming a possible downside movement to the target area.
All other explanations are presented on the chart.
The roadmap will be invalid after reaching the target/resistance area.
"Disclaimer: The outlook is only for educational purposes, not a recommendation to put a long or short position on the AVAXUSDT"
Support the channel by giving us a thumbs up and sharing your opinions in the comment below!

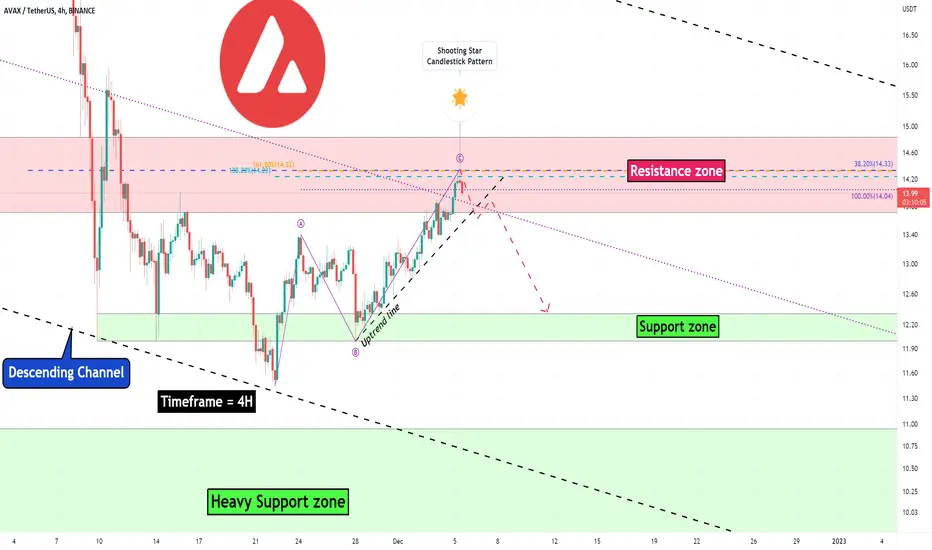
Avalanche Analyze (Short term, Timeframe 4H, 12/05/2022)!!!
Avalanche was able to reach the resistance zone by zigzag correction.
The sign of the end of the zigzag correction is the creation of two Shooting Star Candlestick Patterns in the resistance zone.
I expect Avalanche will go down at least until the support zone after breaking the uptrend line.
Avalanche Analyze (AVAXUSDT) Timeframe 4h⏰ (Log Scale).
Do not forget to put Stop loss for your positions (For every position that you want to open).
Please follow your strategy, this is just my idea, and I will be glad to see your ideas in this post.
Please do not forget the ✅' like '✅ button 🙏😊 & Share it with your friends; thanks, and Trade safe.
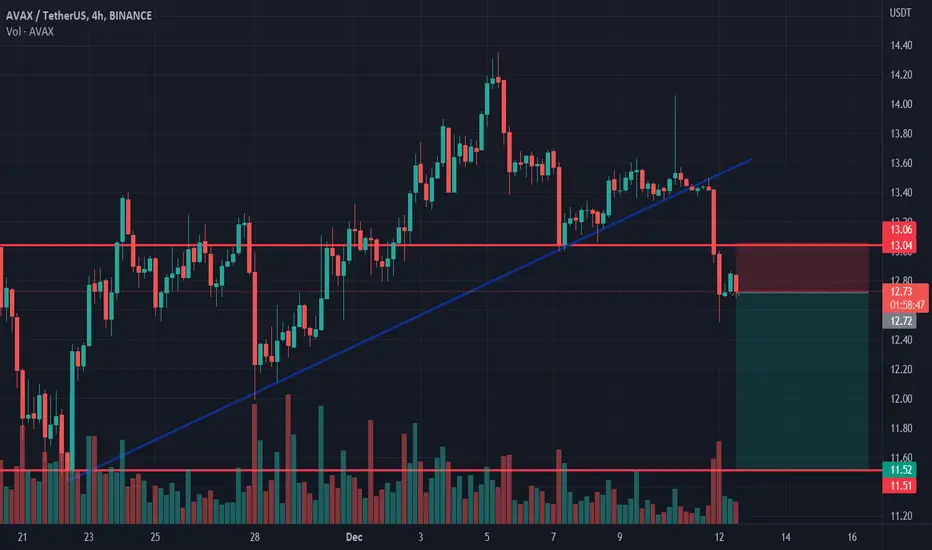
Avalanche shortAvalanche broke trough the ascending trendline. Asset broke trough the support level. Bearish movement to support level at 11.52 is possible.
Buying is risky because it is close to the resistance zoneHello?
Traders, welcome.
If you "Follow", you can always get new information quickly.
Please also click "Boost".
Have a good day.
-------------------------------------
(AVAXBTC 1W Chart)
If it is supported and rises in the range of 0.0007 164 to 0.0009 769, it is expected to release the power of the rise.
----------------------------------------
(AVAXUSDT 1W Chart)
It is important to be able to rise to the 15.44-20.30 section and be supported.
To do that, we need to see if we can get support around 13.47.
(1D chart)
It's a matter of being supported in the 12.77-13.47 section or higher and being able to rise above 15.44.
If not, you should be careful as there is a possibility that you will be forced to move around 6.54.
The 15.44-20.30 section is the section that determines the trend, and if it is supported and rises in this section, it is likely to continue the uptrend.
That said, the 15.44-20.30 section is a section with strong support and resistance, so be careful buying.
-------------------------------------------------- -------------------------------------------
** All descriptions are for reference only and do not guarantee profit or loss in investment.
** If you share this chart, you can use the indicators normally.
** The MRHAB-T indicator includes indicators that indicate points of support and resistance.
** HA SRRC indicators are displayed as StochRSI (line), RSI (columns), and CCI (bgcolor).
** The CCI indicator is displayed in the overbought section (CCI > +100) and oversold section (CCI < -100).
(Short-term Stop Loss can be said to be a point where profit or loss can be preserved or additional entry can be made by split trading. This is a short-term investment perspective.)
---------------------------------
AVAX (Y22.P4.Video1).Macro hypothesis and trading setupsHi All,
#AVAX #AVALANCHE #CRYPTO
Looking at #AVAX at the macro cycle so far, find reasons for support and resistance and how they align with likely the wyckoff cycle.
We look at the bullish and bearish scenarios We investigate the likely shorting opportunities as well if it plays out.
All the best,
S.SAri

AVAXUSD Don't get excited until it breaks these levelsAvalanche is having a good stretch in December but we can't lift our hopes yet as it remains below the 1D MA50 . Even if it breaks it, it will still be contained inside the Falling Wedge of June. Our signal to enter AVAXUSD will be when it breaks the 1D MA200 , which is untouched since April 10th. The bullish target will be $30.00.
Until this happen, with the RSI pattern looking increasingly like the last 1D MA50 rejection, it is more likely to see the Falling Wedge break downwards and make a new low on the 1.236 Fibonacci at $9.00.
Follow us, like the idea and leave a comment below!!

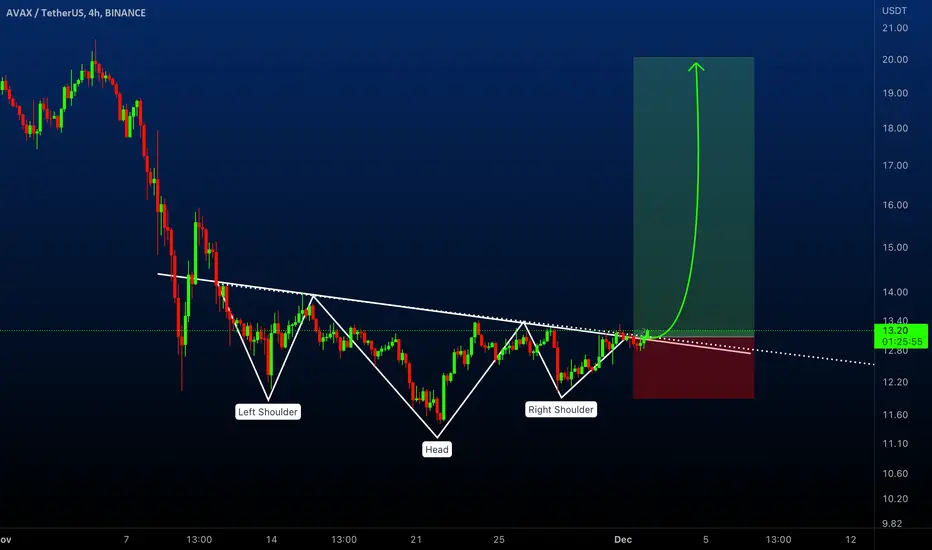
AVAXUSDT - Head and Shoulders PatternAVAXUSDT (4h Chart) Technical analysis
AVAXUSDT (4h Chart) Currently trading at $13.1
Buy level: Above $13
Stop loss: Below $11.9
TP1: $13.8
TP2: $15.5
TP3: $17.8
TP4: $20
Max Leverage 3x
Always keep Stop loss
Follow Our Tradingview Account for More Technical Analysis Updates, | Like, Share and Comment Your thoughts
Avalanche Forms A Bottom | Targets Up To 139%Notice the strong volume 9-Nov. and the huge drop that happened after this date...
Avalance (AVAXUSDT) hit a new low based on this volume signal and the 3 drops pattern; which leads to price going up.
EMA100 is the easy target for 37%.
There can be more of course.
Maybe we can see MA200 challenged fro 55% or EMA300 for a maximum of 139% on the next bullish wave.
Namaste.

Avalanche shortAvalanche bounced off the resistance level. Asset bounced down off the bearish trendline. Decline to support level at 12.42 is expected to happen.
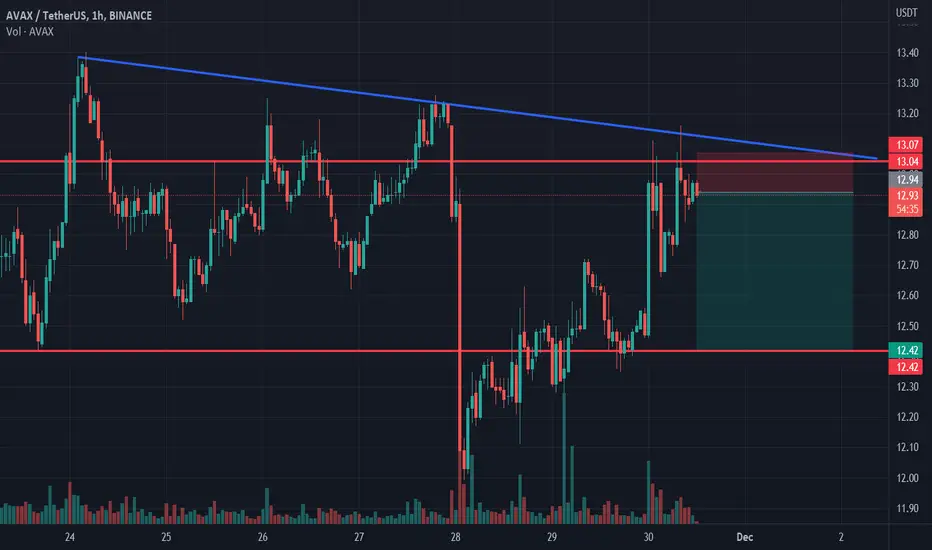
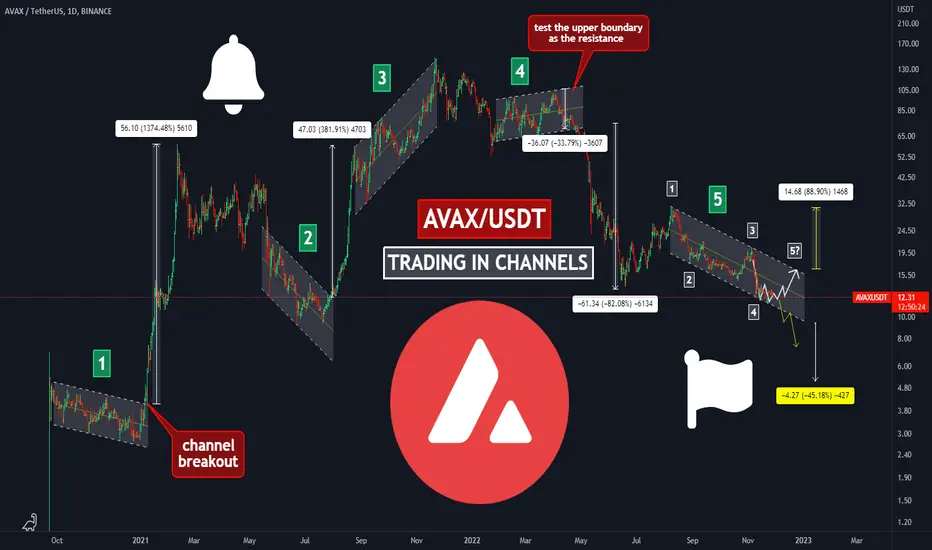
🔥EASY MONEY ON AVAX: ENJOY THE CHANNEL TRADING❗ 🔥 Hi friends! Avalance have the special pattern from the very beginning of it's listing on exchange. It trades in the channels more than any other altcoins that I have already seen. It's 5th GLOBAL channel for the last 2 years.
📊 The trading in channel is very simple. I recommend you to trade it in 3 ways:
🔥 the pullbacks after the test lower/upper boudary of the channel
🔥 the breakout of the channel after 5-6 test
🔥 the false breakout, when the price return inside the channel
✅ These 3 methods is very usefull, especially for beginners. Such trading aproaches don't bring you a millions of $ in 2 month, but it's a big advantages to know how to use it. The most profitable are 1st and 3rd from my trading experience.
🚩 Current situation on crypto market is not clear. BTC make a pullback and possibly will go up, but AVAX squeezing to the lower boundary of the channel which is bearish signal.
Friends, as you already know, If BTC go up, all the alctoin follow it. So the same can heppen in this case too.
📊 When BTC will go up, I have such targets for AVAX:
1. $14 - the key level
2. $16-17 - the upper boundary of the channel and local resistance
3. $20 - the key level and local high
🚩 Traders, do you find another channel that I don't marked? Share you screeenshots with the last channel in the comments!
Also if you want know more about the channels trading, let me know in the comments or DM.
💻Friends, press the "boost"🚀 button, write comments and share with your friends - it will be the best THANK YOU.
P.S. Personally, I open an entry if the price shows it according to my strategy.
Always do your analysis before making a trade
Avax short positions İ will take short positions again 13.08-13.1 price area
And i will wait 12.7 retest area, finalliy 11.44 is will come
Good luck and save your money :)

Avalanche (AVAX) - November 24Hello?
Traders, welcome.
If you "Follow", you can always get new information quickly.
Please also click "Boost".
Have a good day.
-------------------------------------
(AVAXBTC 1W Chart)
In order to get the power to rise, it must be supported in the range of 0.0007 164 to 0.0009 769.
---------------------------------------
(AVAXUSDT 1W Chart)
The 15.44-20.30 interval is the one that determines the trend.
Therefore, it is important to be supported by rising to the 15.44-20.30 section.
However, the 13.47 point is the volume profile section, and if resistance is received at 13.47, there is a possibility of falling to around 6.54, so you need to think about countermeasures.
(1D chart)
It will be important if the price can quickly rise above 13.47 and sustain the price.
If this is not the case, it may lead to further declines, so cautious trading is required.
-------------------------------------------------- -------------------------------------------
** All descriptions are for reference only and do not guarantee profit or loss in investment.
** If you share this chart, you can use the indicators normally.
** The MRHAB-T indicator includes indicators that indicate points of support and resistance.
** SR_R_C indicators are displayed as StochRSI (line), RSI (columns), and CCI (bgcolor).
** The CCI indicator is displayed in the overbought section (CCI > +100) and oversold section (CCI < -100).
(Short-term Stop Loss can be said to be a point where profit or loss can be preserved or additional entry can be made by split trading. This is a short-term investment perspective.)
---------------------------------

AVAXUSDT, 1HBINANCE:AVAXUSDT Potential Bearish Shark
Potential Reversal Zone:
BC Retracement (1.618 | 2.618)
Near: 13.79262
Far: 14.228
XA Retracement (0.886 | 1.13)
Near: 13.88285
Far: 14.1773
