AVAX 1H BUYAVAX 1H support is at ~$26
Enter 50% at the current price
and try to set some buy orders near the support zone
If AVAX holds above the trendline,
the Take-Profit target would be 5%, 10%, and 15% from your entry
Cheers
Avalanche

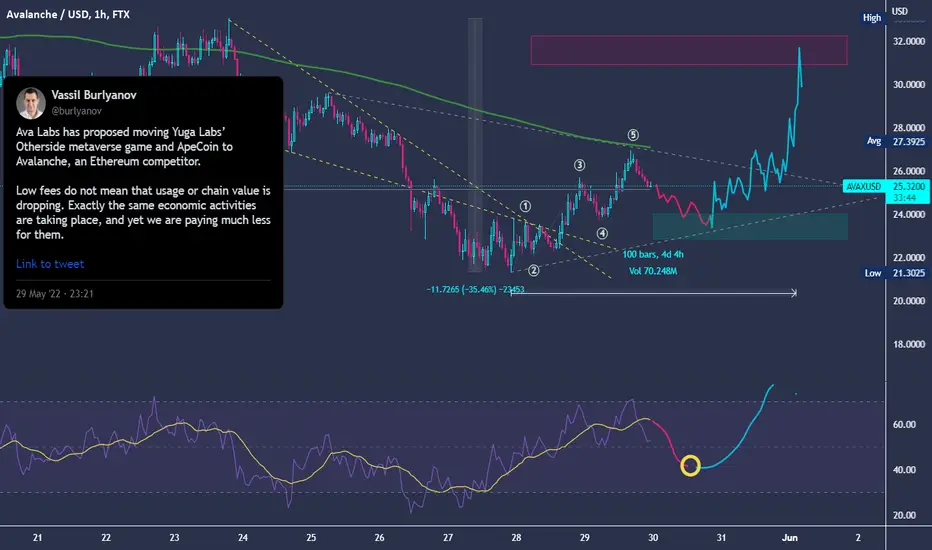
Avalanche - Short Term Swing Trading Idea - 29 May 2022FTX:AVAXUSD for a few days dropped over 35% and on bigger time frames start forming good price action upwards. In the next 3-4 days I expect gains of over 30% and hit a strong resistance level of over $31 per coin.
What is the supported thesis technically for the expected scenario on Avalanche?
- Price-action will be a strong signal in the next couple of hours
- By Elliot waves - there are 5 waves impulse and expecting classic A-B-C correction
- The RSI indicator will hit a bit lower before curving up
If you have any questions related to this trading idea I will be happy to provide you with answers. FTX:AVAXUSD
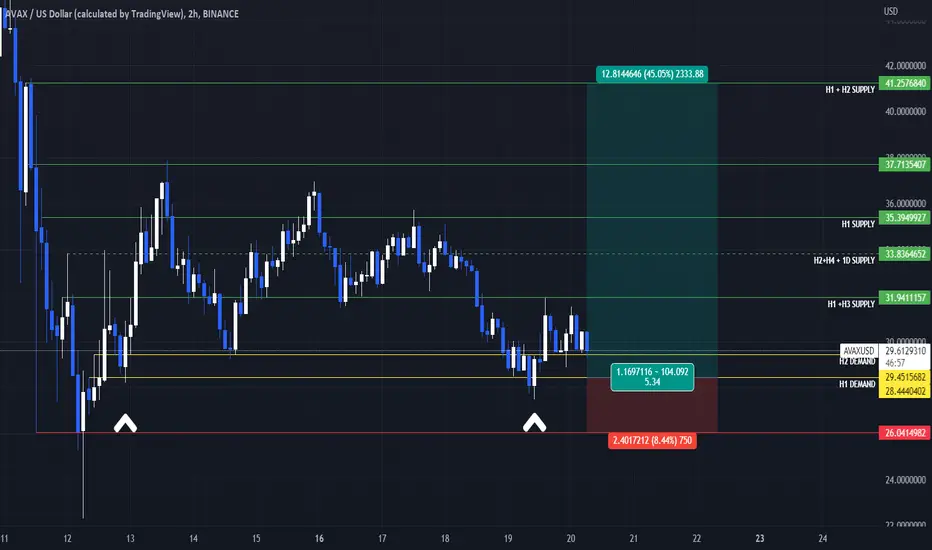
AVAX MANAGINGING TRIPLE TAP Details are mentioned in the chart . ENTER AT YELLOW LINE , STOP AT RED LINE , BAG UNLOADING AT GREEN LINES ESPECIALLY AT H1 SUPPLY .
AVAX/USDT - Short ScenarioHello Traders!
AVAX continues the development of the corrective movement. The price is looking for new support levels.
Price fixing under the MA100 on the two-day timeframe, as well as the exit of the RSI indicator in the bearish zone serve as confirmations in favor of the continuation of the development of the correction.
Accumulation of the asset should take place after the culmination of sales and the movement of the price in the zone of interest of buyers. A suitable price range for medium-term purchases is $10.25 - $13.35. It will be possible to continue to hold the position with the aim of fixing profits near the price level of $24.25
Good luck and watch out for the market
P.S. This is an educational analysis that shall not be considered financial advice

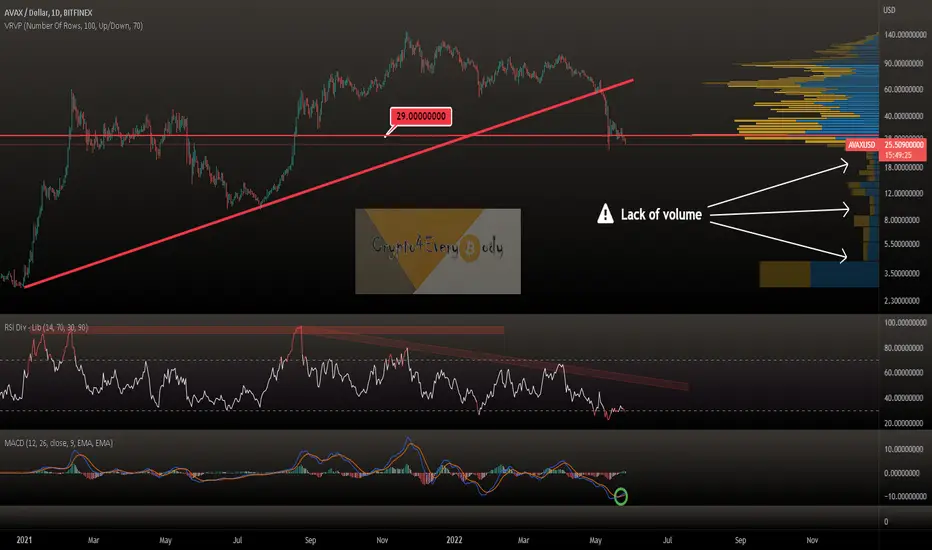
Avalanche (AVAX) at critical volume lackAvalanche (AVAX) at critical volume lack... despite the buy signal on MACD AVAX should turn around soon not to get into this lack of volume.
A bullish divergence on RSI and a confirmed break above $29 is what every fan of this Crypto wants to see.
What do you think?
Drop me a nice comment if you'd like me to analyze any other cryptocurrency.
*not financial advice
do your own research before investing
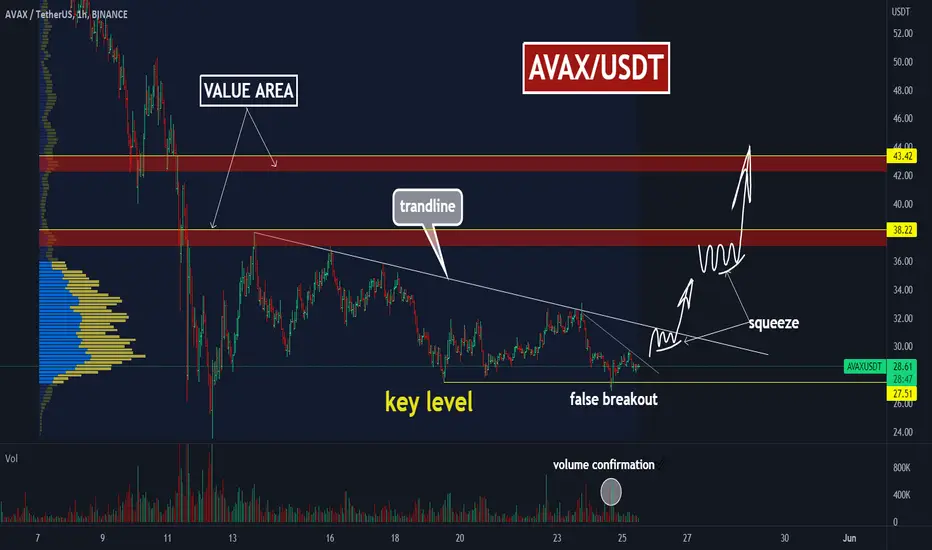
🔥AVAX: is it going to PUMP after 2 months fall?Avalanche (AVAX).Avalanche Trading Setup. The growth of volumes after a false breakdown indicates the buyer's presence! A large number of long traders closed their positions on their own or their stop losses were collected under the key level of $27.50.
📊When the price will be squeezed under the trend line - this will be the main signal to open the long. Also, local manipulations are possible, which will give additional confidence that a BIG player wants to accumulate enough liquidity to open a long position. A squeeze and breakout of the trend line is what we should wait for to open a long.
📊Globally, many retail traders opened short positions after 2 months of decline. But if the price of AVAX starts to rise together with the Bitcoin, we can expect a fast price growth. The short traders will be the fuel for the huge PUMP.
🎯Value areas and targets:
1. $38 (+23%)
2. $42 (+40%)
💻Friends, press the "like"👍 button, write comments and share with your friends - it will be the best THANK YOU.
P.S. Personally, I open an entry if the price shows it according to my strategy.
Always do your analysis before making a trade.
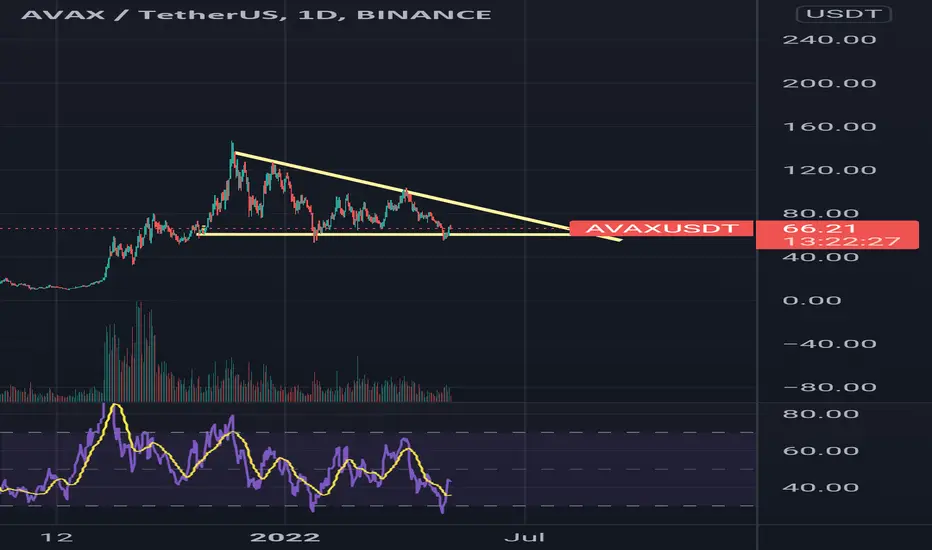
AVAXUSD, are sellers planning a new bear raid?Hello TradingView community, today we’re looking at AVAXUSD as price remains in a solid-looking downtrend. We are watching a consolidation pattern that could be a descending triangle or a wedge type pattern in the existing trend.
The key for us is at 28 support. If sellers break this level, the continuation could be on, and we would like to see a new LL set to show normal pattern of trend. If buyers can continue to hold 28 and above, this could be a worry for short term seller momentum that was set with a break of yesterday’s low this morning.
This pattern is also seen on SOLUSD, and other coins in the top 10 remain range-bound.
It’s really up to sellers now if they want to take this trend lower.
Good trading

$AVAX 1D breakdown update levels played out clean
could see some candles touching 41.17
will post a 4H chart next
has been the most traded asset along w $NEAR and $SOL
ww

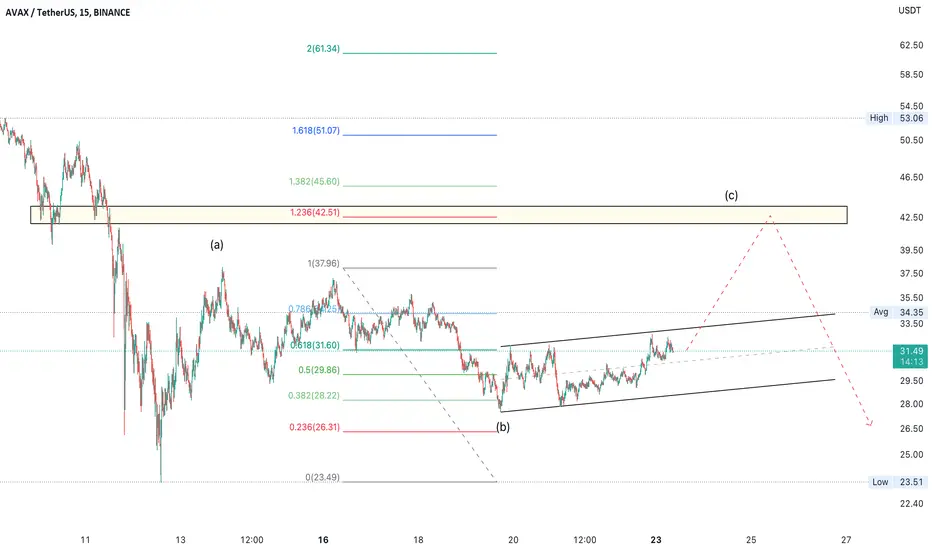
Prepare to last waveOn 15m chart
After dropped, BINANCE:AVAXUSDT is bouncing back to 45
Wave C = 1.236 wave A
Wait a confirmation at 33
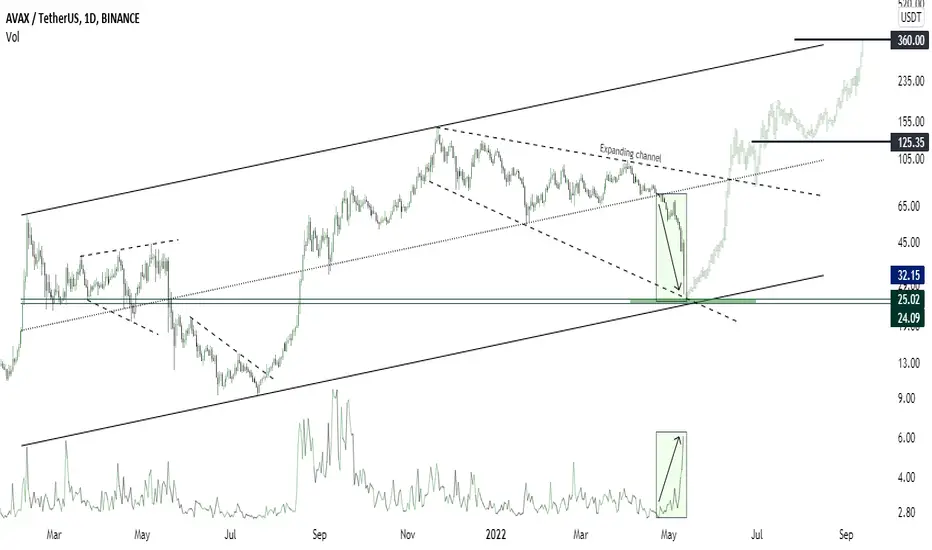
AVAXUSD hit the Channel Up bottom. Levels to watch.Avalanche (AVAXUSD) hit on May 12 the bottom (Higher Lows trend-line) of the Channel Up that started after its February 10 2021 High. That was its first High and May 12 marked its second Higher Lows. Assuming that holds, the pattern will continue to hold and we will have to look for specific markers in order to time a new uptrend.
As you see, there are three indicators that broke in a specific order during the last rise to a Higher High. First the price broke above the 1D MA50 (blue trend-line) following the Higher Low consolidation. Then the RSI on the 1W time-frame crossed above its MA. Finally the 1W MACD made a Bullish Cross. Keep an eye on those conditions and plan a potential buy strategy accordingly.
On the other hand, a weekly (1W) candle closing below the Higher Lows trend-line of the Channel Up, can set in motion the lower Fibonacci extensions, namely the -0.236 and -0.382 before the market bottoms out.
--------------------------------------------------------------------------------------------------------
Please like, subscribe and share your ideas and charts with the community!
--------------------------------------------------------------------------------------------------------

Avalanche (AVAX) - May 19hello?
Traders, welcome.
If you "follow", you can always get new information quickly.
Please also click "Like".
Have a nice day.
-------------------------------------
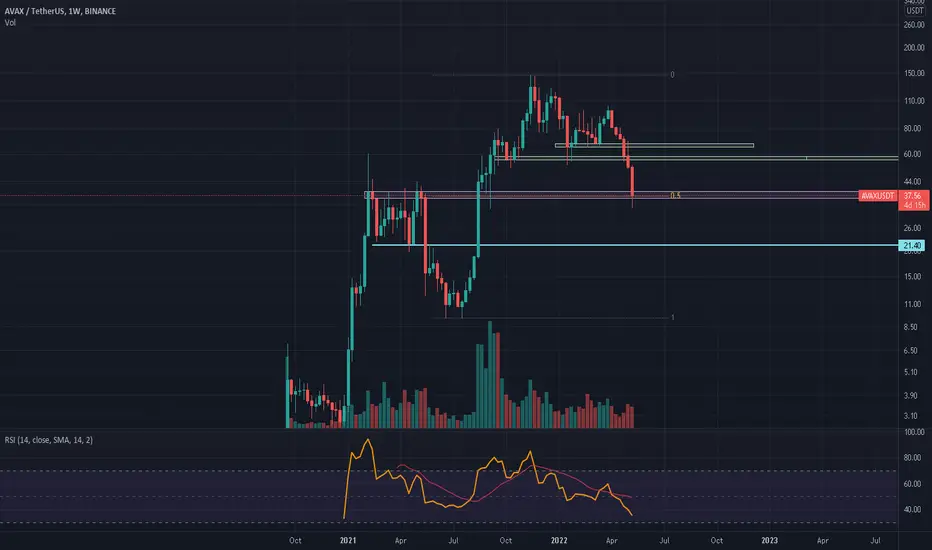
(AVAXUSDT 1W Chart)
As it fell below 32.23, the possibility of entering the mid- to long-term investment sector is increasing.
Therefore, it is important to see if it rises above 32.23.
------------------------------------------------------------ -----------------------------------------------------
** All indicators are lagging indicators.
Therefore, it is important to be aware that the indicator will move accordingly as price and volume move.
However, for convenience, we are talking in reverse for the interpretation of the indicator.
** The MRHAB-T indicator used in the chart is an indicator of our channel that has not been released yet.
** The OBV indicator was re-created by applying a formula to the DepthHouse Trading indicator, an indicator disclosed by oh92. (Thanks for this.)
** Support or resistance is based on the closing price of the 1D chart.
** All descriptions are for reference only and do not guarantee a profit or loss in investment.
(Short-term Stop Loss can be said to be a point where profit and loss can be preserved or additional entry can be made through split trading. It is a short-term investment perspective.)
---------------------------------

AVAX Bearish PennantBearish Pennant formed with lower highs, higher lows, and 3 touch points on each trend line. Enter into short on break of lower trendline and retest. Target profit just above local bottom of $23.30. Stop loss slightly above break of upper trend line. Best of luck and DYOR, not financial advice.
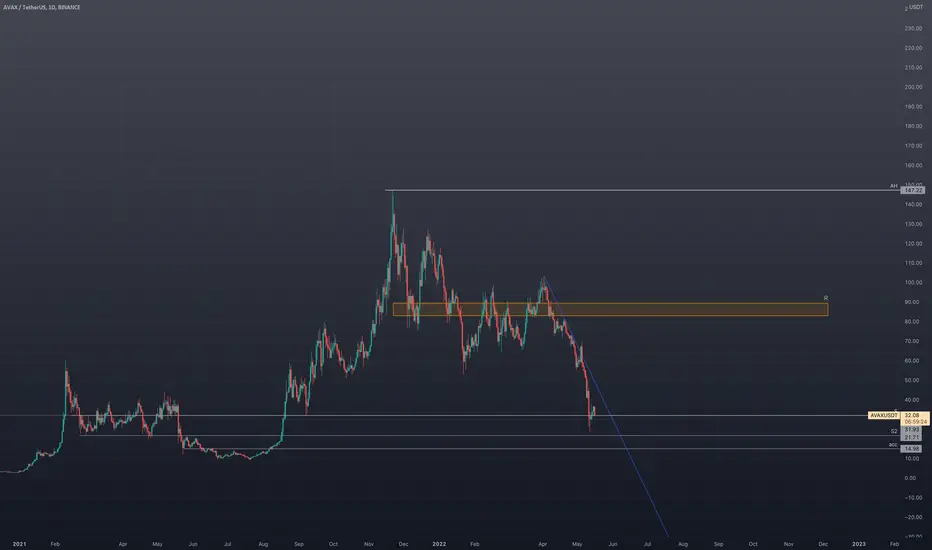
AVAX expected path for the upcoming weeks- follow me for morehey, i am merna, a middle-eastern analyst, follow me for more ideas and quotes on twitter! luv ya ❤️
AVAX price drop was expected due to the broke 2 ascending trend lines, which made it go down to a find a powerful support line.
S line and S2 line are powerful support lines, breaking them is not a good sign, breaking the blue trendline will make us go to the nearest resistance which is the R orange box.
S = support
S2= 2nd support
R = resistance
acc = where most of the big players entered long positions , when price approaches these levels they will defend their positions hard.
AH = all-time high
AVAX REACHED THE BOTTOM...! (WHAT'S NEXT?!)Following our recent expectations of a further market downturn, Avax also reached the bottom of its channel and we saw an initial not-so-favorable reaction. It is expected that we will see a good growth of this currency due to attracting liquidity and increasing the volume of daily transactions and if the market reform is completed (which is not certain!).
Avax Long viewExelent opportunity to start accumulating Avax for the long term.
Price hiting a huge support area (Pink order block) AND perfleclty matching with the 0,5 level of Fib;
#Keep it Simple
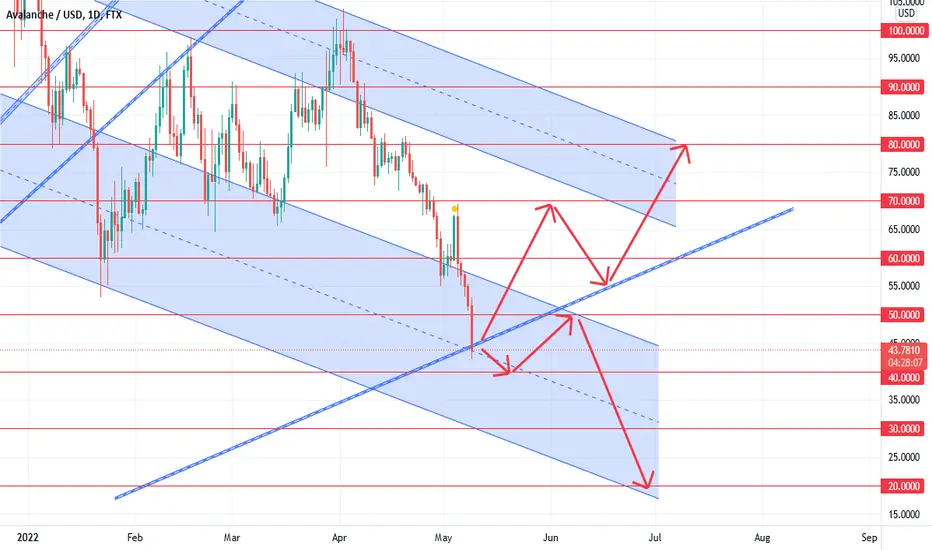
AvalancheBreaking out of the triangle defines mid-term targets for the Avalanche.
Breakdown of the key support level $60.00, which is the point of intersection of the triangle trendline at D-1, is a strong signal for the continuation of the current trend. The target of $50.00 per coin will be a clear confirmation of the breakout of the key crossover. The support level at $50.00 looks technically confident for considering short and medium-term purchases within the descending channel with the target at $70.00-80.00. The subsequent potential break of $50.00 support opens technical targets for a test of $40.00 and key support at $20.00.
Avalanche Fibö ChannelHi there, I have been posting Fibonacci (with a slight modification) updates for some time now and decided to finally publish the original chart here. Please note that this chart is for entertainment purposes only. Not financial advice.

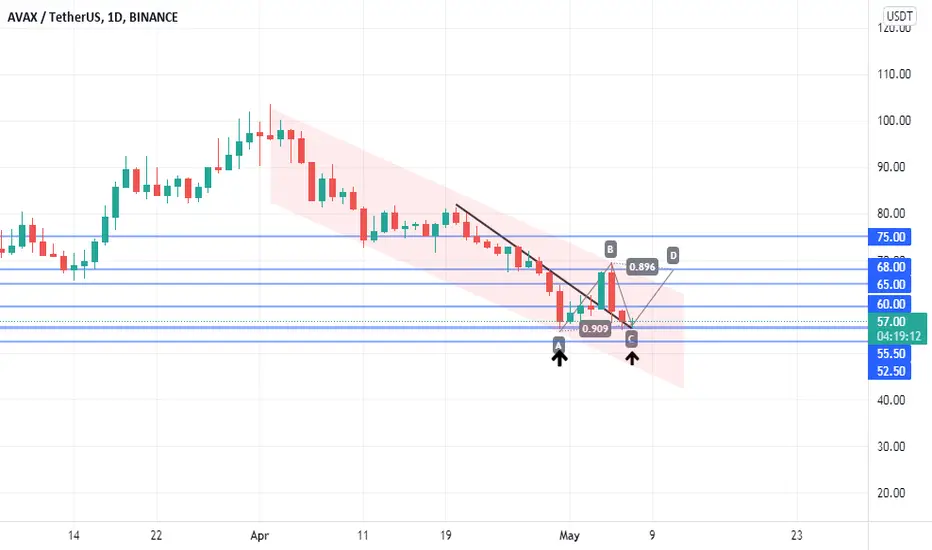
AVAX-Good context to go upHello everyone
With the spike in the price from couple of days ago on AVAXUSDT, we may have a bounce from the previous bear trend line.this setup also created, a double bottom, a divergence in RSI and the ABC pattern.With all that said , the price is still in a bear channel and a breakout is needed.
The resistance levels are 60$, 65$ and the upper line of our bear channel, and for the support levels we have 55.50$,and 52.5$.
AVAX Investment Opporutunity📆🟡 AVAX/USDT (Avalance)
📊 Time Frame: 4H
➖➖➖➖➖➖➖➖➖➖➖➖➖➖
💎 Investment Opporutunity
🟢 BUY : 50.5$ - 55.5$
🟢 BUY : 40.5$ - 45.5$
🎯TP: 64$ - 72$
💹 Stop loss: One Daily Candle below 38$
✍ Analysis Method : ICT+ Neural Network
📆05.07.2022

AVAX Spot Locationsi admit that spot is easier than future
this spots must be seen, tomorrow or 2 years later so set the order
good luck
AVAX could be getting ready too?Hello traders,
Back in the 'bullish days' last year AVAX did an incredible job. Project itself is interesting, seems to me like an upgraded competitor with DOT. However interest that AVAX had back then was quite suprising. It is correcting so far, but I'd expect 75-90$ region soon (when we reach diagonal ressistance) if it breaks I wouldn't be suprised at all with 200-250$ topping.
If you like my ideas, please consider following me on Tradingview and twitter, it would help me a lot.
Do your own reasearch and learning,
Trade safe, TradingInformator!
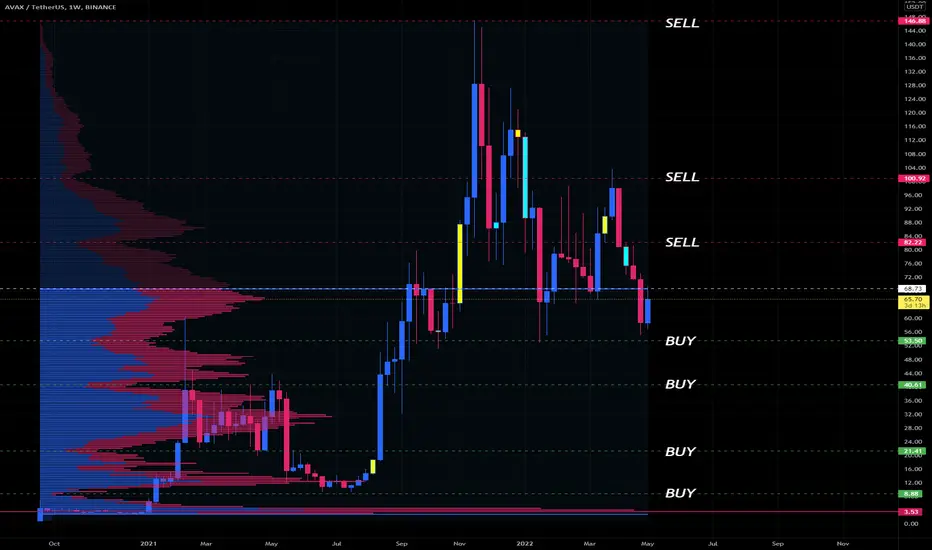
Avalanche (AVAX) - May 5hello?
Traders, welcome.
If you "follow", you can always get new information quickly.
Please also click "Like".
Have a nice day.
-------------------------------------
(AVAXUSDT 1W Chart)
56.51 or higher: Expected to create a new wave.
(1D chart)
It needs to move above 70.11 to turn into an uptrend.
So, if possible, it's a good idea to see support in 70.11.
(buy)
- After confirming the support in 70.11
(Stop Loss)
- When it is resisted by falling below 64.90
- When it falls below 56.51
(Sell)
- When resistance is received in the range 79.80-89.59
- When receiving resistance near 109.43
(buy)
- After confirming the support at 64.90
(Stop Loss)
- When it falls below 56.51
(Sell)
- When receiving resistance near 70.11
- When resistance is received in the range 79.80-89.59
- When receiving resistance near 109.43
A move above 89.59 is expected to trigger a sharp move.
A break below 56.51 is expected to turn into a downtrend.
------------------------------------------------------------ -----------------------------------------------------
** All indicators are lagging indicators.
Therefore, it is important to be aware that the indicator will move accordingly as price and volume move.
However, for convenience, we are talking in reverse for the interpretation of the indicator.
** The MRHAB-T indicator used in the chart is an indicator of our channel that has not been released yet.
** The OBV indicator was re-created by applying a formula to the DepthHouse Trading indicator, an indicator disclosed by oh92. (Thanks for this.)
** Support or resistance is based on the closing price of the 1D chart.
** All descriptions are for reference only and do not guarantee a profit or loss in investment.
(Short-term Stop Loss can be said to be a point where profit and loss can be preserved or additional entry can be made through split trading. It is a short-term investment perspective.)
---------------------------------

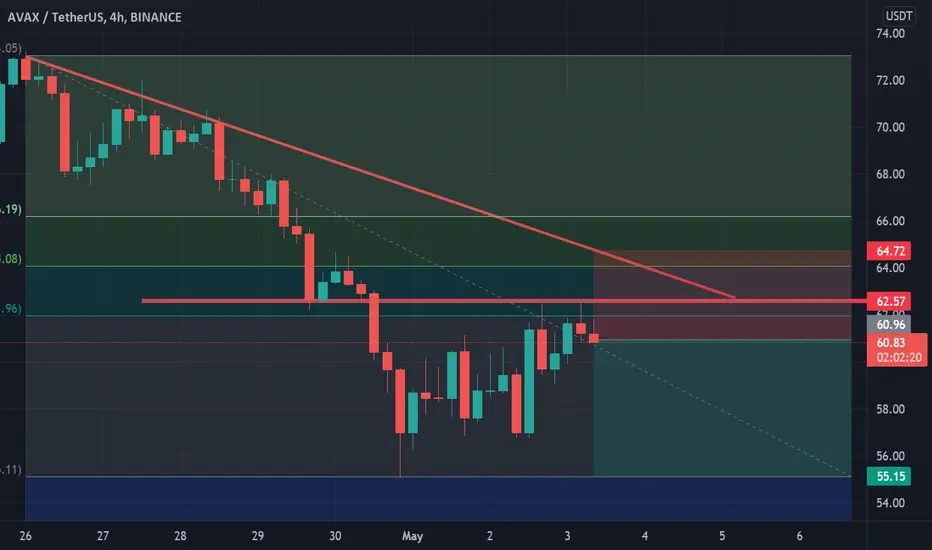
short on AVAX$AVAX is bouncing off the Fibonacci 0.5 retracement level. Bearish trend is likely to continue and reach the recent low at 55,15$